The Federal Reserve is almost certainly about to raise interest rates. And yet, the analysts watching most closely are not convinced the US Dollar will reach new highs because of it. That contradiction is the puzzle worth understanding this week.
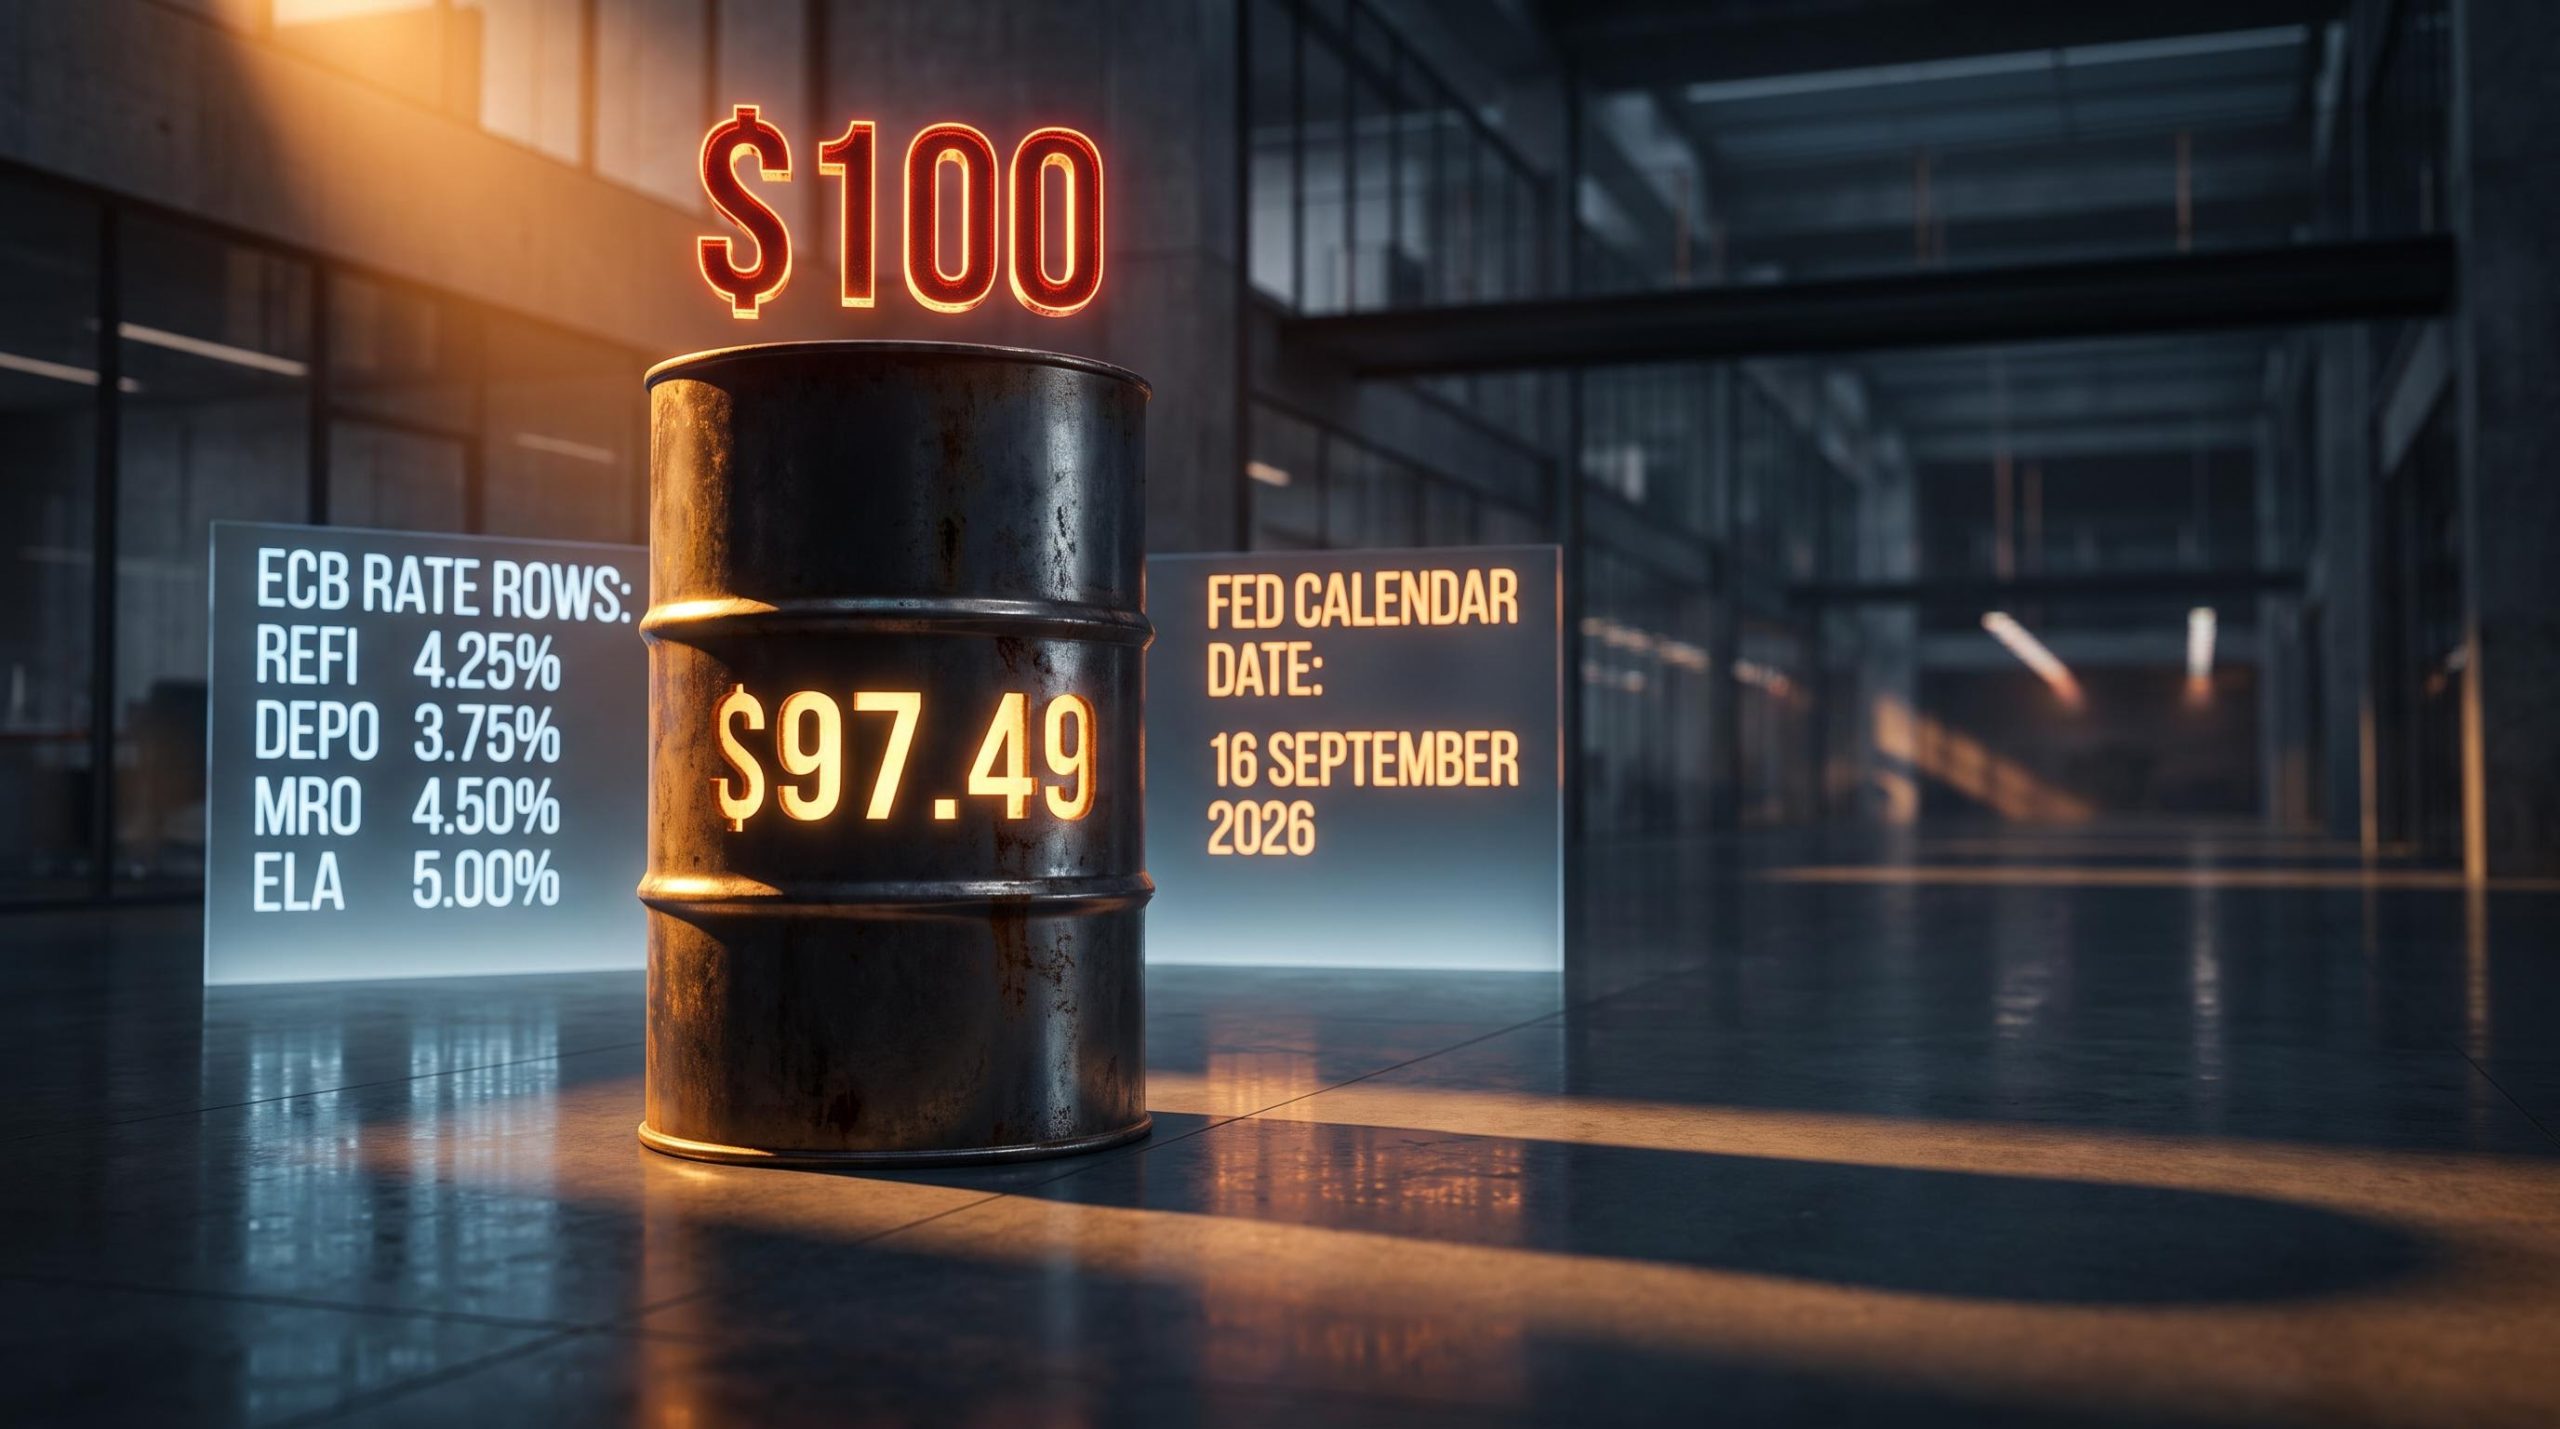
This is an unusually compressed stretch of the macro calendar. Brent crude is sitting at $97.49 per barrel and pressing toward the psychologically loaded $100 mark, the August US Consumer Price Index (CPI) lands on Friday and will effectively settle the Fed’s direction at its 16 September 2026 meeting, and the European Central Bank (ECB) has already delivered its own 25 basis point hike back in June 2026.
Most people meet these as three separate headlines. They are not. They form a single system of pressures that push against each other, and reading them in isolation is how investors get caught out.
What follows breaks down how each force works, why they conflict with one another, and what that conflict actually tells you about where markets are likely to move next. Treat it as a repeatable lens for macro market analysis, not a one-off explanation of a single week.
Why oil near $100 is not just an energy story
Brent crude touched $97.67 on 7 September 2026, a six-week high, according to Trading Economics, and settled at $97.49 the following day, per Investing.com. The number itself is almost the least interesting part. The mechanism behind it is what should hold your attention.
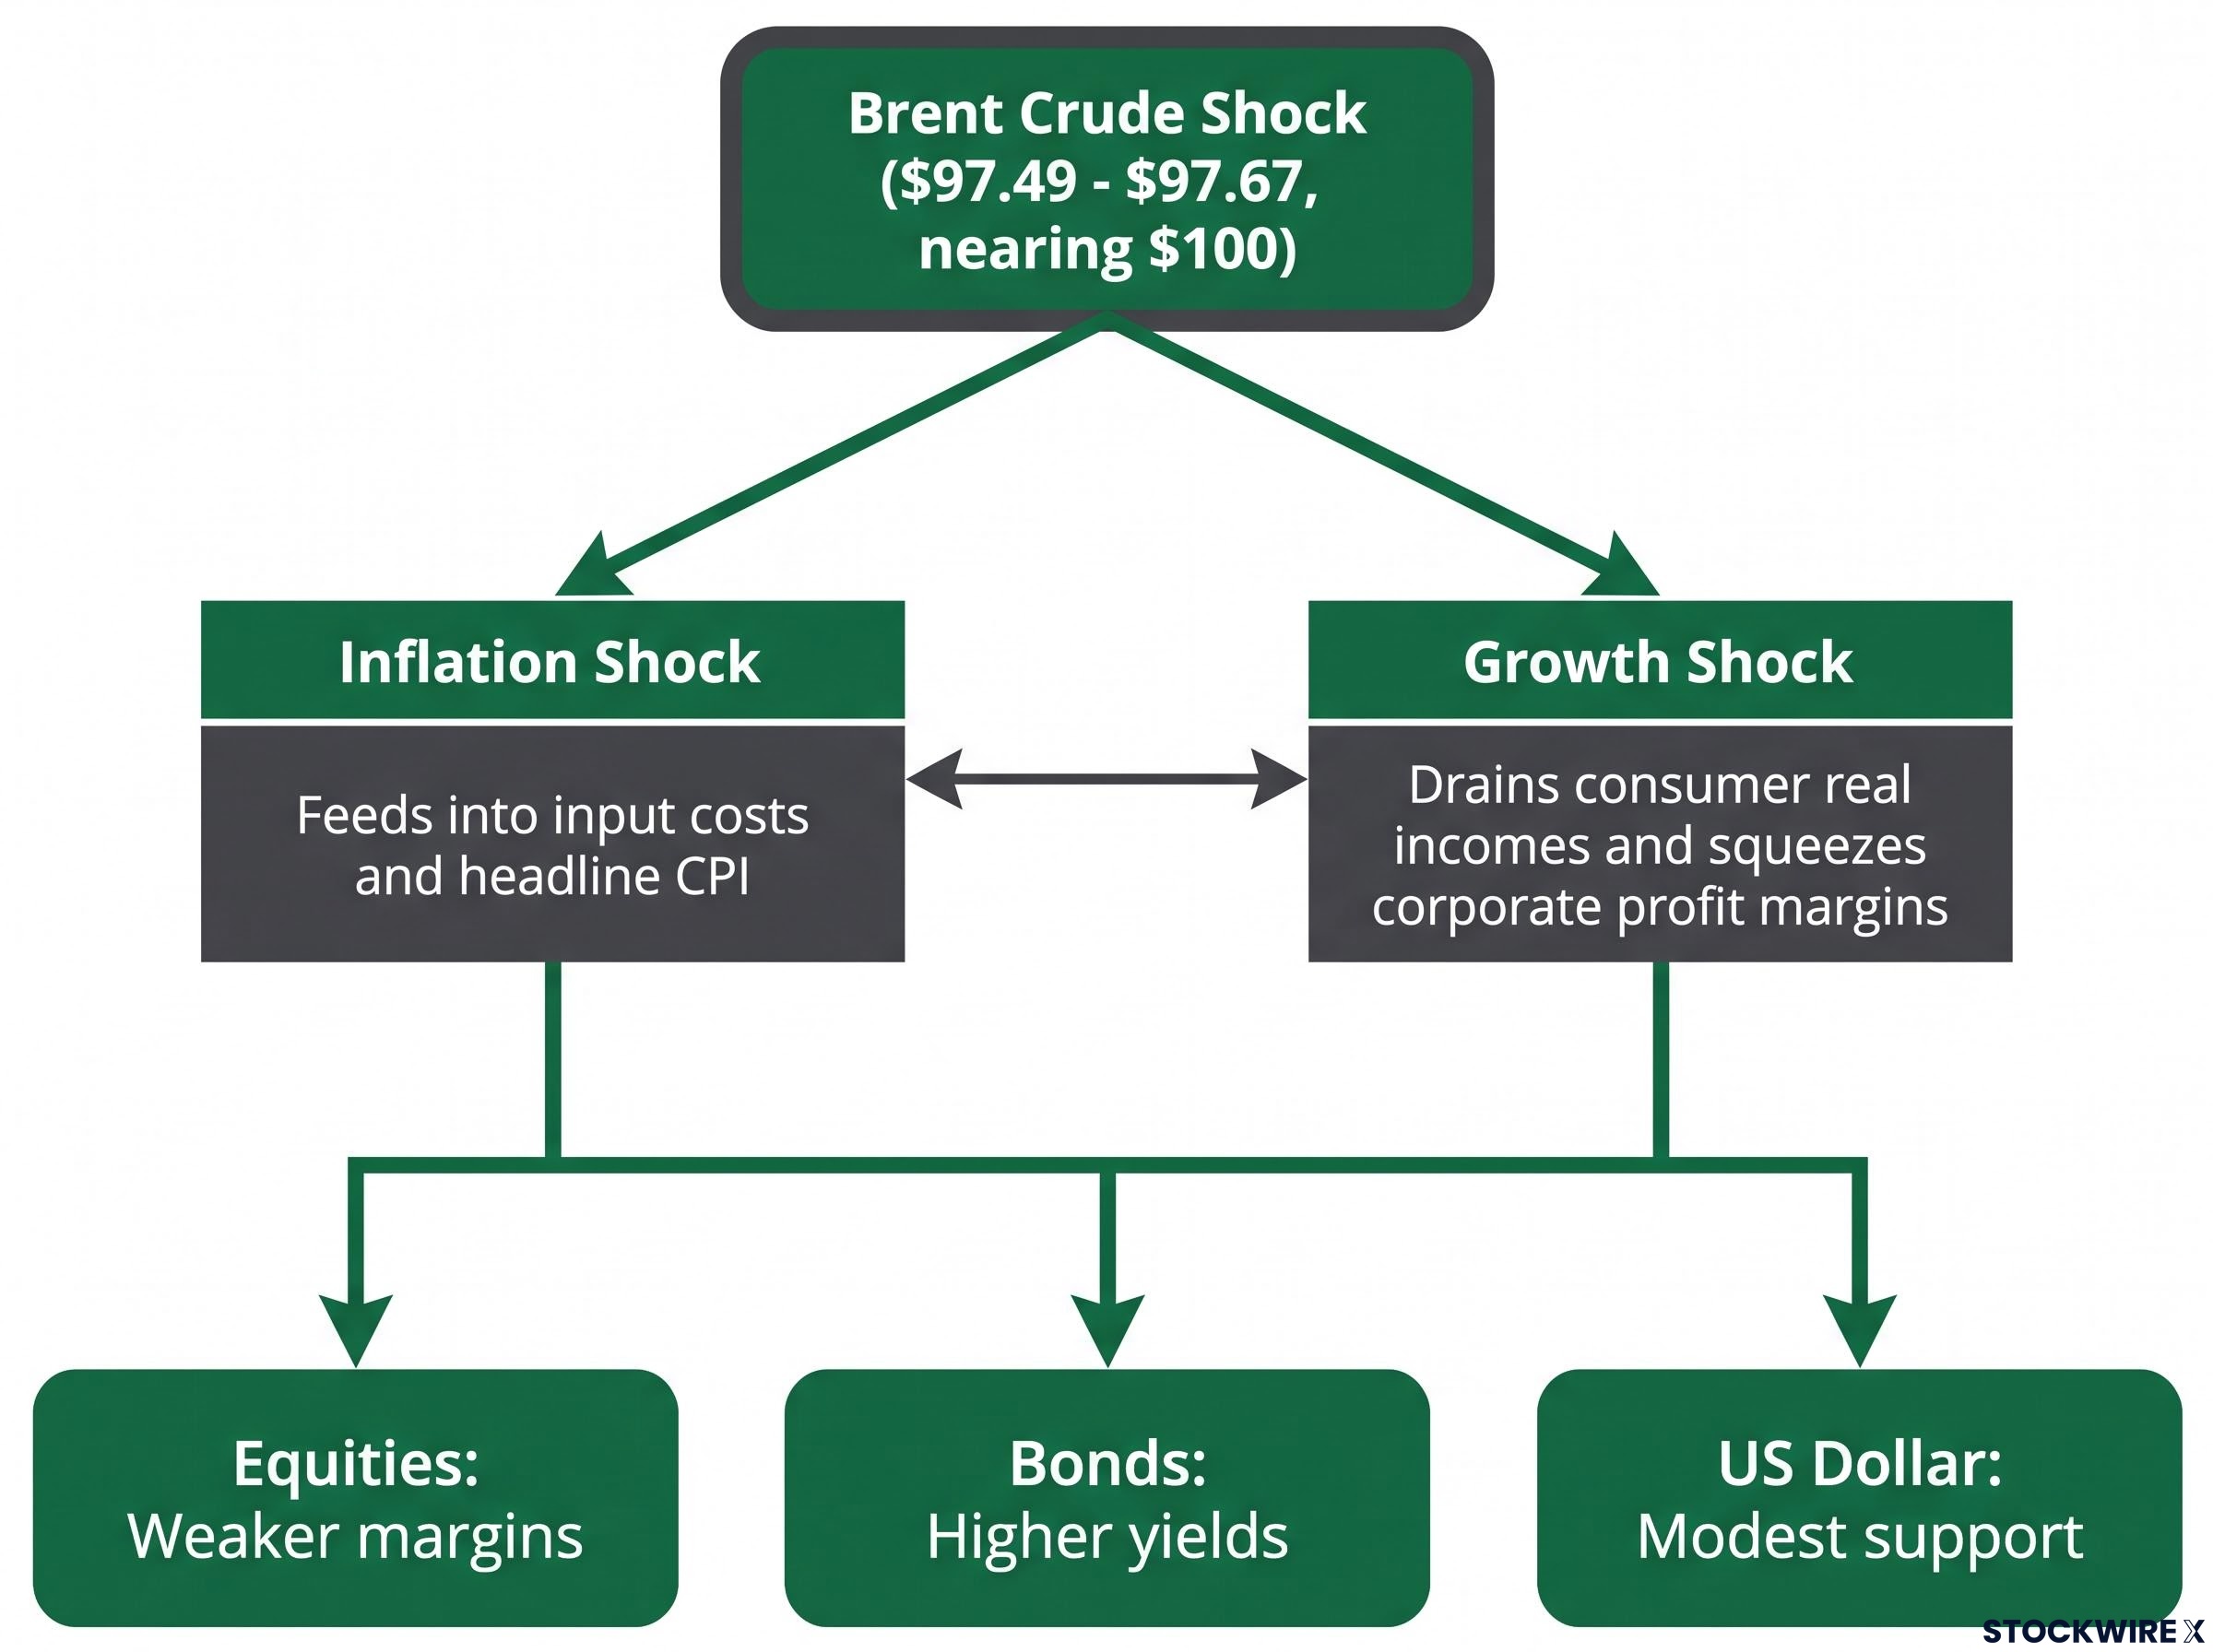
A crude price this high acts as two shocks at once. It is an inflation shock, because energy feeds directly into input costs and headline CPI. It is also a growth shock, because it drains consumer real incomes and squeezes corporate profit margins. Those two effects pull in opposite directions, which is why oil near $100 does not hand any single asset class a clean signal.
Cost-push inflation dynamics of this kind, where supply shocks drive prices rather than excess demand, transmit through the economy in three distinct stages: energy costs rise first, then logistics and input costs follow, and consumer prices adjust last, often with a lag that makes the full inflationary impact difficult for central banks to model in real time.
The trigger this week was geopolitical. Iran-backed Houthi militants reportedly struck Saudi oil infrastructure on consecutive days, Monday and Tuesday, layering a fresh risk premium onto an already tight supply picture.
Here is how that shock lands across the three markets you are most likely watching:
- Equities: Higher input costs and weaker consumer demand compress profit margins, pressuring valuations, especially in energy-intensive sectors.
- Bonds: As oil feeds into inflation, investors demand higher yields to compensate for that risk, pushing bond prices lower.
- US Dollar: Only modest support. A global energy shock hurts US growth too, and with other central banks tightening, the usual yield advantage narrows.
That last point is where most assumptions break. A rising oil price is often read as reflexively Dollar-positive. BBH analyst Elias Haddad disagrees in the current environment.
The USD benefit from rising oil prices is limited rather than substantial, according to BBH analyst Elias Haddad.
For you, this means a Brent spike toward $100 is not a tidy bullish trade for anything. It weighs on equity valuations, lifts bond yields, and offers the Dollar only a partial lift. The threshold matters less as a round number than as the point where energy costs start generating second-order effects across several asset classes simultaneously.
When big ASX news breaks, our subscribers know first
What the August CPI print will actually decide, and what it cannot
Markets are placing an enormous amount of weight on one data release. The August CPI, due Friday ahead of the official 11 September 2026 publication date, has become the primary near-term catalyst, and according to Haddad, it will effectively determine the Fed’s call on 16 September.
The logic is straightforward. The September meeting sits close enough that this print is functionally the last major inflation reading the committee sees before it votes. That timing hands one number outsized influence over how markets price the outcome.
An elevated reading strongly reinforces the case for a hike and lends the Dollar support. A softer reading revives the argument for a hold and exposes the Dollar to selling. That is the binary the market is bracing for.
The problem is that the binary is a trap. Here is why leaning your positioning on a single CPI print is a documented way to get mispriced:
- The Fed watches a broad basket. Labour markets, PCE inflation, financial conditions, and global risks all feed the decision, and the committee tracks trends, not individual releases.
- Single prints get distorted. Energy swings, seasonal quirks, and one-off component moves can push a number around before reversing the following month.
- Expectations and conditions carry equal weight. Medium-term inflation expectations and broader financial conditions often matter as much to the reaction function as the headline rate itself.
Markets have repeatedly overreacted to one CPI number, only to reprice when the surrounding data told a different story. The number matters. The Fed’s response to it depends on a picture that a single print cannot capture.
Why inflation expectations matter as much as the headline number
There is a second signal landing the same day this publishes: the August New York Fed consumer inflation expectations survey, out at 4:00pm London time (11:00am New York). Haddad flags it as an important read.
What matters here is whether long-term expectations stay anchored. If they do, the urgency for aggressive further tightening eases, even with a hot near-term CPI.
Inflation expectations anchoring is a more consequential variable than the headline CPI number itself: Goldman Sachs research published in August 2026 concluded that US long-run expectations were at most modestly elevated and not at immediate risk of unanchoring, a finding that directly shapes how much policy urgency the Fed attaches to any single elevated print.
The reverse would be far more serious. A de-anchoring of long-term expectations would shift the Fed’s posture from patient and data-dependent to reactive, a fundamentally weightier development than one elevated CPI reading on its own.
How synchronized tightening changes the Dollar equation
Here is the mental model most investors carry: the Fed hikes, so the Dollar rises. It is intuitive, and in a Fed-only world it broadly holds. In the current world it does not, and understanding why is the single most useful thing you can take from this week.
Currency strength is driven by changes in interest rate spreads between countries, not by absolute rate levels. When both the Fed and the ECB are hiking, the spread between them narrows relative to a scenario where only the Fed is moving. That narrower spread reduces the incentive to hold Dollars purely for yield.
Global central bank divergence across the Fed, ECB, and Bank of Japan in mid-2026 has created three analytically distinct policy paths despite superficially similar hold decisions, with Deutsche Bank projecting 50 basis points of ECB hikes even as euro area GDP growth sits at just 0.5%, a combination that makes the spread compression dynamic far more complex than the simple Fed-versus-ECB framing suggests.
This is exactly why the ECB’s June 2026 move matters. By lifting all three of its key rates, the euro area stepped away from ultra-low policy and closer to the Fed’s stance, structurally capping how far US and euro-area short rates can diverge.
Here is where the ECB sits after a year of decisions:
| Date | Decision | Deposit | MRO | Marginal lending |
|---|---|---|---|---|
| 5 February 2026 | Held | 2.00% | 2.15% | 2.40% |
| 19 March 2026 | Held | 2.00% | 2.15% | 2.40% |
| 30 April 2026 | Held | 2.00% | 2.15% | 2.40% |
| 11 June 2026 | Raised 25 bp | 2.25% | 2.40% | 2.65% |
| 23 July 2026 | Held | 2.25% | 2.40% | 2.65% |
The strategist debate splits into two camps, and both deserve a fair hearing. One view holds that residual US growth outperformance and safe-haven status can still push the Dollar higher even with a narrower spread. The other holds that once global tightening is well advanced and valuations are stretched, the Dollar is more likely to consolidate or mean-revert than set fresh highs.
Haddad sits firmly in the second camp.
Even if a September Fed hike becomes a near-certainty, analysts express skepticism that the Dollar will reach new cyclical peak levels, given concurrent tightening by other leading central banks.
The ECB’s “meeting by meeting” stance keeps this convergence dynamic alive rather than closed. For you, the practical read is this: the reflex to buy Dollars on a hawkish Fed outcome needs tempering by a second question, namely what the ECB and others are doing at the same time. Synchronized tightening compresses the very spread that normally drives Dollar appreciation.
Understanding multi-variable macro analysis: how the forces interact in practice
You now have three separate stories: oil, CPI, and rate differentials. The analytical skill is refusing to keep them separate. Multi-variable macro analysis means treating oil prices, inflation data, central bank policy, and currency moves as a single connected system rather than a queue of isolated inputs.
Watch how this week’s inputs chain together. Elevated oil lifts near-term CPI, which raises the probability of a Fed hike, which would normally support the Dollar. But synchronized ECB tightening compresses the rate differential, muting that support. Meanwhile the growth shock from high oil weighs on the equity risk premium. The net cross-asset outcome is genuinely ambiguous, not directional.
This is what conflicting catalysts look like. Not every macro event points the same way at the same time, and even policymakers admit as much. ECB commentary from the July meeting flagged “elevated uncertainty” and said the full inflationary impact of the energy shock had yet to emerge.
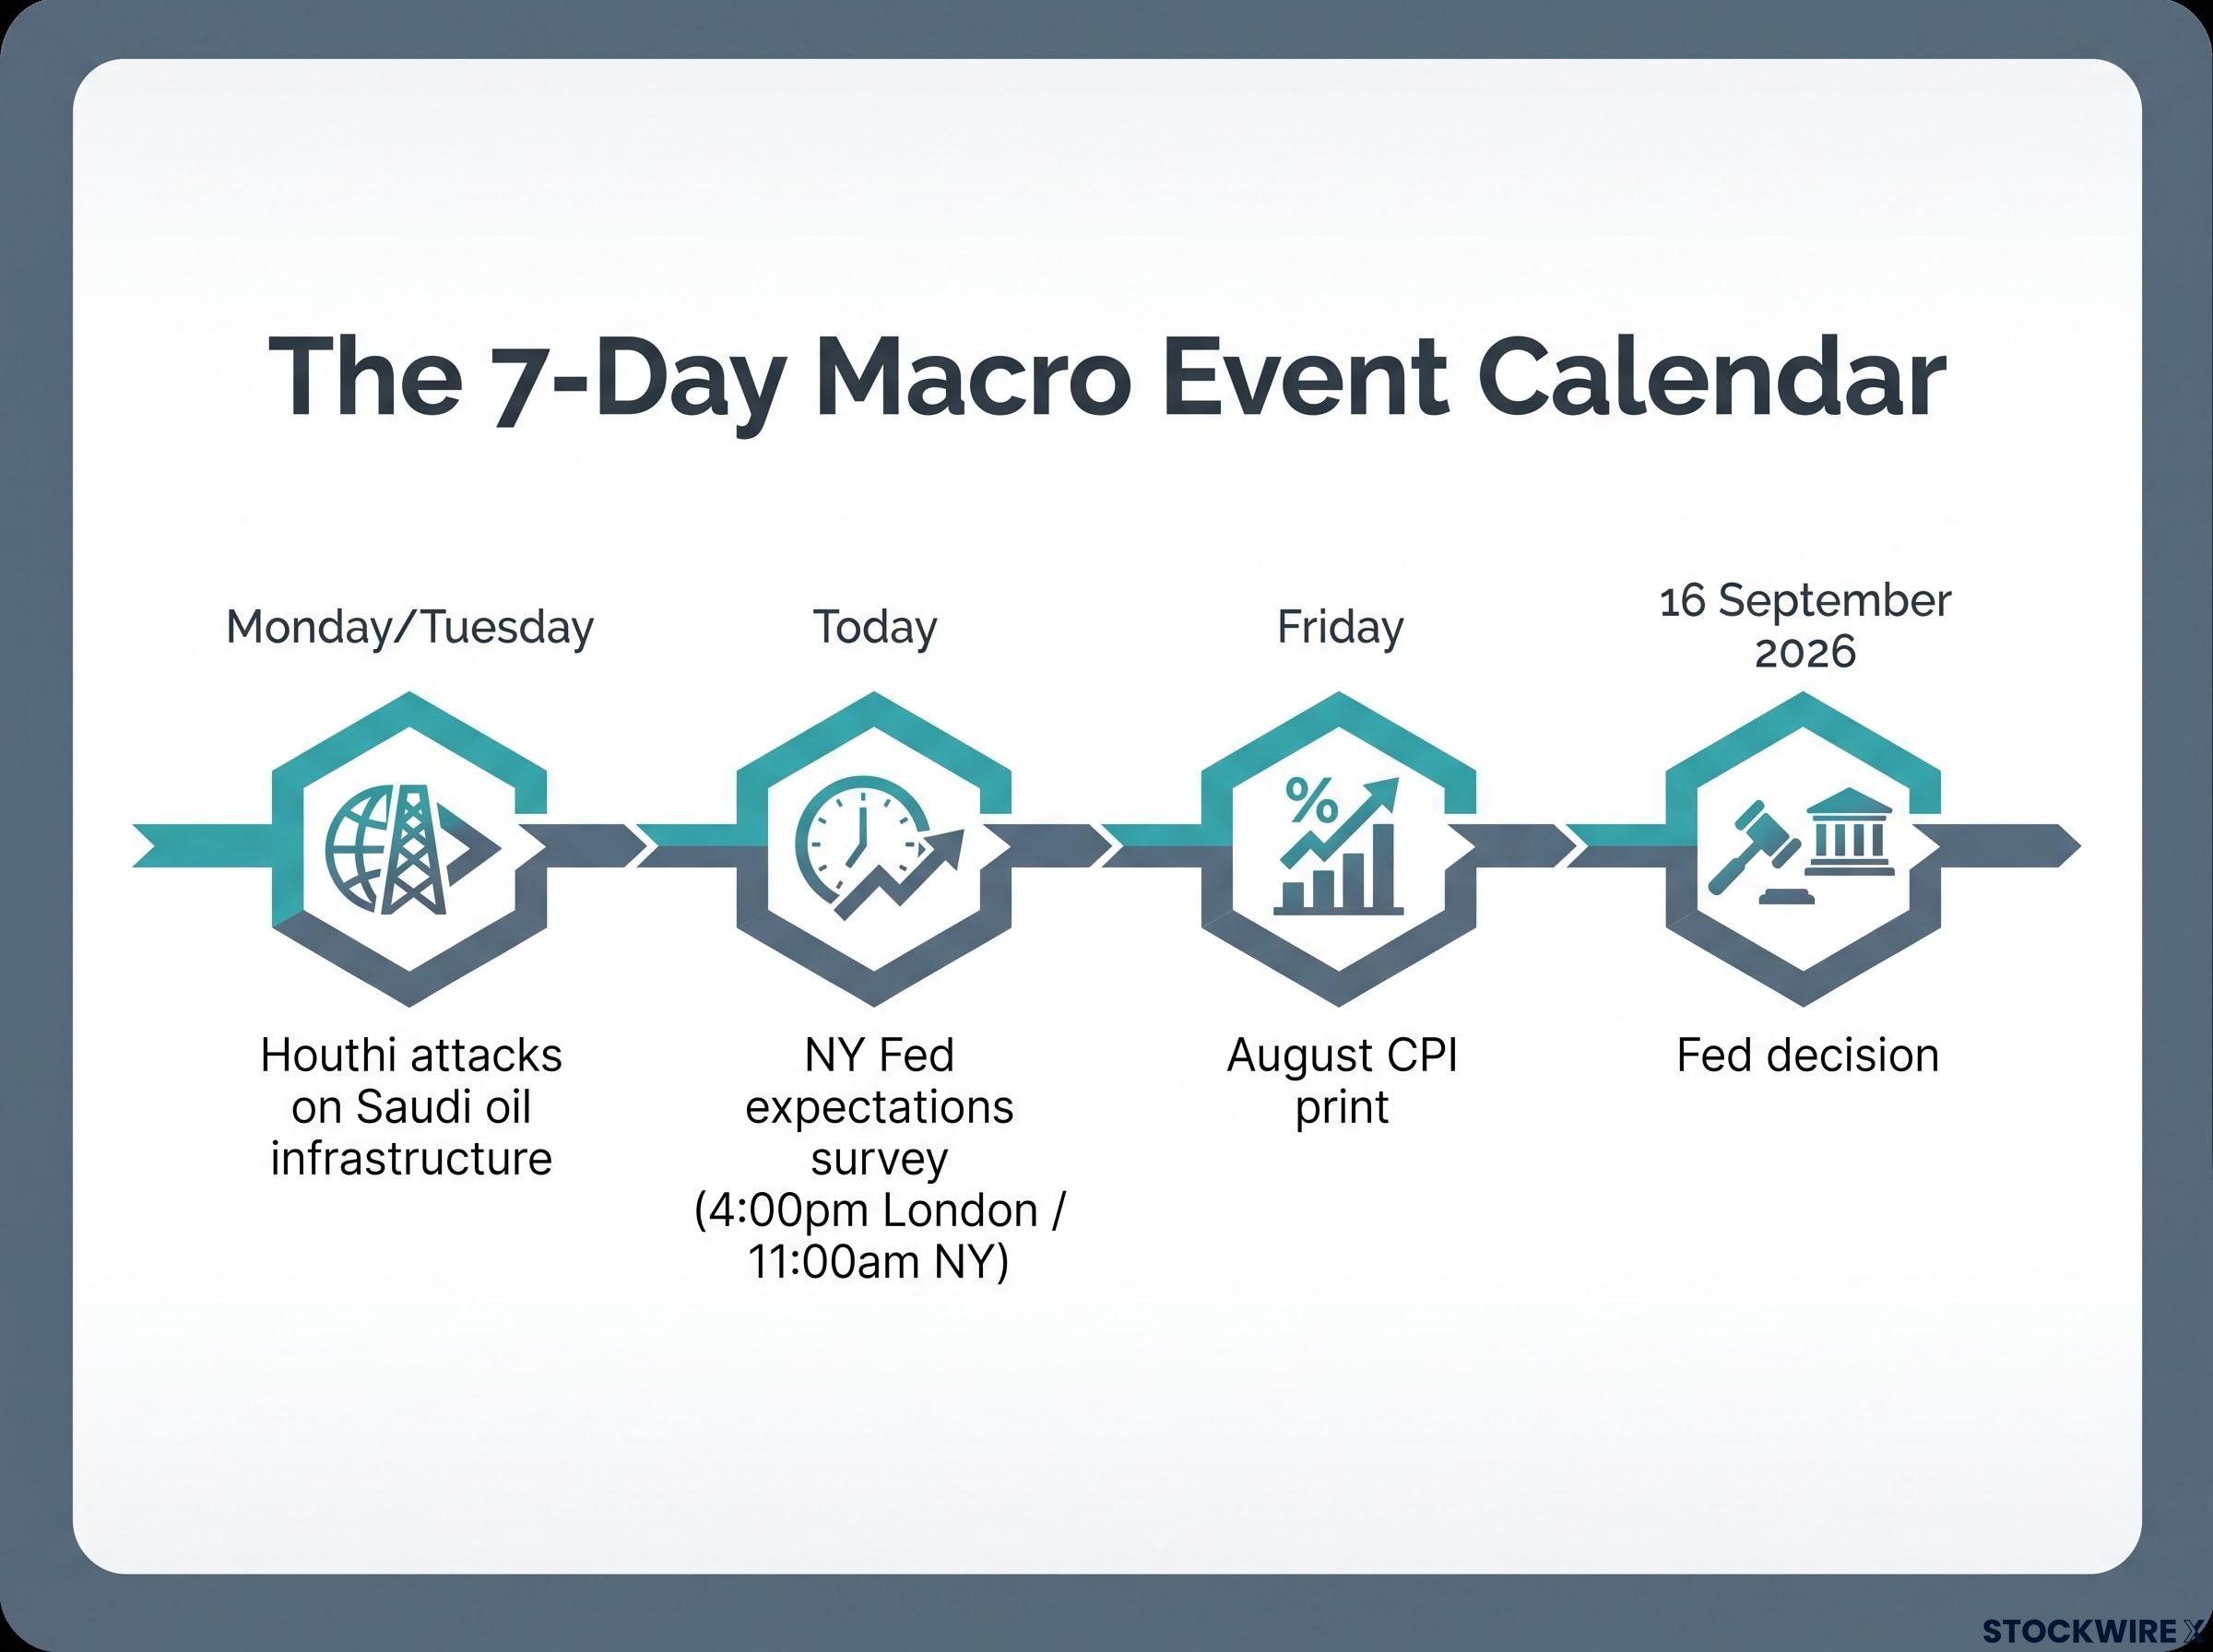
The whole event calendar sits inside a single seven-day window: Houthi attacks on Monday and Tuesday, the NY Fed expectations survey today, the August CPI on Friday, and the Fed decision on 16 September. Four catalysts, one week, pulling in different directions.
Reading a conflicted macro week: a practical three-step approach
Here is a repeatable framework you can apply to any week where multiple forces converge:
- Identify alignment and conflict. This week, oil and CPI both point toward a hike (aligned), but synchronized ECB tightening and the growth shock work against Dollar strength (conflict).
- Find the shortest resolution timeline. The CPI print on Friday resolves fastest, which is why it is the market’s focus, followed by the Fed decision on 16 September.
- Test whether structural forces override the near-term catalyst. Even a hot CPI confirming a hike runs into the longer-duration reality of a compressed rate spread. That is why the near-term bullish Dollar signal may not carry through.
Markets have historically mispriced Fed decisions by overreacting to single-variable signals. The framework’s job is to stop you making the same error, by forcing you to weigh each catalyst against the others rather than betting the week on one number.
What the ECB’s posture reveals about the limits of central bank guidance
There is a comforting assumption that central banks can tell you where policy is going. The ECB’s own language this year quietly dismantles it, and that turns out to be reassuring rather than alarming.
Its “meeting by meeting” stance and its July acknowledgment that the energy shock’s full inflationary impact had yet to emerge are not hedging for its own sake. They are honest admissions that forward guidance has structural limits when uncertainty is high.
The full inflationary impact of the energy shock had yet to emerge, according to ECB commentary from its July 2026 meeting.
Data-dependent communication has a paradoxical effect: it can raise volatility rather than lower it. When every release becomes a potential pivot point, the horizon over which markets can confidently price policy shrinks, which amplifies how sharply asset prices react to individual prints like Friday’s CPI.
For context, the ECB’s rate structure and projections tell a two-speed story:
- Deposit facility: 2.25%
- MRO: 2.40%
- Marginal lending: 2.65%
- Medium-term inflation projections: 2.6% (2026), 2.0% (2027), 2.1% (2028)
The baseline is convergence to the 2% target, reconfirmed back in February. The near-term path is explicitly uncertain. Both things are true at once.
When the institution setting rates says it cannot see the full picture
Combine that admission with crude at $97.49 pushing toward $100, and the near-term path looks more volatile than those tidy medium-term projections suggest. The most significant variable right now is also the one both policymakers and markets are least able to forecast.
This is not a failure of the ECB. It is a structural feature of cost-push inflation, the kind driven by supply shocks rather than demand, which is inherently harder to model than demand-led inflation.
For you, the takeaway is a change in posture. Read central bank guidance not as a roadmap but as a probability-weighted statement that will be revised as energy effects feed through. Any confident three-to-six-month call on euro-area rates is being made against a backdrop where the institution setting those rates has said it cannot yet see the whole picture.
Making sense of the next macro event with this week’s playbook
The core of all this reduces to three moving parts. Rising oil creates conflicting cross-asset pressures rather than a clean signal. The CPI print is a critical near-term catalyst but not a deterministic one. And synchronized tightening constrains what any single central bank’s hawkishness can do for its own currency.
That gives you a test to run on the next convergent week, not just this one. Identify which forces align and which conflict, find the catalyst with the shortest resolution timeline, and ask whether the slower structural forces override the near-term signal.
Three variables remain genuinely open before the 16 September Fed meeting, and they are the ones worth watching:
- The August CPI reading relative to expectations, out Friday.
- Brent crude’s direction relative to the $100 threshold once the geopolitical events settle.
- The NY Fed long-term inflation expectations survey, and whether anchoring holds.
The Fed meeting is where this week’s data cascade resolves into an actual policy outcome. Until then, the forces stay in tension.
For readers wanting to build the foundational layer beneath this week’s rate-spread analysis, our full explainer on US Dollar dominance covers why the Dollar appears on one side of 89.2% of global FX trades, how Fed rate decisions transmit into currency strength through interest-rate differentials, and what the gap between reserve share and FX turnover share actually means for de-dollarisation risk.
This article is for informational purposes only and should not be considered financial advice. Investors should conduct their own research and consult with financial professionals before making investment decisions. Financial projections and forward-looking statements are speculative, subject to change based on market developments, and past performance does not guarantee future results.