
Two labour reports landed at the same moment on 4 September 2026, and they told opposite stories. The United States added 162,000 jobs. Canada lost 41,700.
That gap is not a rounding error or a marginal miss. It is two of the world’s most closely watched labour markets moving in opposite directions, by meaningful margins, in the same breath.
The currency market did what currency markets do with a contrast that stark. USD/CAD advanced roughly 80 pips to around 1.3850-1.3862 on the day, a sharp and concentrated move driven by a simultaneous double surprise.
What follows here is the fundamental logic behind that move, why the timing of the release made it sharper than it otherwise would have been, and what the technical picture and analyst consensus say about where the pair heads from the 1.3850 region. You leave with the reasoning and the levels.
The jobs data that moved the market: what each report actually showed
Start with the American figure, because it set the direction. Nonfarm payrolls (NFP), the monthly count of jobs added or lost across the US economy, rose 162,000 in August against a consensus forecast of just 56,000.
That was the largest monthly gain in five months. Then came the revisions, which reinforced the strength: July, initially reported as a loss of 23,000, was revised up to a gain of 21,000, and June was lifted to 31,000 from 20,000. Combined, the two prior months were 55,000 stronger than first published.
The NFP report internals, specifically wage growth, prior-month revisions, and the unemployment rate, carry as much market weight as the headline jobs figure; the August beat was amplified precisely because revisions to June and July added 55,000 jobs that markets had not priced.
“Total nonfarm payroll employment increased by 162,000 in August, and the unemployment rate was unchanged at 4.1 percent.” — U.S. Bureau of Labor Statistics
The unemployment rate held at 4.1%, and the labour force participation rate ticked up to 61.6% from 61.4%. Average hourly earnings rose 3.1% year-over-year, cooling slightly from 3.2% but still firm.
Now the counterpoint. Statistics Canada reported employment fell by 41,700 in August against an expectation of a 15,000 gain, sharply reversing July’s outsized 75,100-job increase.
The Statistics Canada Labour Force Survey confirmed the August employment decline of 41,700 alongside the wage deceleration to 2.0% year-over-year, giving the currency market two reinforcing bearish signals on the Canadian side of the ledger rather than one.
The Canadian unemployment rate held steady at 6.4%, and employment was still up 217,000 (+1.0%) over the year. But the wage signal ran the same way as the headline: average hourly wages grew just 2.0% year-over-year, down sharply from 2.8% in July. The Bank of Canada (BoC) had already held its policy rate at 2.25%.
| Metric | US August 2026 | Canada August 2026 |
|---|---|---|
| Net employment change | +162,000 | -41,700 |
| Consensus forecast | +56,000 | +15,000 |
| Prior month | +21,000 (July, revised) | +75,100 (July) |
| Unemployment rate | 4.1% | 6.4% |
| Avg hourly earnings (YoY) | 3.1% | 2.0% |
Here is what the combined picture tells you: the wage numbers compounded the divergence rather than softening it. US pay growth stayed firm while Canadian pay growth decelerated, so the split was not confined to headline jobs. It ran through the inflation layer too, which is precisely what the currency market prices.
When big ASX news breaks, our subscribers know first
Why the simultaneous release made the move sharper than the sum of its parts
An 80-pip move on jobs data is not random noise. It is the predictable output of a specific structural condition, and understanding that condition matters for how you size exposure around these events.
When both national employment reports land at the same instant, market makers and algorithmic traders cannot process them in sequence. They must reprice USD/CAD against a combined North American labour picture inside a compressed window, which concentrates order flow and forces the adjustment to happen fast.
That concentration is only half of it. The double surprise also repriced rate expectations on both sides simultaneously.
Stronger US payrolls reduced the case for Federal Reserve (Fed) cuts. Weaker Canadian jobs increased the case for BoC caution. Each report reinforced the divergence signal the other was sending, amplifying the move well beyond what either release alone would have produced. Investing.com linked the reaction directly to “contrasting jobs data and the resulting reassessment of monetary-policy outlooks,” while TD Securities pointed to the “downside surprise in Canadian jobs and stronger-than-expected US payrolls” prompting a repositioning toward the US dollar.
The mirror-image precedent
The clearest evidence that this is a mechanism, not a one-off, is what happened exactly one month earlier. On 7 August 2026, the dynamic ran in reverse: Canada posted a “monster” gain of 75,100 jobs while US payrolls unexpectedly fell by 23,000.
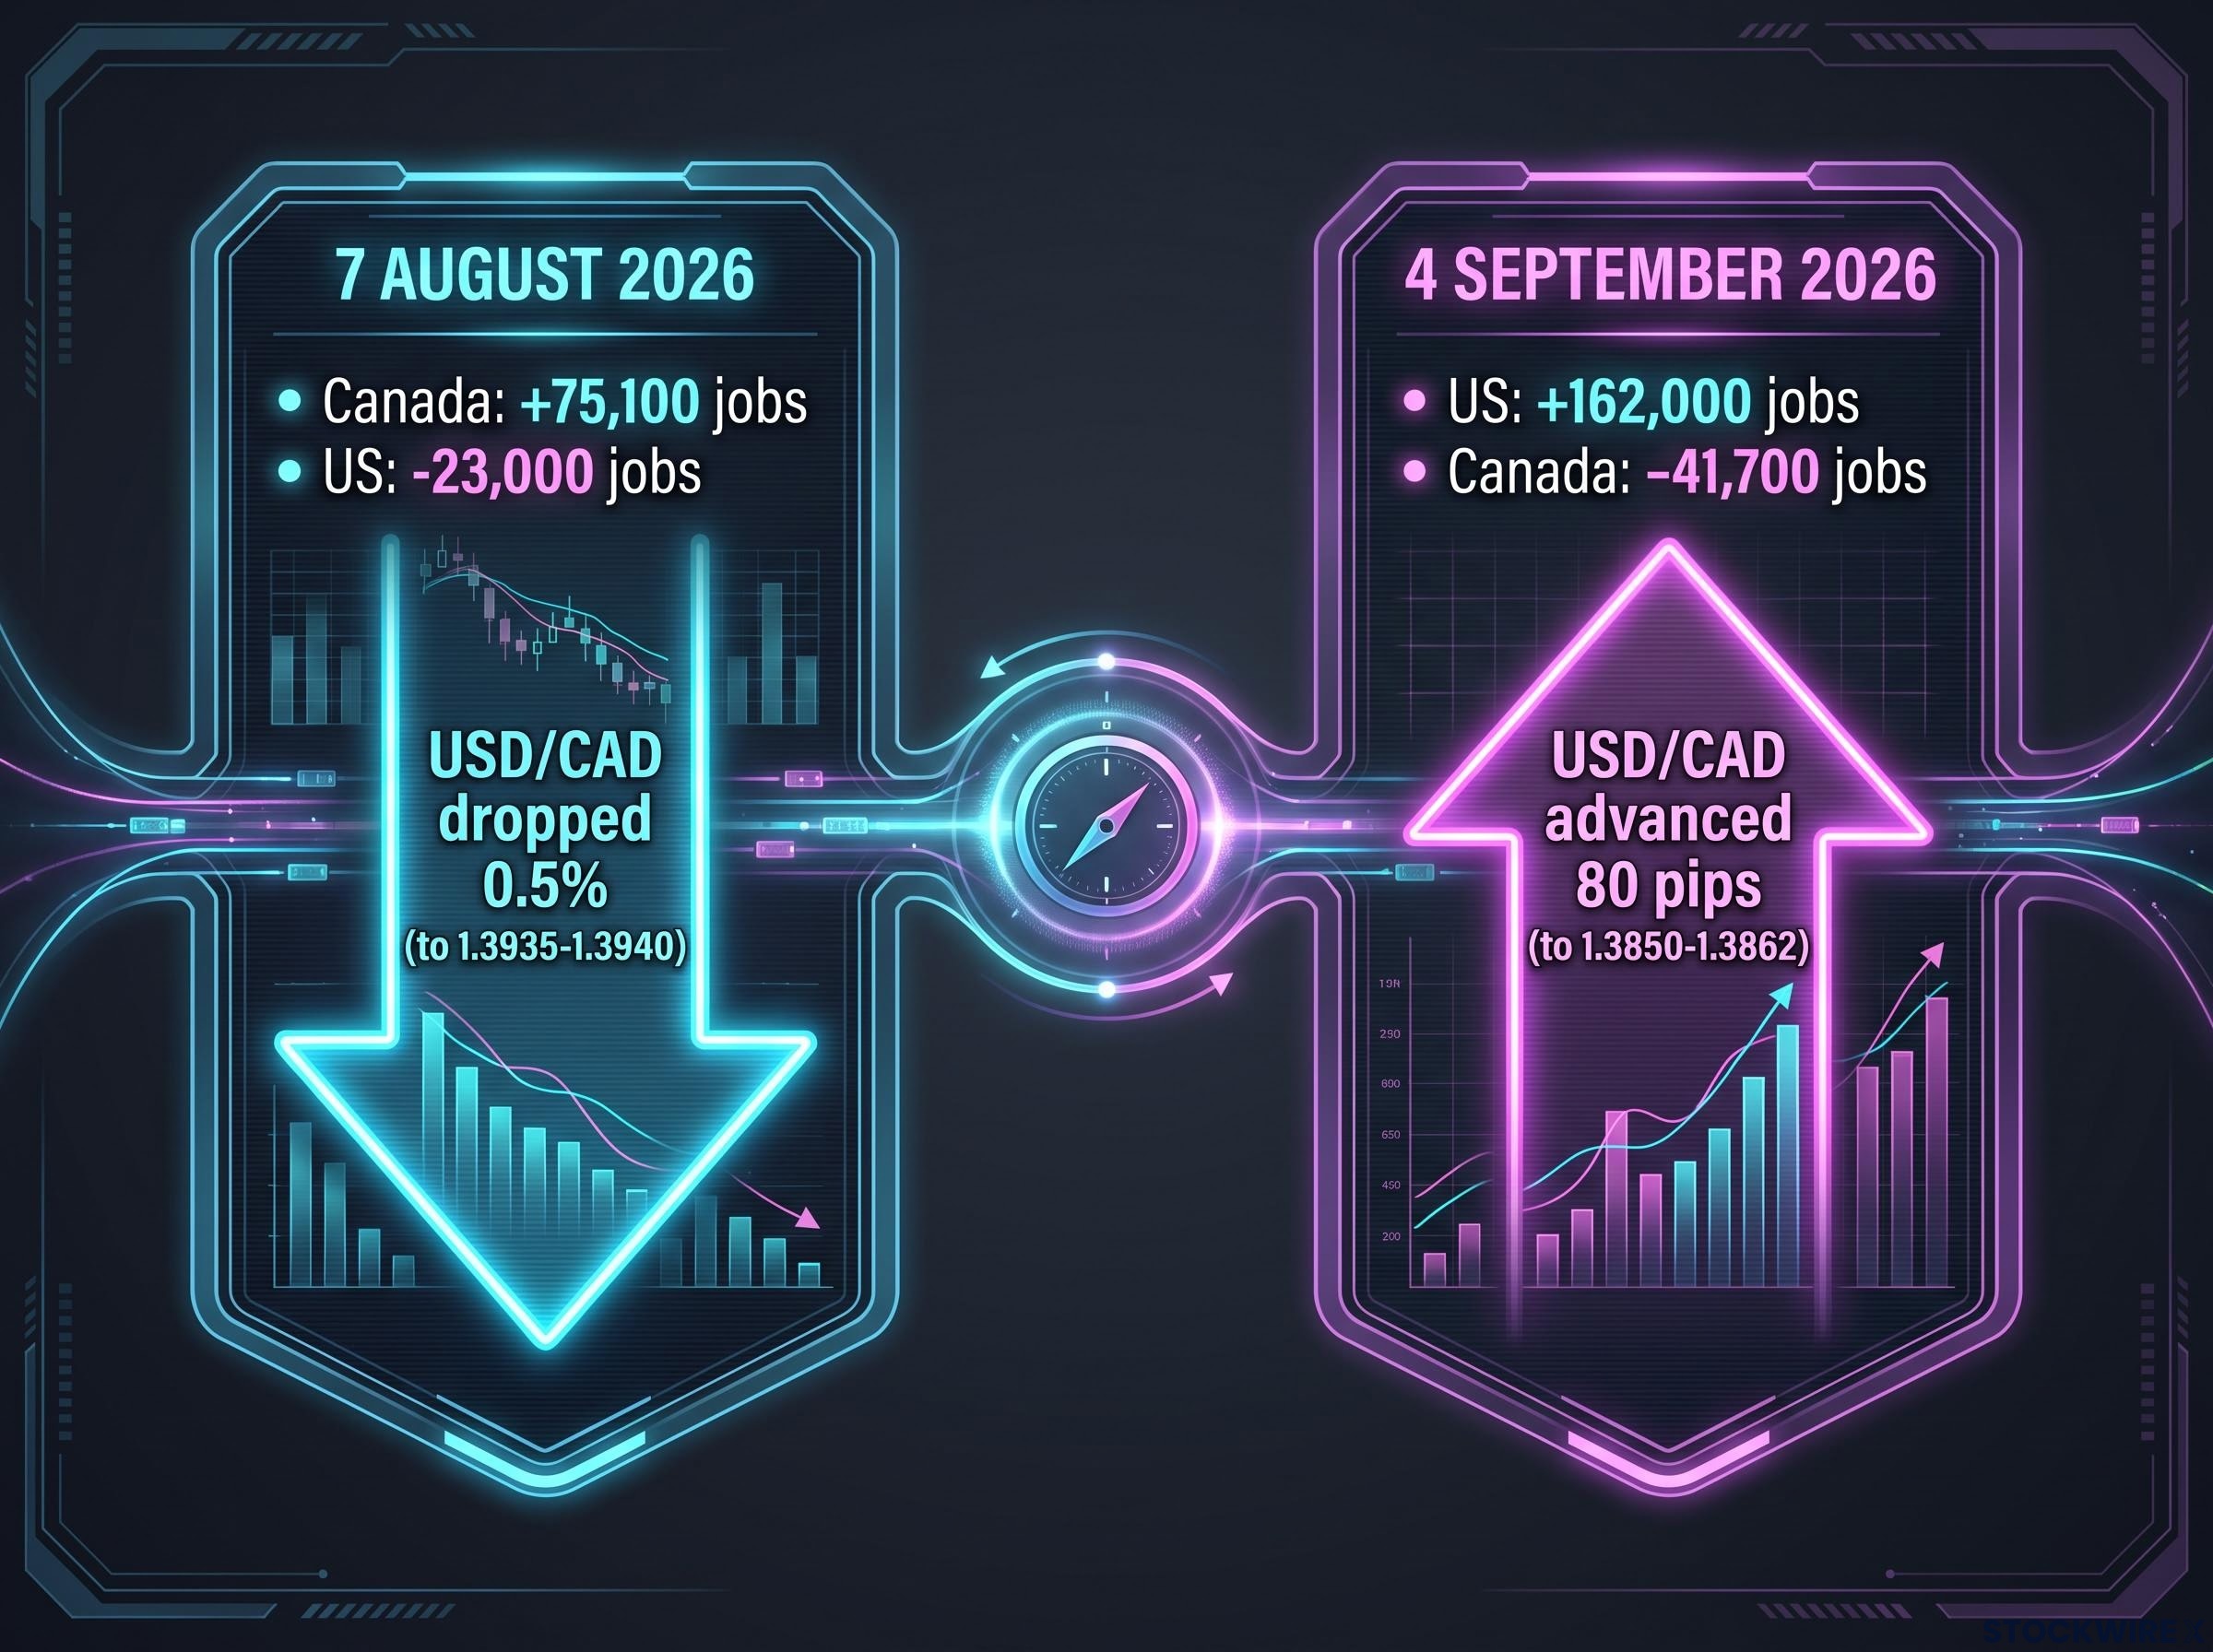
USD/CAD dropped roughly 0.5% to around 1.3935-1.3940, and the loonie reached an eight-week high. Same structural condition, opposite direction, comparably sharp reaction. The amplification effect is symmetric.
Tariff-driven CAD repricing has already demonstrated the same two-sided volatility pattern seen in the jobs reaction: the 50% tariff announcement in August 2026 produced the largest single-session CAD drop of any major currency, before a three-day negotiation pause triggered an equally sharp recovery that mirrors the jobs-data dynamic.
Whether any given simultaneous release produces a large or a contained move depends on three things:
- The magnitude of the beat-versus-miss differential, since bigger surprises force bigger repricing
- Whether the surprises align with the prevailing central-bank narratives, which either reinforces or blunts the signal
- Whether positioning is already stretched, which limits how far the crowd can chase the move
For you, this means the 80-pip rally carried information about how markets price the Fed-versus-BoC divergence, not just about one month’s employment figures. The same structural setup could produce an equally sharp reversal if the next round of data tilts the other way, so a single print should not be mistaken for a regime change.
What the charts show: technical levels to watch as USD/CAD consolidates near 1.3850
If the fundamentals explain why the pair moved, the charts show where it can go from here. As of the analysis, USD/CAD sat at roughly 1.3852 on the one-hour chart, pinned between two key moving averages.
The 100-period simple moving average (SMA), which tracks the average price over the last 100 periods, sits at 1.3852 and acts as an immediate pivot. The 200-period SMA sits just above at 1.3860. The 14-period Relative Strength Index (RSI), a momentum gauge that runs from 0 to 100 where readings above 70 signal overbought conditions, was around 67: elevated, but not yet extended.
That combination is the read that matters. Momentum is real, but the pair is not stretched, which means the next directional catalyst (inflation data or central-bank communication) will likely decide whether the resistance above 1.3860 breaks or holds.
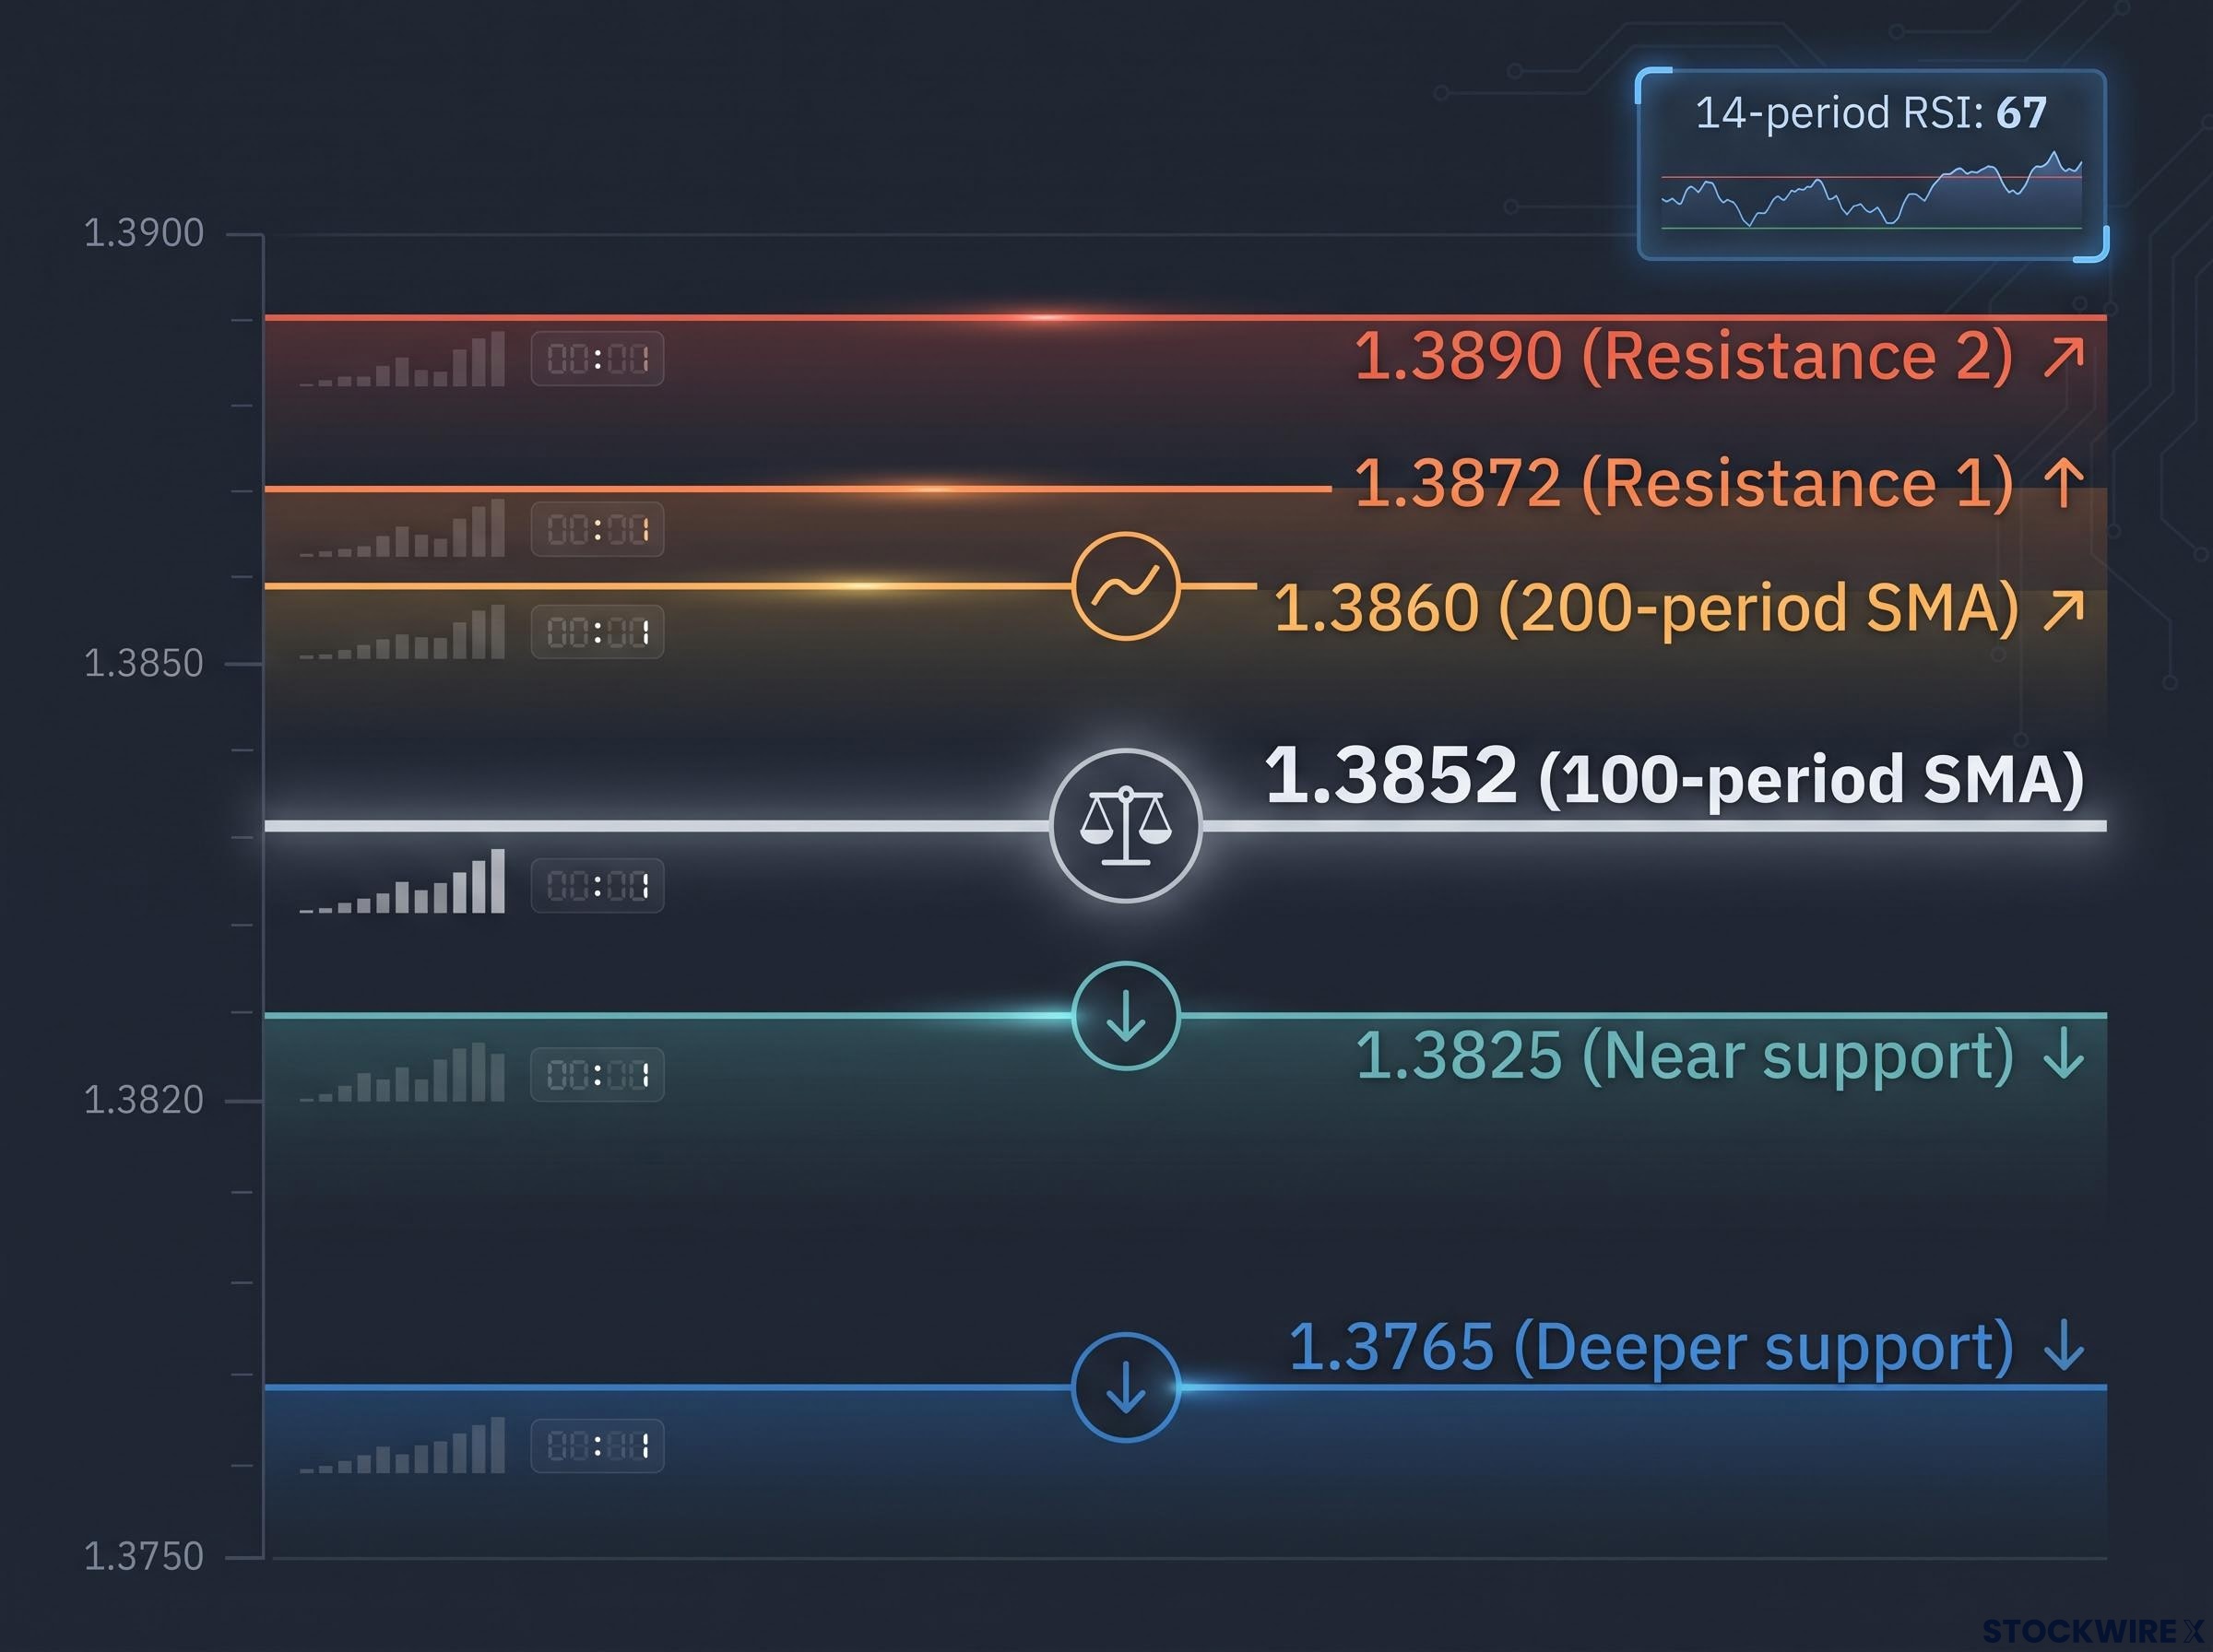
| Level | Price | Significance |
|---|---|---|
| 100-period SMA | 1.3852 | Immediate pivot |
| 200-period SMA | 1.3860 | First overhead barrier |
| Resistance 1 | 1.3872 | Horizontal resistance |
| Resistance 2 | 1.3890 | Upper resistance |
| Near support | 1.3825 | First downside floor |
| Deeper support | 1.3765 | Corrective target |
Resistance levels above the current price
The overhead stack is clearly defined:
- 1.3860, the 200-period SMA. A sustained close above it would confirm buyers have absorbed the first layer of selling.
- 1.3872, the first horizontal resistance. Clearing it would open the path toward the upper band.
- 1.3890, the upper resistance. A close above here would signal the rally has real follow-through rather than a one-day spike.
Each level cleared and held raises the odds that the jobs divergence is translating into a genuine trend rather than a single repricing.
Support levels and the bearish scenario
On the downside, the picture is just as specific:
- 1.3825, the near-term floor. This is the level that defines the bearish case.
- 1.3765, the deeper support and corrective target.
A break below 1.3825 would remove the first cushion and expose the pair to a deeper move toward 1.3765. For context, the Canadian dollar strengthened to a three-month high of 1.376 per US dollar on 21 August, per Trading Economics, so the high-1.37s have recently acted as a meaningful reference. Having these levels in hand lets you define risk around a position rather than reacting to price with no anchor.
The policy divergence picture: what the Fed-BoC gap means for USD/CAD from here
Before accepting that the rally has room to run, it is worth stress-testing the case against a sustained move higher. The baseline consensus is straightforward: TD Securities sees USD/CAD “anchored around 1.39 near term,” with the BoC in a comfortable holding pattern at 2.25% and a more hawkish tone driven by elevated energy prices. The Fed’s September decision remains contested, with market odds roughly a coin toss on a hold given the strong payrolls.
“We continue to see USD/CAD anchored around 1.39 near term.” — TD Securities
Now the counterarguments. Three substantive factors limit how far this rally can extend:
- Data noise. Monthly jobs figures are volatile. Halifax CityNews reported that economists “weren’t ringing any alarm bells” over the 42,000-job loss, describing it as a break in a “hot streak” rather than a crisis.
- Oil price support. The BoC’s hawkish energy language cuts both ways. Firm oil prices support Canadian growth and the loonie, working against a prolonged USD/CAD uptrend.
- The need for inflation corroboration. After the 7 August episode, TD Securities warned that a currency move on jobs alone would not sustain unless US CPI confirmed it. That caution applies symmetrically now.
Canadian core inflation complicates the divergence picture: CPI-trim and CPI-median were both tracking below the 2% target heading into August, meaning wage deceleration to 2.0% year-over-year was not an isolated signal but part of a broader softening in price pressure that the headline CPI number obscures.
Structural context reinforces the caution. RBC economist Claire Fan attributed part of the August weakness to demographics and softer immigration rather than a deteriorating economy, while pointing to improving hours worked and a stable unemployment rate. She expects solid domestic demand to support the labour market into 2027.
The historical comparison sharpens the point. A 2025 episode of a 66,000-job loss with unemployment rising to 7.1% prompted explicit calls from economists for BoC rate cuts. The August 2026 commentary is markedly more moderate, which tells you analysts view this print as a pause, not a pivot.
So what does the consensus actually tell you? The jobs divergence re-set the pair’s level, but is unlikely on its own to drive a sustained trend higher. The next meaningful move in either direction needs corroboration from inflation data and formal central-bank guidance, which makes the 1.39 region a reference point to watch rather than an inevitable destination.
What changes the trajectory, and what the 1.39 level actually tells you
Pull the threads together and the picture is coherent. The pair has repriced the jobs divergence to roughly 1.3850-1.3862, momentum is real but capped by the RSI and the moving-average cluster overhead, and the 1.39 region represents the market’s current best estimate of near-term fair value given the Fed-BoC gap.
Read 1.39 as an anchor, not a target. Sustained moves above it require a macro shift beyond one jobs report, and sustained moves below it require either a Canadian data rebound or a clear softening in US growth signals. The 0.5% drop on 7 August is the reminder that a reversal catalyst can arrive just as sharply as this rally did.
Here are the four events that would move the pair decisively in the weeks ahead:
- US CPI. A hot print reopens the Fed hike debate and supports the US dollar; a cooler print undercuts the payrolls strength and favours the loonie.
- Fed September communication. Confirmation of a hold caps USD/CAD; language reopening the hike case pushes it toward and above 1.39.
- Canadian September Labour Force Survey. A rebound argues for a retracement toward 1.38; a second weak print reinforces the divergence and the upside case.
- BoC October guidance. A hawkish energy-driven tone supports the loonie; any softening toward easing weakens it.
If subsequent data broadly matches current expectations, the most likely outcome is consolidation within the 1.3825 to 1.3890 band rather than a decisive trend. Watching those four catalysts gives you a framework to monitor the pair with discipline instead of reacting to daily noise.
For investors wanting to understand why some large Canada-specific macro events produce minimal FX movement while others reprice the pair sharply, our full explainer on how markets price CAD trade shocks examines the Scotiabank framework for distinguishing already-priced trade escalation from genuinely new information.
This article is for informational purposes only and should not be considered financial advice. Investors should conduct their own research and consult with financial professionals before making investment decisions. Past performance does not guarantee future results, and these forward-looking scenarios are speculative and subject to change based on market developments.