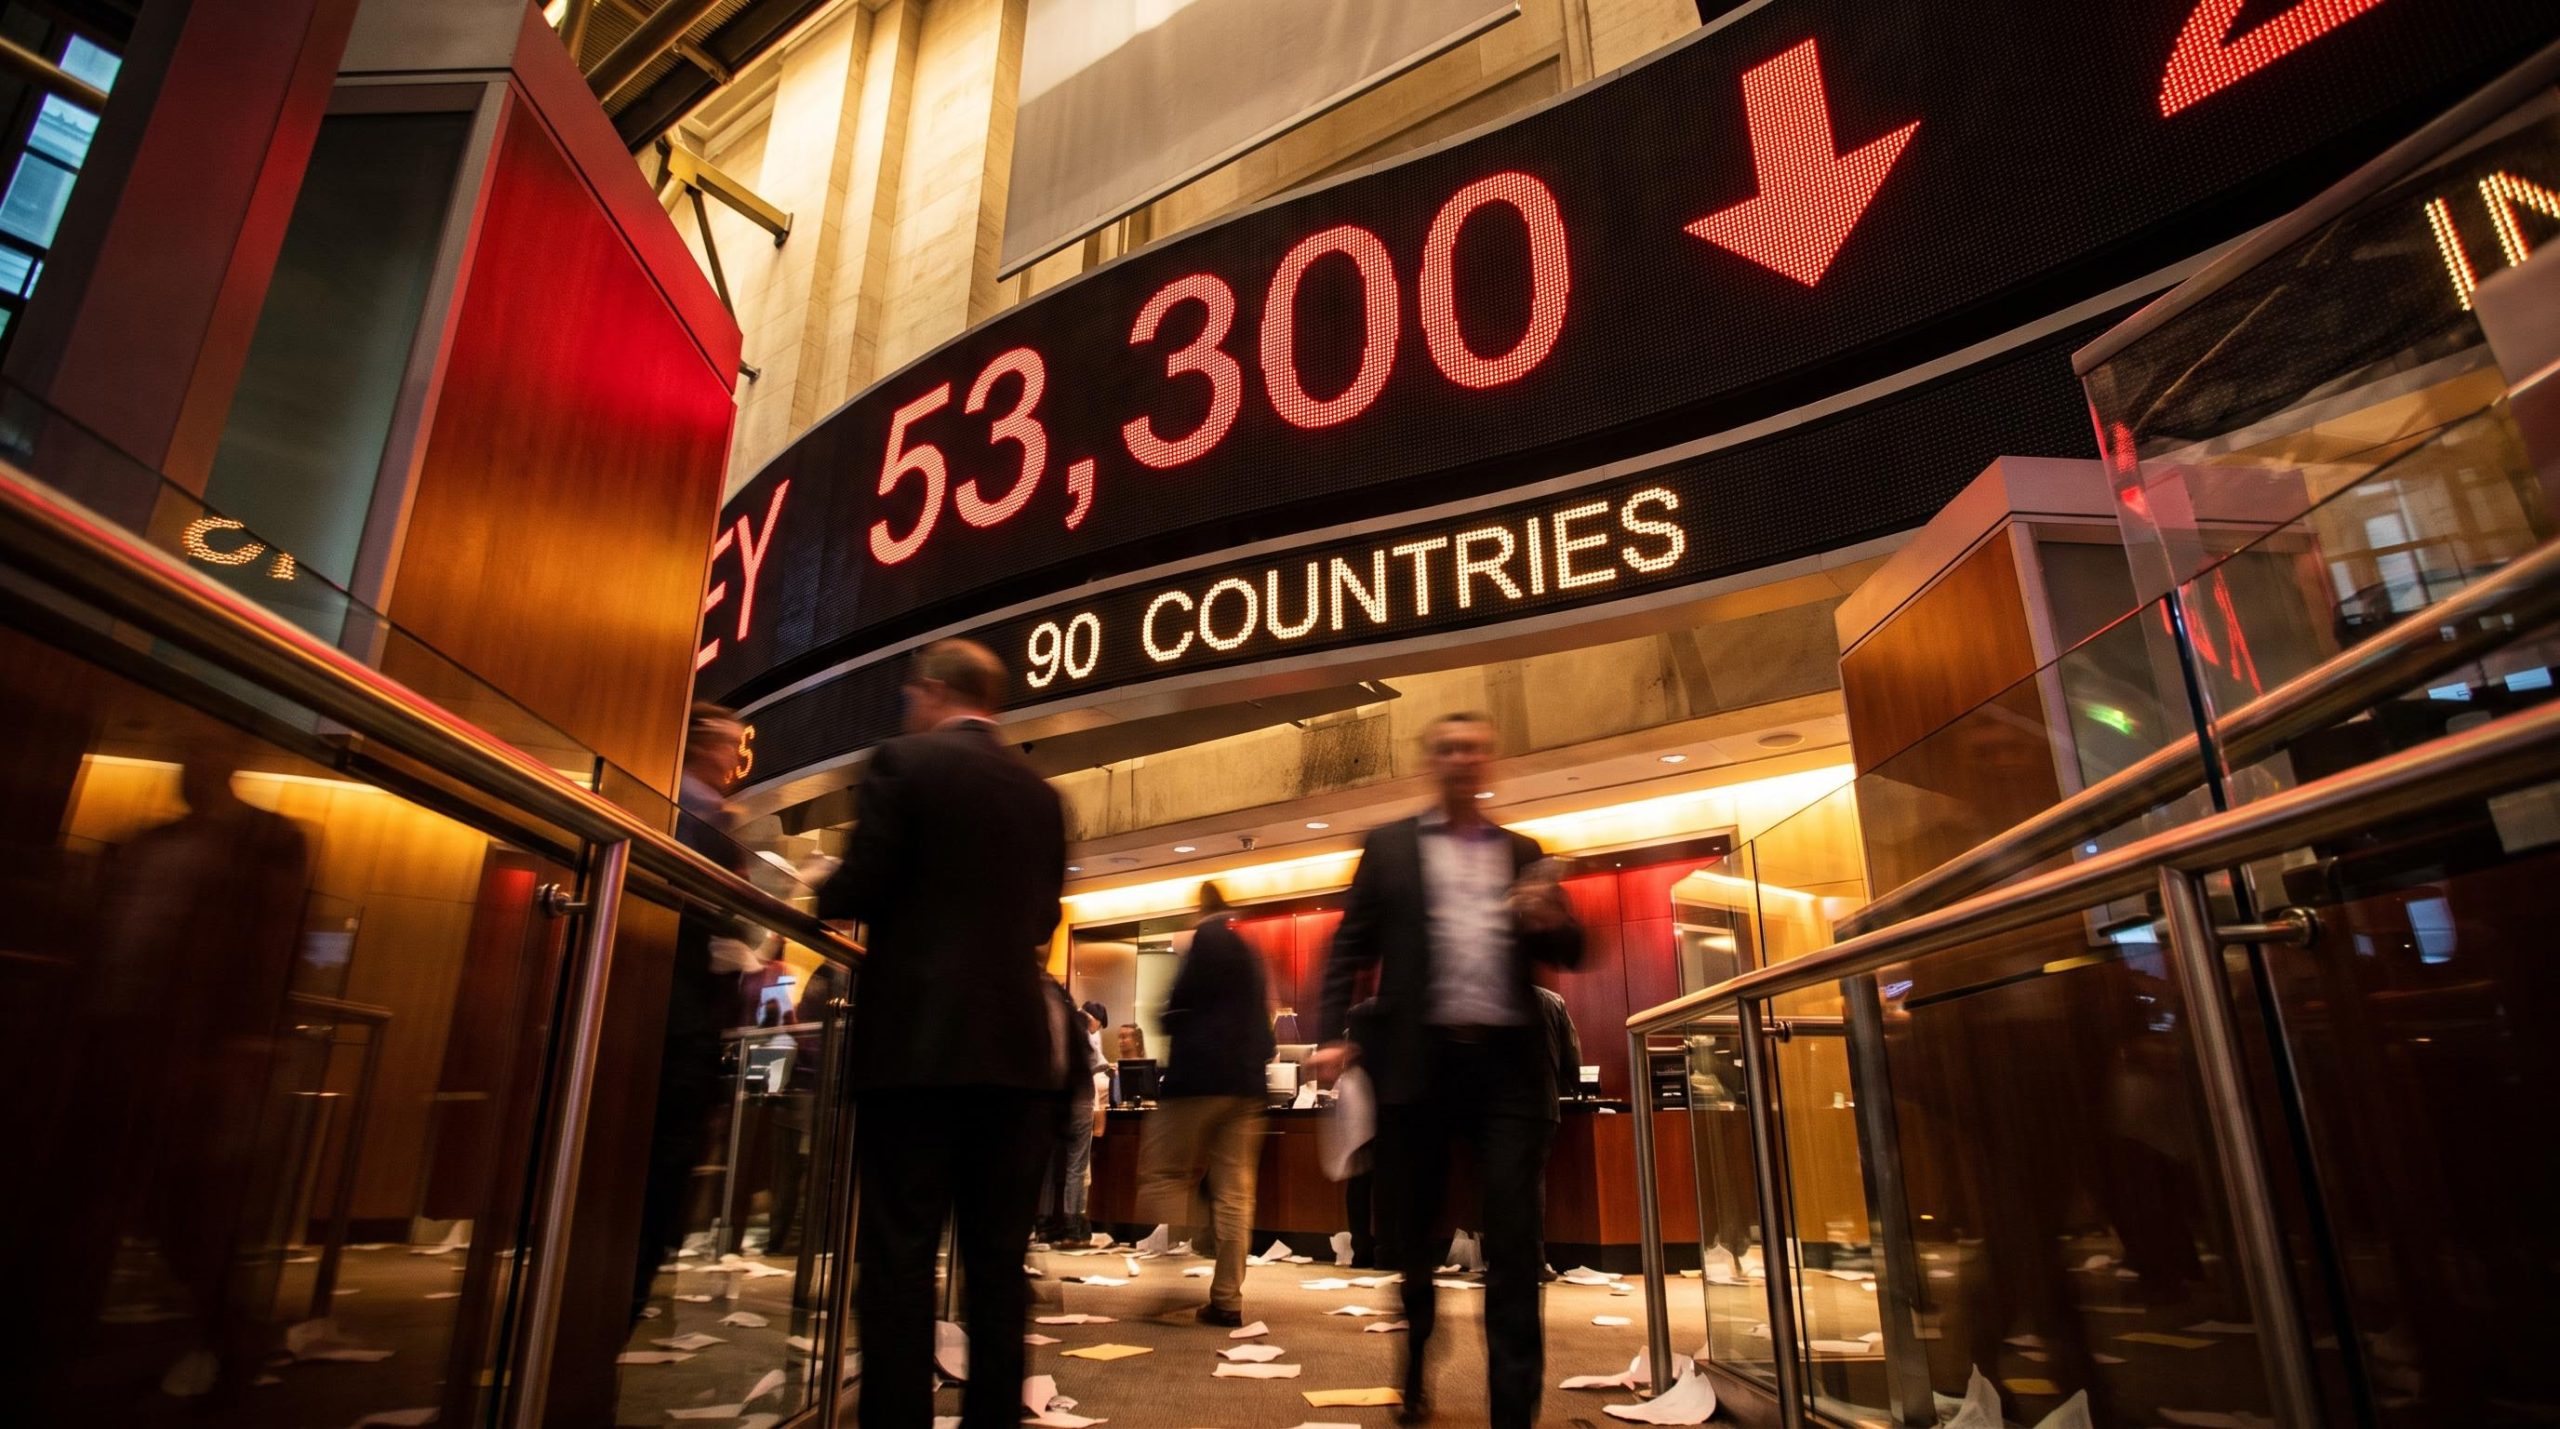
One post, one hour, two hundred points. A presidential social media message published at 13:56 GMT on Friday sent the Dow Jones Industrial Average from near 53,500 to a session low just below 53,300 in roughly an hour, and the number moving markets was not the point drop. It was the threat behind it: import restrictions against more than 90 countries representing roughly $1.2 trillion in annual US trade deficits.
What made this particular warning land differently from prior tariff rhetoric was the legal ground beneath it. In February 2026, the Supreme Court in Learning Resources, Inc. v. Trump struck down the president’s broadest emergency tariff authority, forcing the administration to pivot to alternative statutory tools. The threat therefore arrived in an environment where markets had already priced out some trade-war tail risk, which made the re-escalation signal more disruptive, not less.
This is a Trump trade war story where Dow stocks and inflation sit at the center of the analysis. Here is what the threat actually means at the company level for five major Dow names, what it means for consumer prices, and what it means for the Federal Reserve’s rate path. By the time you finish, you will have a framework for telling noise from signal in presidential trade threats.
What the legal landscape actually allows after the Supreme Court ruling
Start with the constraint, not the threat. The post exists inside a legal box that did not exist eighteen months ago.
On 20 February 2026, the Supreme Court ruled that the International Emergency Economic Powers Act (IEEPA), a law that lets a president regulate imports during a national emergency, does not authorise sweeping open-ended tariffs. That power, the Court held, remains with Congress. The administration’s single largest tariff lever was removed overnight.
What remains is real, and it was deployed within hours. President Trump terminated the IEEPA duties and immediately invoked Section 122 of the Trade Act of 1974, a provision allowing temporary tariffs to address serious balance-of-payments deficits. The initial rate was 10% ad valorem, escalated the following day to the statutory ceiling of 15%, with a hard stop at 150 days unless Congress votes to extend it.
Section 122 is not the only tool left on the menu. A Stanford Law School working paper dated 10 August 2026 catalogued six alternative authorities the administration could draw on.
| Statute | Authority granted | Status | Key constraint |
|---|---|---|---|
| Section 122, Trade Act 1974 | Balance-of-payments tariffs up to 15% | Enacted (Feb 2026) | 150-day cap unless Congress extends |
| Section 232, Trade Expansion Act | National security tariffs | Under consideration | Requires national-security rationale |
| Section 301, Trade Act 1974 | Unfair trade practice tariffs | Under consideration | Requires unfair-trade findings |
| Section 201, Trade Act 1974 | Safeguard import relief | Under consideration | Requires injury findings |
| Section 338, Tariff Act 1930 | Discrimination-based tariffs up to 50% | Under consideration | Rarely used; untested for broad measures |
Legal scholars split on whether these tools can replicate IEEPA’s reach. Brookings and the Thomson Reuters Institute flag procedural requirements and judicial-review risk. The Council on Foreign Relations and the Peterson Institute for International Economics (PIIE) point to the speed of the Section 122 pivot as evidence of genuine follow-through.
The Section 122 surcharge itself faces active litigation: the Court of International Trade rejected it in a 2-1 ruling in May 2026, and tariff legal fragility across Section 301 and Section 338 means the current regime runs on court calendars as much as statutory authority.
European Parliamentary Research Service Section 122 and Section 338 are characterised as “untested” for broad, across-the-board measures, implying that aggressive deployment may invite litigation and congressional pushback.
The constraint cuts both ways, and that is the point for anyone holding globally exposed Dow names. A blanket embargo is harder to execute than it would have been under IEEPA, but Section 122 is live today at its maximum rate. You cannot dismiss this risk as purely performative.
When big ASX news breaks, our subscribers know first
How five Dow names are exposed and what the 2018-2019 cycle tells you
The last trade-war cycle does the analytical work here. Tariffs on Chinese goods in 2018-2019 pressured technology hardware and consumer goods companies, while steel and aluminium duties hit manufacturing-heavy names. According to the Thomson Reuters Institute and Congressional Research Service, equities in those categories saw significant volatility before tariffs were even fully implemented.
Map that template onto the current set. Five DJIA constituents carry distinct operational vulnerabilities.
- Apple assembles products in China, India, and Vietnam.
- Nike manufactures most of its footwear in Vietnam and Indonesia.
- Walmart is the country’s largest containerised importer.
- Boeing derives significant revenue from overseas markets an embargo would seal off.
- Caterpillar sells into those same overseas markets.
The critical distinction is between two kinds of exposure. Apple, Nike, and Walmart face cost inflation, because import restrictions raise the price of goods they source abroad. Boeing and Caterpillar face demand destruction, because retaliation from trading partners would close the export markets their revenue depends on.
The PwC tariff impact analysis of US companies across industrial products, consumer goods, and aerospace found that cashflow compression and supply-chain restructuring costs tend to arrive well before any domestic capacity comes online to offset blocked imports, reinforcing why cost-side exposure for Apple, Nike, and Walmart cannot be treated as a short-cycle adjustment.
| Company | Primary exposure | Exposure type | 2018-2019 precedent |
|---|---|---|---|
| Apple | Assembly in China, India, Vietnam | Cost-side | China tariffs pressured tech hardware |
| Nike | Footwear in Vietnam, Indonesia | Cost-side | China tariffs pressured consumer goods |
| Walmart | Largest US containerised importer | Cost-side | Import-intensive retail margin pressure |
| Boeing | Overseas market revenue | Demand-side | Manufacturing volatility from retaliation |
| Caterpillar | Overseas market revenue | Demand-side | Steel/aluminium cycle manufacturing hit |
The scale behind the threat is worth holding in view. The US trade deficit with the more-than-90 affected countries totalled roughly $1.2 trillion in the prior year, with China alone accounting for over $200 billion.
Here is what the last cycle actually tells you. Price pressure on these names typically begins before a tariff is formally implemented, because supply-chain repricing and margin-guidance downgrades arrive first. That reframes Friday’s move from near 53,500 to below 53,300: it is not overreaction, it is early-cycle positioning. Knowing whether cost inflation or demand destruction applies to a given name gives you a basis for evaluating earnings risk differently across the five, rather than treating the Dow as a single unit of trade-war exposure.
Why an import embargo raises prices instead of cutting them
The stated objective is lower prices and lower rates. The mechanism runs in exactly the opposite direction, and once you follow it, the contradiction becomes hard to ignore.
A broad import restriction functions as a negative supply shock. It layers a fiscal charge on top of low-cost imports and shields domestic producers from foreign competition, which tends to raise prices across both import and domestic categories at once.
According to the Peterson Institute, Section 122 tariffs act as a tax on imports that directly raises the price of traded goods. Tariffs do not erase the cost advantage of foreign production; they simply add a charge on top of it, so the price faced by US buyers rises. Domestic producers, no longer undercut by cheaper imports, frequently raise their own prices too.
Brookings Sweeping tariffs are best understood as a negative supply shock rather than a demand-driven inflationary impulse, raising costs for US businesses reliant on global supply chains and compressing margins or forcing higher consumer prices.
The European Parliamentary Research Service makes a related point: trade restrictions reduce effective supply and lift prices even when domestic demand is unchanged. This is cost-push inflation, meaning prices rising because production costs go up, as distinct from demand-pull inflation, where prices rise because buyers are chasing goods. The Federal Reserve’s toolkit is poorly suited to the former, because raising rates does little to fix a supply constraint.
The 2025-2026 US-Canada tariff cycle provided the most recent empirical test of these cost-push inflation dynamics, with the St. Louis Fed attributing approximately 0.5 percentage points of annualised PCE to tariffs and lumber duties adding roughly $10,900 to the cost of a new home.
Why domestic substitution cannot quickly offset import price rises
The obvious counterargument is that domestic production simply replaces the blocked imports. In deeply embedded import sectors, that substitution is slow and capacity-constrained.
Consumer electronics, apparel, and machinery cannot be re-shored in a quarter. Redirecting supply chains takes years, not months, and domestic capacity is limited in the interim, which is what makes tariffs a cost-push event rather than a path to cheaper goods.
The most recent real-world example is the 2021-2022 supply-chain episode, when import disruption drove cost-push inflation and the Fed responded by tightening. That is the same dynamic in play here, which means the inflation risk is not theoretical. The trade threat is designed to produce rate cuts, yet the mechanism it relies on historically produced the opposite response from the central bank.
What the Fed funds futures market is pricing and what it means for the rate path
Two inflationary inputs landed on the same day, and the futures market read them as compounding rather than duplicating. The August payroll data delivered a demand-side signal. The trade threat added a supply-side one on top.
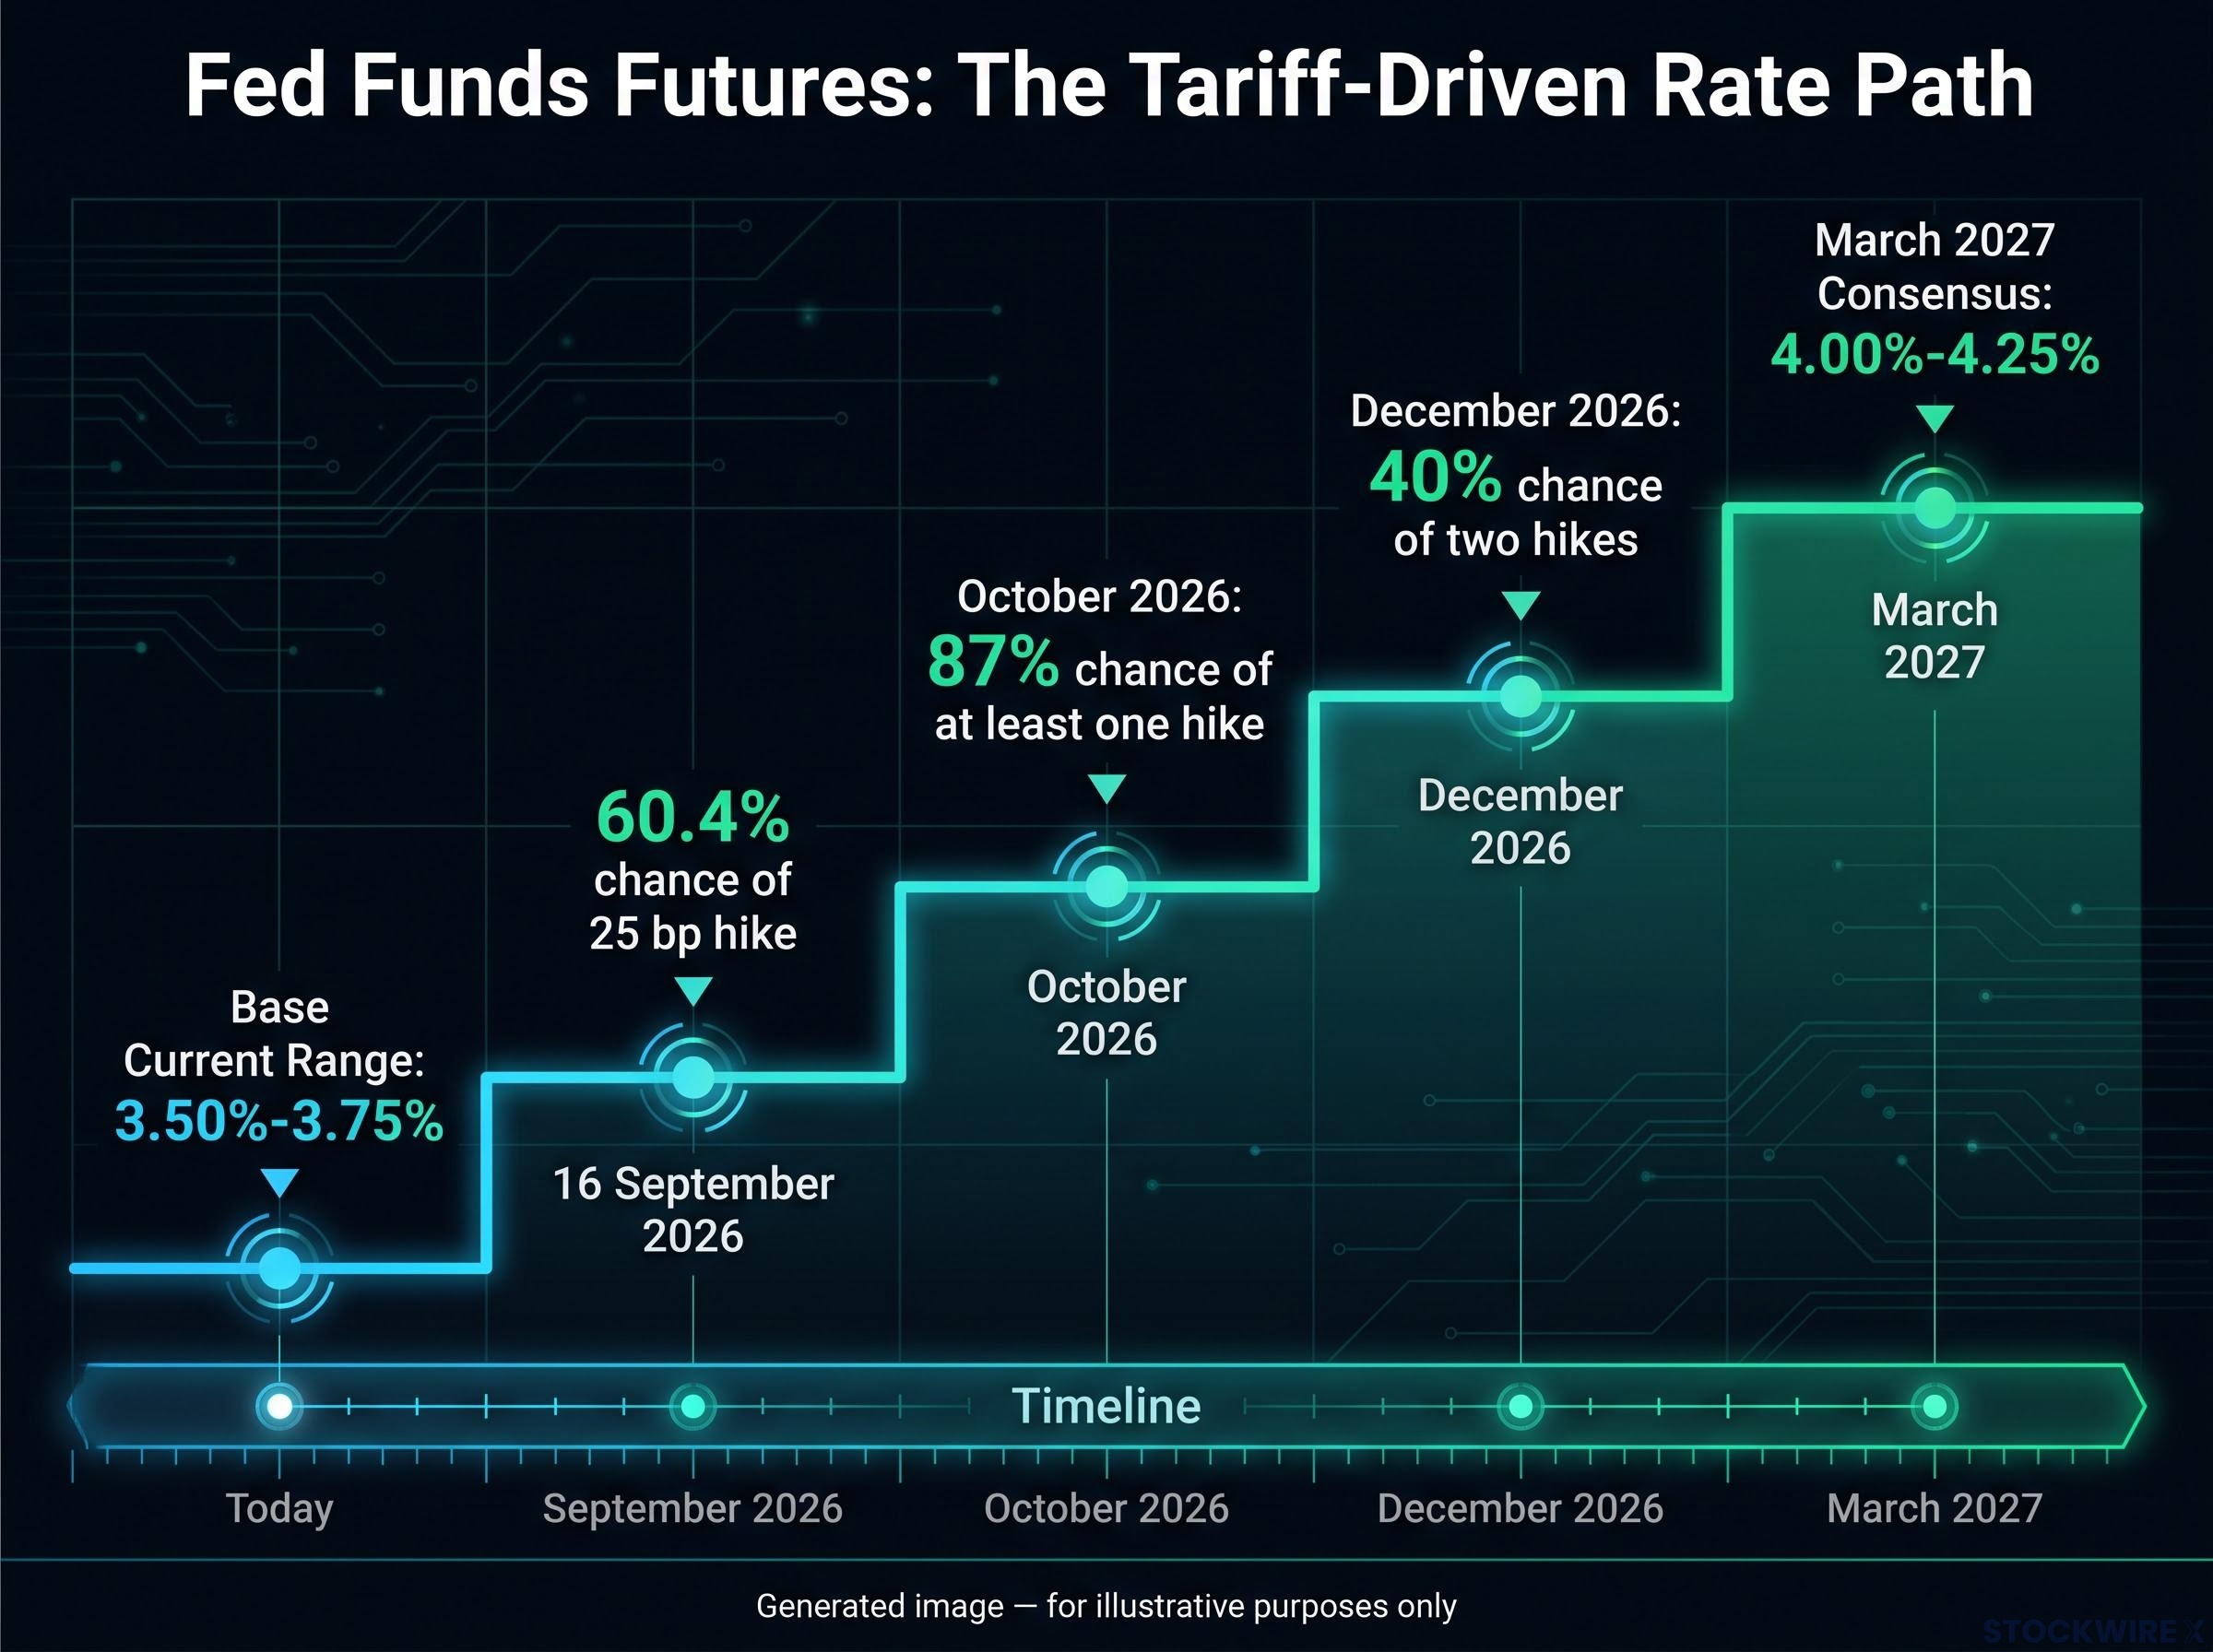
Before the August non-farm payroll release, the 16 September decision was close to a coin flip. After it, Fed funds futures moved decisively.
| Meeting / window | Hike probability | Hold / no-change | Cumulative odds | Implied range |
|---|---|---|---|---|
| 16 September 2026 | 60.4% (25 bp) | 39.6% | – | Above 3.50%-3.75% |
| October 2026 | 87% (at least one) | – | – | – |
| December 2026 | – | 0% unchanged | 40% for two hikes | Above current range |
| March 2027 | – | – | Full distribution | 4.00%-4.25% |
The bond market moved in step. The two-year US Treasury yield climbed to above 4.40%, its highest since January 2025. Short-duration Treasuries are the instrument most sensitive to near-term rate expectations, so that move reflects a market belief that the Fed will act sooner rather than later.
The dilemma this creates is specific to supply-side inflation. Demand-driven inflation lets the Fed tighten cleanly, because cooling demand cools prices. Tariff-driven inflation forces a choice between controlling prices and protecting output, because tightening does nothing to restore blocked supply.
Federal Reserve Chair, Jackson Hole Additional policy tightening remained “on the table” if inflation persisted, leaving little basis for a hold given strong hiring.
For you, holding equities or weighing credit risk, the March 2027 consensus of 4.00%-4.25% is the number that matters. It prices the rate environment as materially tighter than the current 3.50%-3.75% range, and any further tariff escalation pushes that path higher rather than resolving it. The futures market translates presidential social media posts into basis points, and right now it is assigning low probability to the scenario where trade threats produce easier money.
The March 2027 consensus at 4.00%-4.25% carries added uncertainty under the Warsh regime, where Fed forward guidance has been explicitly scrapped, meaning each payroll release and tariff development now lands on rate expectations with no central-bank-provided buffer between headline and market reaction.
Signal or noise? How to read further tariff escalation from here
This is a decision framework, not a verdict. The evidence supports two competing interpretations, and the honest position is to hold both until the data breaks one way.
The credible-signal case rests on speed and commitment. The administration pivoted to Section 122 within hours of the IEEPA ruling and deployed it at the statutory maximum of 15%. The Council on Foreign Relations reads this as aggressive use of a rarely invoked statute, and PIIE treats the rapid pivot as evidence of genuine policy follow-through rather than rhetoric.
The negotiating-leverage case rests on friction. Brookings emphasises that a blanket embargo against 90-plus countries would run into the major-questions and separation-of-powers doctrines the Supreme Court leaned on. The Thomson Reuters Institute reads the menu of alternative authorities as an effort to preserve bargaining power. The Stanford Law working paper concludes that while the six statutes could sustain a complex regime, each carries procedural findings that constrain blanket application.
Three variables that would shift this from threat to policy
You cannot resolve the signal-versus-noise question from a social media post. You can resolve it from what happens next.
- Formal statutory findings. If the administration files the balance-of-payments, national-security, or unfair-trade findings each statute requires, implementation is imminent rather than rhetorical.
- Preparatory retaliation. If major trading partners begin readying countermeasures, the other side is treating the threat as real.
- Fed communications. If official guidance shifts to explicitly flag tariff-driven inflation as a policy input, the rate consequences are moving from projection to plan.
The value here is a way to update your view as information arrives, rather than reacting to each headline in isolation. Formal filings and counterparty responses would tip the balance toward signal quickly.
More than a year of announce-delay-revise cycles has widened the gap between headline tariff rates and what actually gets implemented, which is one reason the pattern-break signals, formal statutory filings, counterparty retaliation, and explicit Fed acknowledgement, carry more analytical weight than the post itself.
The policy contradiction at the center of this trade threat
The three threads converge on a single finding. The legal architecture limits but does not eliminate the threat, the Dow constituents are exposed in differentiated ways the 2018-2019 cycle maps directly onto, and the inflation mechanism runs against the stated objective.
That is the contradiction, and it is structural rather than accidental. A tool built to force lower rates and lower prices is configured, through the Brookings negative-supply-shock mechanism, to produce higher ones. Markets are already pricing a tighter path through March 2027 at 4.00%-4.25%, and further tariff escalation adds to that path rather than reducing it, which makes the trade-war lever self-defeating as a rate-reduction strategy regardless of its legal viability.
The DJIA’s slide from near 53,500 to below 53,300 was the market translating that contradiction into price within an hour. The signals worth watching are not the posts.
- Statutory filings that show implementation is imminent
- Counterparty retaliation that shows the threat is being taken seriously
- Fed communications that fold tariff inflation into the rate outlook
Judge any future escalation against the same supply-side inflation and rate-path logic, and you have a durable frame rather than a single-event reaction.
This article is for informational purposes only and should not be considered financial advice. Investors should conduct their own research and consult with financial professionals before making investment decisions. Past performance does not guarantee future results. Financial projections are subject to market conditions and various risk factors, and forward-looking statements are speculative and subject to change based on market developments.