Most investors treat semiconductor funds as interchangeable. Buy any popular chip ETF, the thinking goes, and you own the sector. That assumption has quietly become dangerous.
The artificial intelligence boom has warped the internal machinery of the most popular vehicles. As of early September 2026, these funds have posted extraordinary returns, but that headline performance hides radical differences in how each one is built. Weighting methodology, geographic exposure, and single-stock concentration vary enormously from one ticker to the next.
Two funds with near-identical names can behave like completely different investments. One might place a leveraged bet on a single company. Another might spread your money thinly across dozens of mid-cap manufacturers you have never heard of.
This is where a proper semiconductor ETF comparison earns its keep. What follows gives you a clear framework for matching the exact fund structure to your risk tolerance, your geographic preference, and your specific view on where the chip cycle goes next.
Decoding the chip ecosystem and how index funds package it
Here is the first thing to understand: “semiconductors” is not one sector. It is a fragmented supply chain of businesses that do wildly different things, earn wildly different margins, and behave very differently when markets turn.
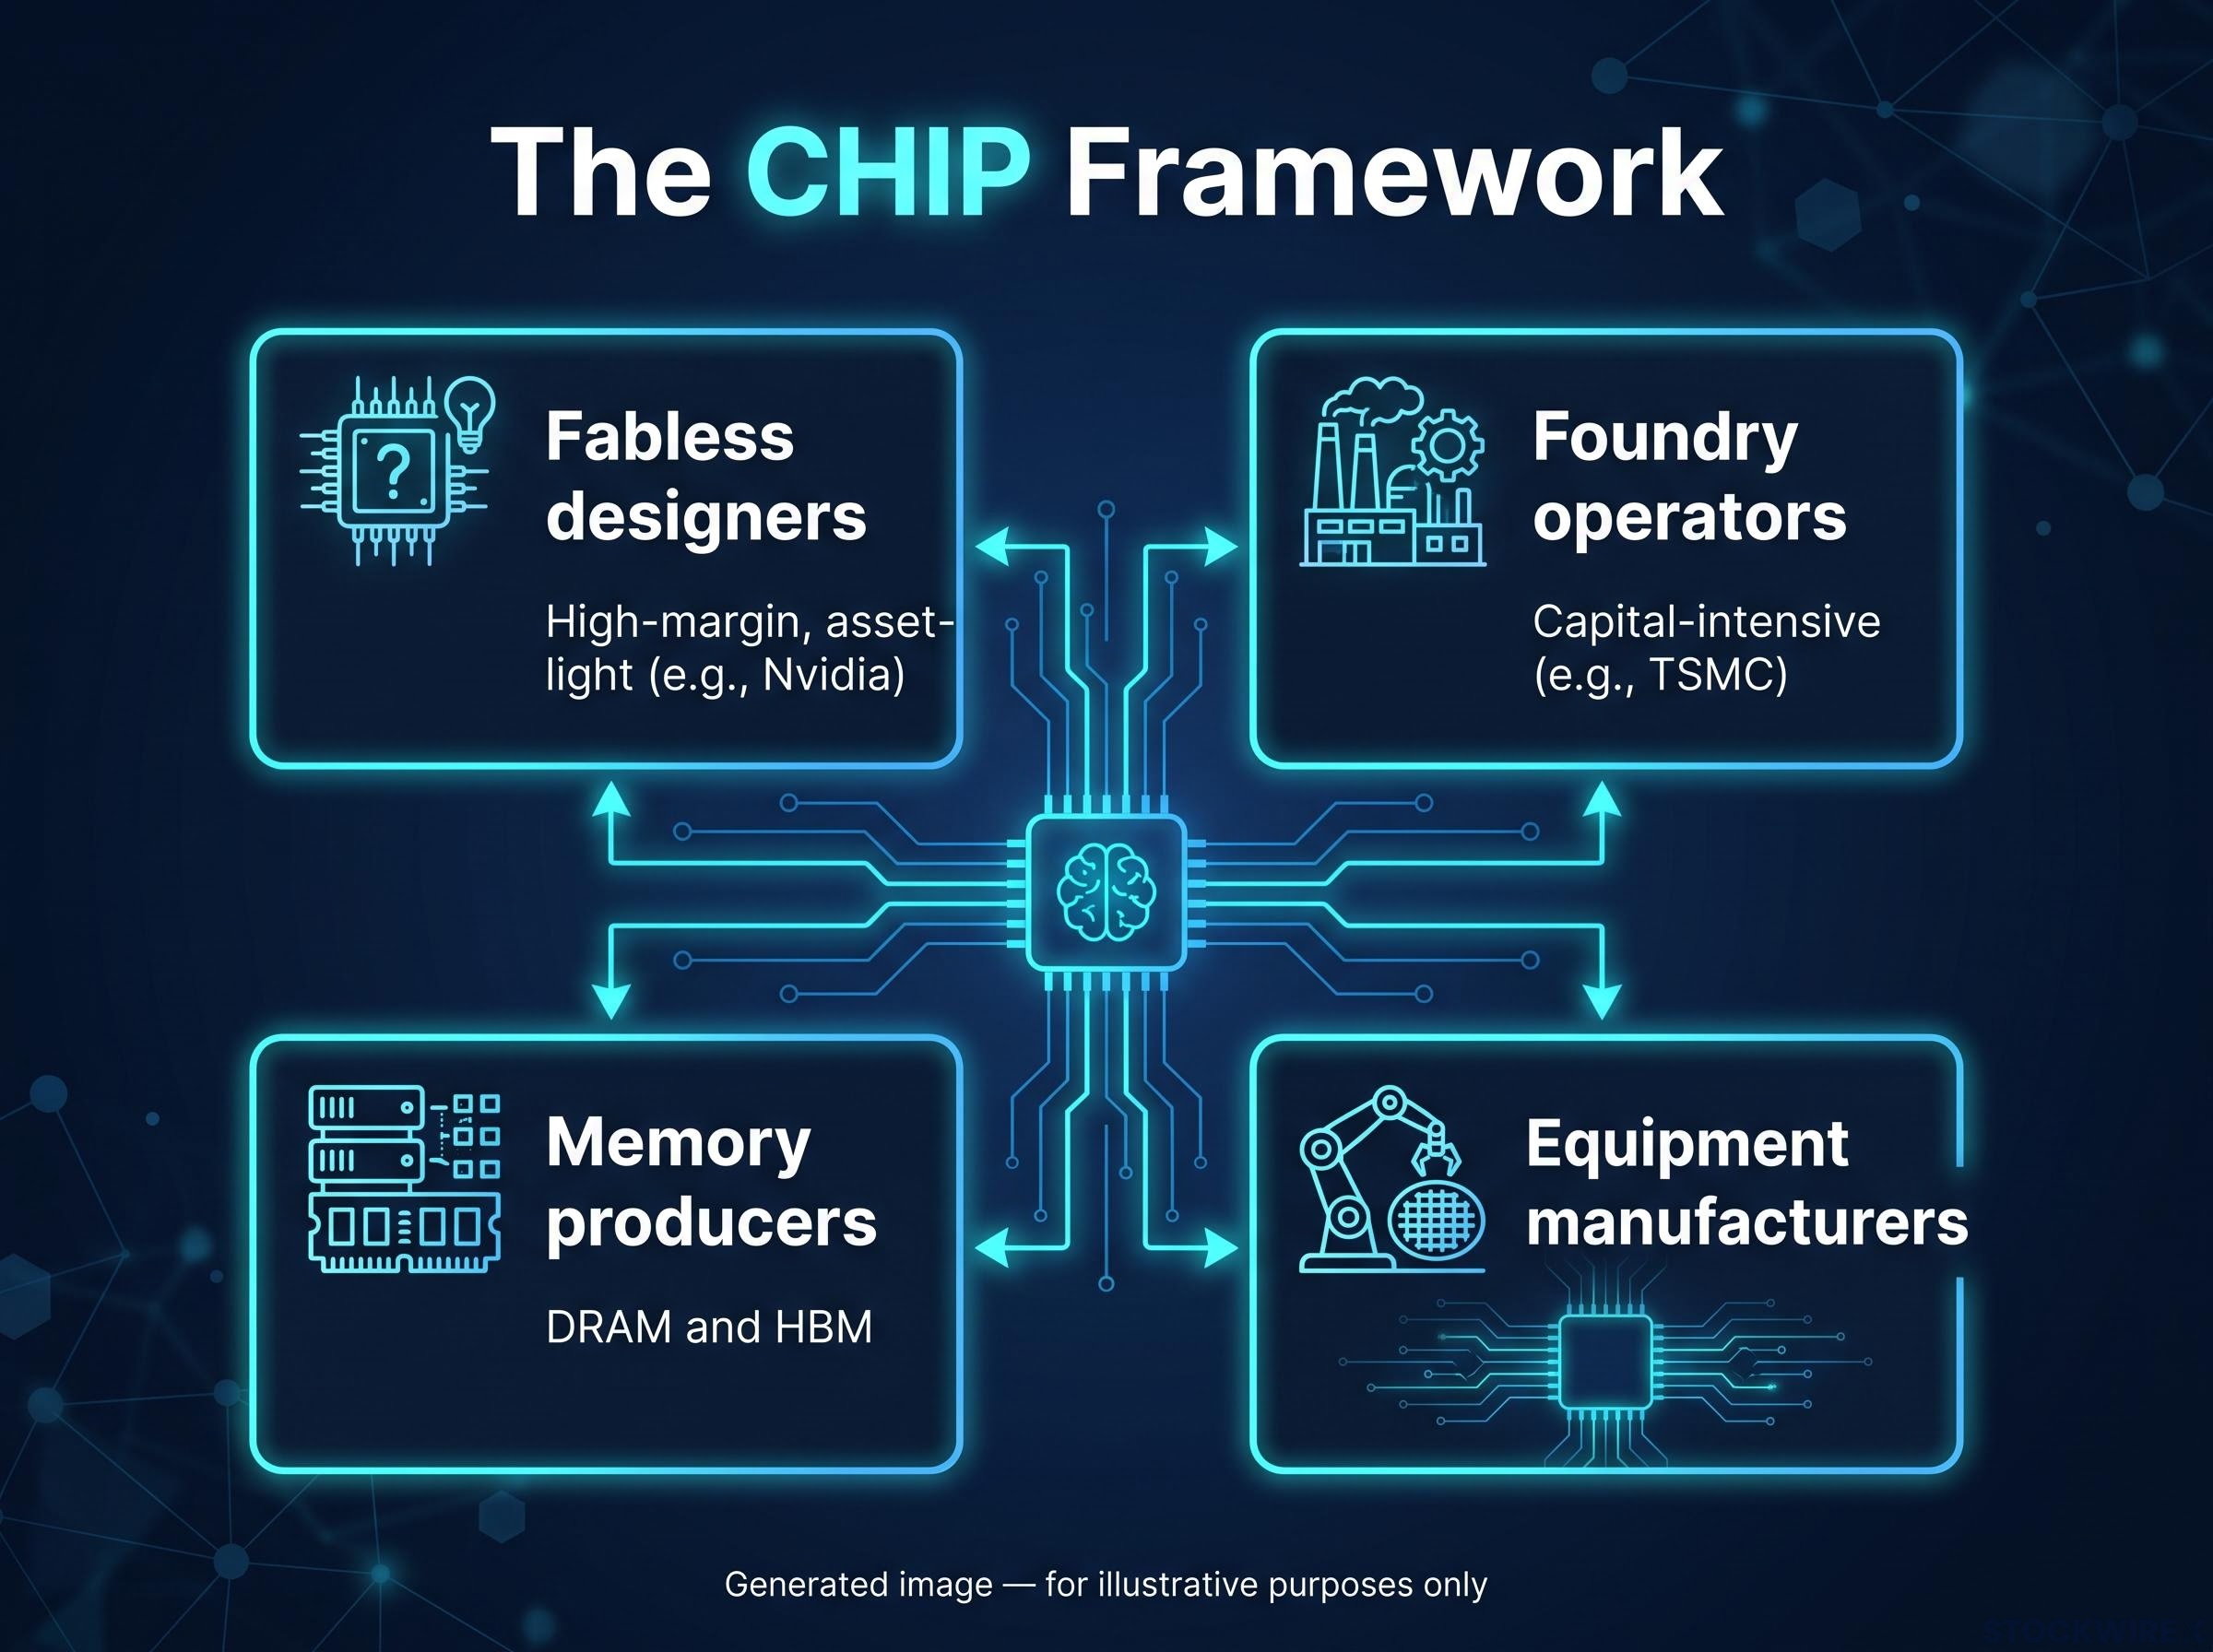
A useful way to map it is the CHIP framework, which breaks the ecosystem into four distinct pillars:
- Fabless designers: Companies that design chips but outsource the actual manufacturing. Nvidia is the obvious example. These are high-margin, asset-light businesses.
- Foundry operators: The companies that physically manufacture chips for others. Taiwan Semiconductor Manufacturing Co. (TSMC) is the giant here. These are capital-intensive, spending billions on fabrication plants.
- Memory producers: Firms specialising in DRAM and high-bandwidth memory (HBM), the storage components that feed AI processors.
- Equipment manufacturers: The businesses that build the machines used to make chips in the first place.
These segments do not move as one. A fabless designer like Nvidia can earn extraordinary margins because it carries no factory risk. A foundry like TSMC sinks enormous capital into plants, which means it behaves differently during a downturn, when heavy fixed costs bite harder than an asset-light design portfolio ever would.
That distinction matters directly to your returns. Holding a fund packed with capital-intensive equipment makers is a fundamentally different bet than holding one stacked with pure-play AI designers, especially when the cycle rolls over.
Index providers know this, and they exploit it. Different funds deliberately overweight specific parts of the chain while quietly ignoring others. Some tilt hard toward the design leaders. Others deliberately spread weight across manufacturing and equipment to blunt concentration.
The cost of that complexity shows up in fees. Expense ratios across these funds range from 0.19% at the cheap end to 0.68% for the more specialised regional vehicles, and the price you pay usually reflects how targeted the exposure is.
The practical takeaway is simple. You need to know exactly which part of the supply chain your chosen fund holds, because that decision quietly determines how your money behaves when the sector stops going up in a straight line.
When big ASX news breaks, our subscribers know first
Navigating U.S. mega-cap concentration and weighting risks
The largest U.S. semiconductor funds have delivered spectacular numbers. They have also become, mechanically, a bet on a very small number of companies.
Start with the VanEck Semiconductor ETF (SMH), the sector heavyweight. As of early September 2026 it held roughly $67 billion in assets and charges 0.35%. It uses straightforward market-cap weighting, which means the biggest companies simply get the biggest slots. The result is stark: Nvidia sits at around 22.8% of the fund and TSMC near 9.5%. Buy SMH and nearly a third of your money rides on two names.
The iShares Semiconductor ETF (SOXX) takes a gentler approach. With approximately $41.4 billion in assets, it applies individual stock weighting caps, holding its top names in the 8-9.5% range each. That capping spreads the risk more evenly across large U.S. chip leaders like Micron, AMD, Nvidia and Broadcom, without abandoning the sector’s giants entirely.
For cost-conscious investors, the Invesco PHLX Semiconductor ETF (SOXQ) is the standout. At 0.19%, it carries the lowest expense ratio of the group while offering broad benchmark exposure, all for around $3.0 billion in assets.
| Ticker | Weighting Strategy | AUM | Expense Ratio | Top Holding Weight |
|---|---|---|---|---|
| SMH | Market-cap weighted | ~$67B | 0.35% | Nvidia ~22.8% |
| SOXX | Modified cap, capped weights | ~$41.4B | ~0.35% | Capped 8-9.5% |
| SOXQ | Broad benchmark | ~$3.0B | 0.19% | Broad, lower concentration |
The performance gap explains why concentration is so tempting. SMH posted a one-year total return near 92% as of late August 2026, while SOXX delivered a year-to-date return around 66.7% into early September. When a handful of mega-caps lead a rally, cap-weighting captures it more aggressively.
There is a geopolitical dimension too. Heavy reliance on TSMC ties these funds to a single manufacturing chokepoint in Taiwan, an exposure analysts at Seeking Alpha and elsewhere have repeatedly flagged as an existential risk should cross-strait tensions escalate.
So here is the honest read. When you buy a mega-cap fund like SMH, you accept maximum upside tied directly to Nvidia and TSMC, along with the violent portfolio swings that follow when either name hits a headwind. The returns are the reward; the concentration is the price.
The performance drag and diversification of equal-weight alternatives
If mega-cap concentration makes you uneasy, equal-weight funds offer the obvious antidote. Just be clear-eyed about the mathematical trade you are making.
The SPDR S&P Semiconductor ETF (XSD) spreads weight evenly across large, mid and small-cap chipmakers, deliberately stripping out market-cap bias. It holds roughly 41-49 securities, and crucially, Nvidia sits at only about 3% of the fund, compared to more than 20% in SMH. You get genuine exposure to mid-cap manufacturers and equipment suppliers that the mega-cap funds barely touch.
The catch is structural and unavoidable. Every time an equal-weight fund rebalances, it mechanically trims its winners and tops up its laggards to restore even weighting. In a market where a few leaders dominate, that means systematically selling the exact stocks driving the returns.
Equal-weighting is fundamentally a bet on mean reversion, the idea that laggards eventually catch up to leaders. The recent AI hardware cycle has been the opposite: a winner-take-most environment where the giants pulled further ahead. Fighting that trend has a real cost.
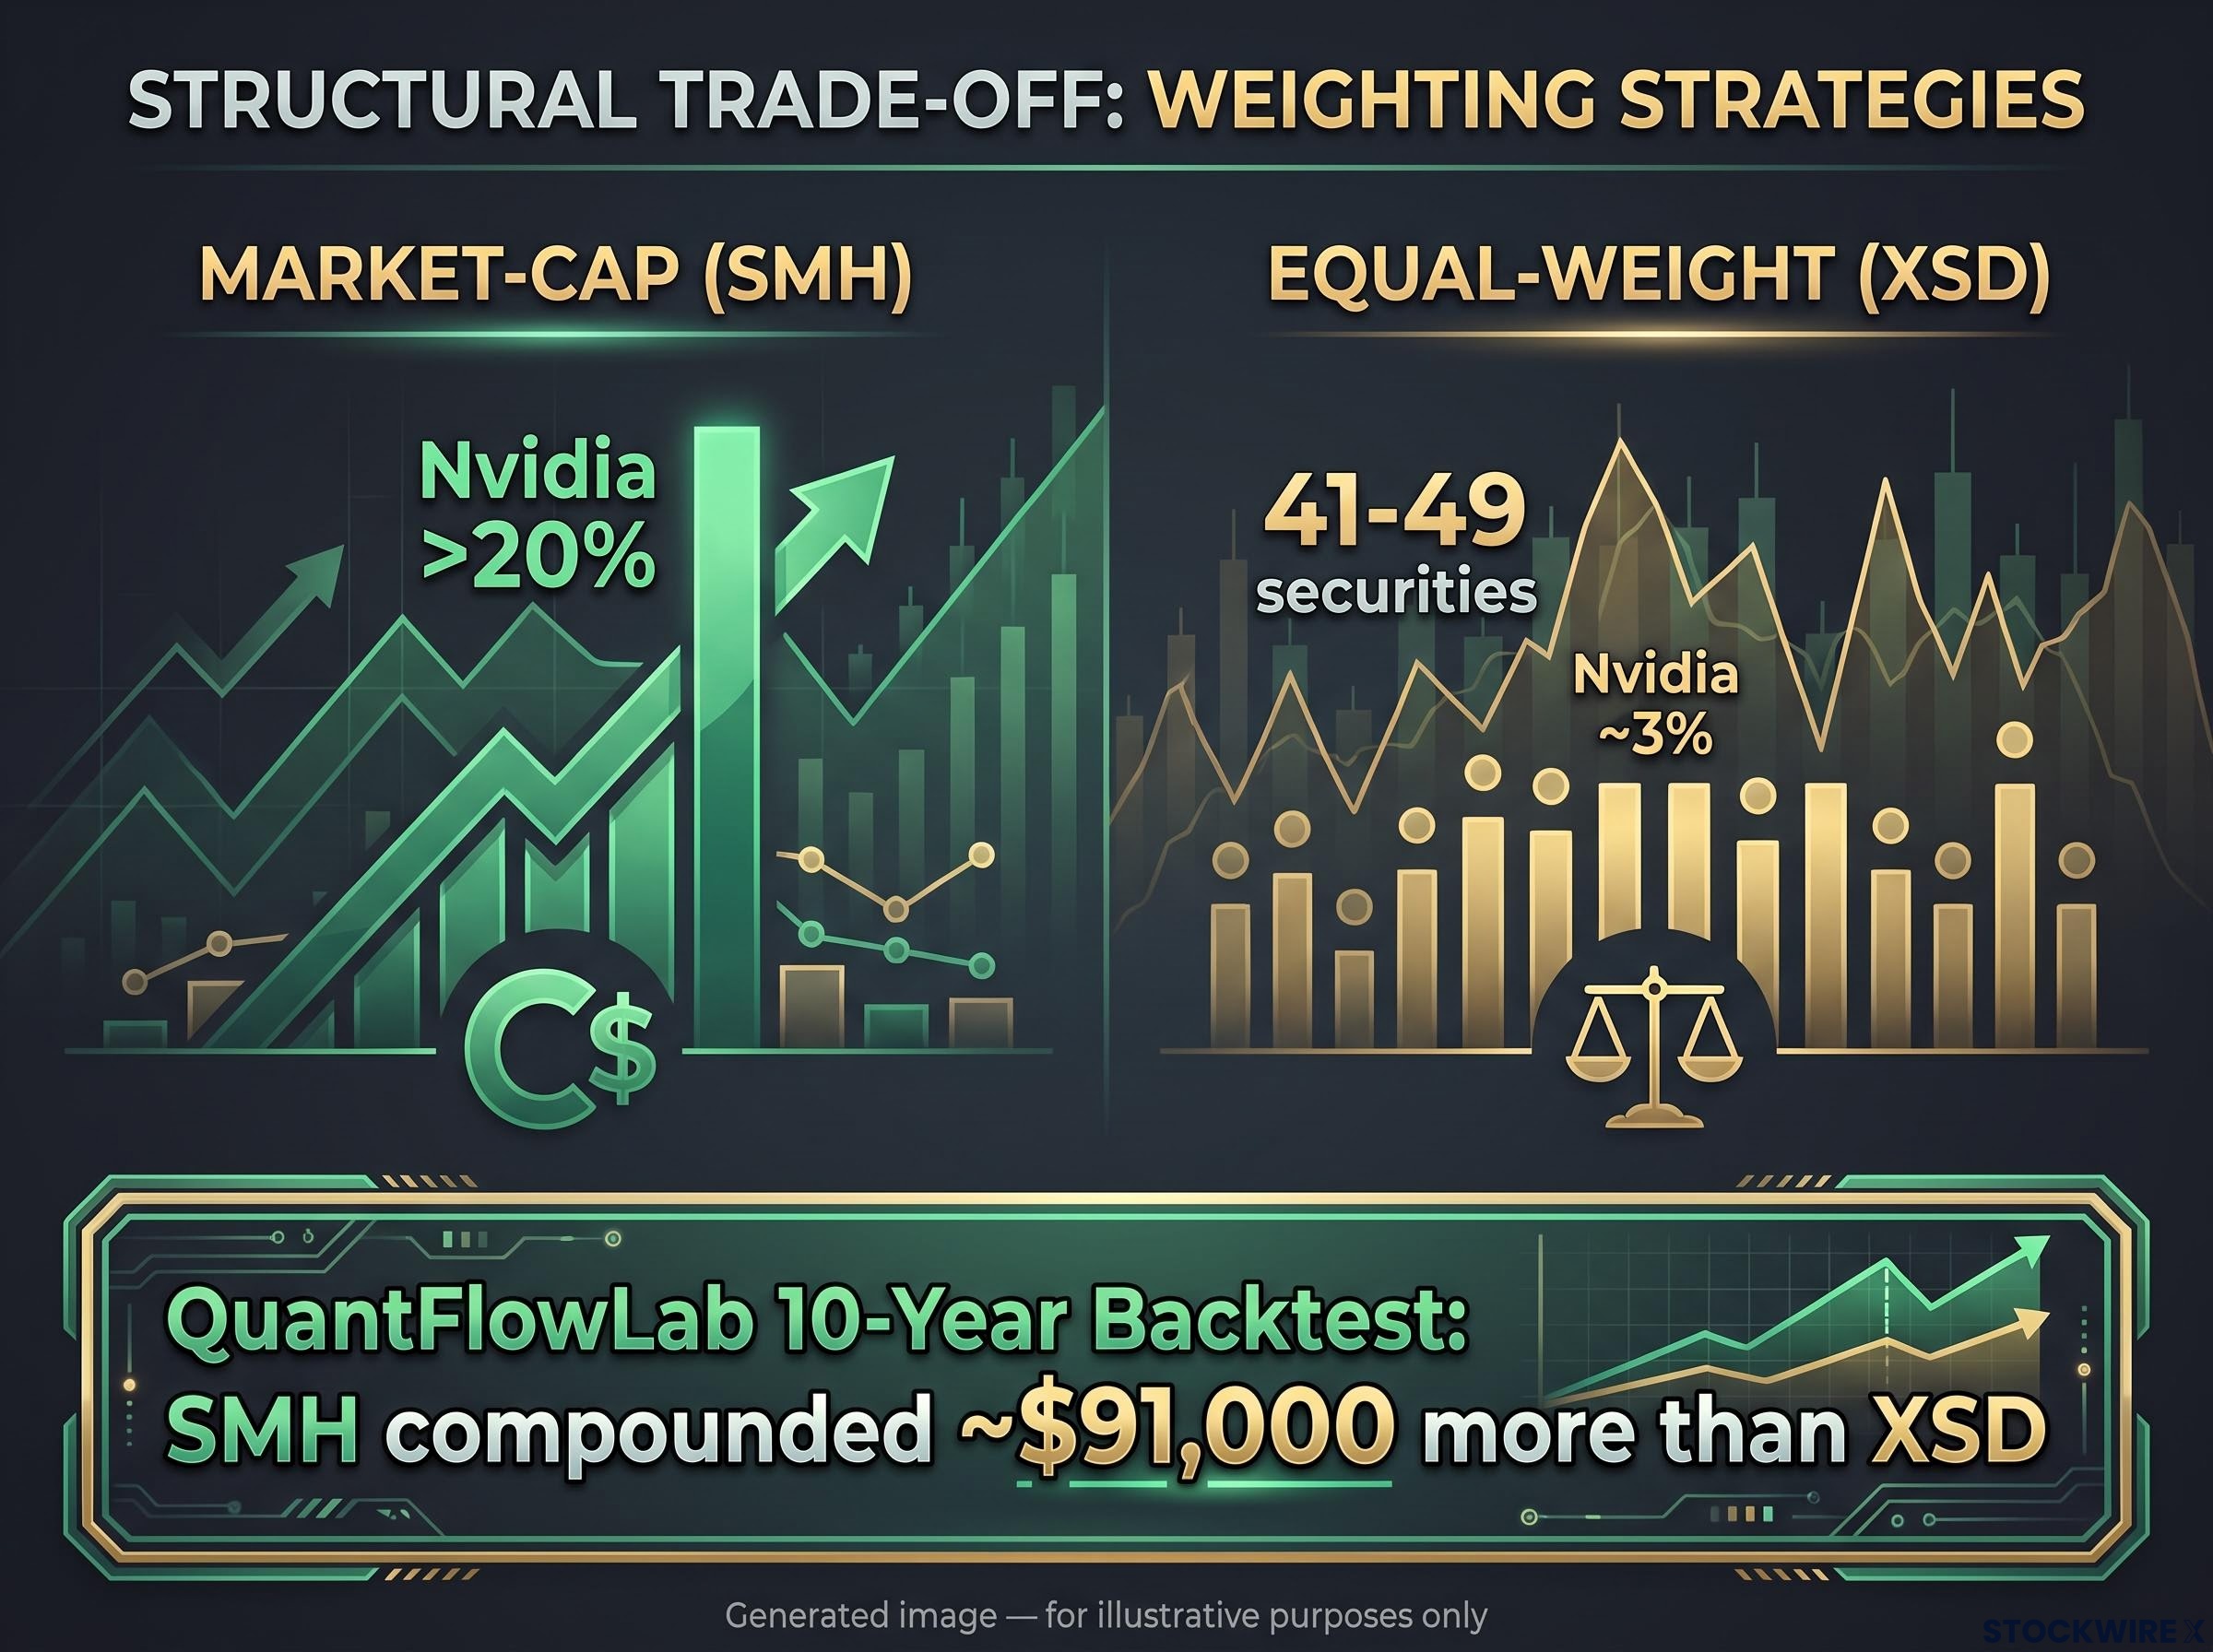
How real? Analysis from QuantFlowLab found that over a standard decade-long backtest, SMH compounded roughly $91,000 more than XSD, driven almost entirely by the momentum of mega-cap leaders. Same sector, different weighting, materially different outcome.
If you choose XSD, understand what you are actually betting on. You are wagering that mid-cap hardware companies will close the gap on the giants. That means you will structurally underperform during any stretch when a few mega-caps run the show, which describes most of the current cycle.
Factor-based selection models
There is a middle path between blind cap-weighting and rigid equal-weighting. The Invesco Dynamic Semiconductors ETF (PSI) uses quantitative factor selection, screening holdings on metrics like price momentum, earnings quality and fundamental value rather than size alone.
This changes the portfolio construction meaningfully. Instead of letting either market cap or equal weighting dictate the mix, PSI actively selects and weights stocks based on measurable financial characteristics, aiming to hold the names its model rates highest.
That active screening comes at a price. PSI charges 0.55-0.56%, noticeably above XSD’s 0.35%. You are paying for the model, so the question becomes whether its factor tilts earn back that higher fee over time.
Evaluating Asian-listed alternatives for targeted regional exposure
There is a compelling argument for going closer to the source. The chips themselves are largely built in Asia, and several regional funds let you own the foundries directly. The friction, though, is real and easy to underestimate.
The Global X Asia Semiconductor ETF (3119.HK), listed in Hong Kong, targets Pan-Asian manufacturing hubs across Taiwan, South Korea, Japan and China. It holds around 40-41 securities, with TSMC, Samsung and SK hynix each representing between 11% and 16% of the portfolio. It charges 0.68% and holds roughly US$165-190 million in assets.
Its sibling, the Global X China Semiconductor ETF (3191.HK), takes a narrower path. It focuses exclusively on domestic Chinese firms working to localise fabrication and equipment production, a pure play on China’s push for chip self-sufficiency.
For Singapore-based investors, the Lion-OCBC Securities Hang Seng TECH ETF (HST.SI) offers access to broader Asian technology leaders, including regional foundries like SMIC. It replicates the Hang Seng TECH Index and trades in both SGD and USD counters.
| Ticker | Exchange | Primary Exposure Focus | Expense Ratio |
|---|---|---|---|
| 3119.HK | HKEX | Pan-Asian foundries and memory | 0.68% |
| 3191.HK | HKEX | Domestic Chinese localisation | 0.68% |
| HST.SI | SGX | Asian tech leaders and foundries | 0.56% |
The frictions matter more than the fee. HST.SI, according to TradingView data, trades at a persistent premium to NAV of roughly 0.5-0.7%, meaning you routinely pay slightly more than the underlying holdings are worth. That is a hidden cost on every purchase.
Liquidity is the bigger issue. State Street publishes a 30-day median bid-ask spread of just 0.13% for XSD, a benefit of its scale and heavy trading. Smaller thematic Asian funds typically carry far wider spreads, which quietly erode returns each time you trade. There are also currency layers to navigate, such as 3119.HK’s structure of an RMB-denominated NAV against HKD trading, plus regional policy risks around export controls and cross-strait tensions.
Morningstar assigns 3119.HK a Neutral rating, framing it as a satellite holding for investors who deliberately want Asian semiconductor exposure, not a core global equivalent. That is the right way to think about it. These funds give you direct access to the foundries actually building the chips, but you must be prepared to absorb higher fees, wider spreads and genuine currency complexity to get it.
Finalising your specific hardware investment thesis
Three broad pathways emerge from this comparison, and each suits a different investor.
Choose maximum momentum through SMH or SOXX if you want the fullest exposure to AI leaders and can stomach the concentration risk that comes with it. Choose broad ecosystem parity through XSD or PSI if you would rather spread your bet across the supply chain, accepting likely underperformance during mega-cap-dominated rallies. Choose targeted regional plays like 3119.HK, 3191.HK or HST.SI if you want direct foundry exposure and are ready to manage the frictional costs.
Whatever you pick, judge it on total cost of ownership, not the stated expense ratio alone. Bid-ask spreads, currency friction and geopolitical volatility all add to the real price.
One last step: map your chosen fund against what you already own. Many mega-cap tech holdings quietly double up on Nvidia and TSMC, so check before you accidentally concentrate your portfolio further.
This article is for informational purposes only and should not be considered financial advice. Investors should conduct their own research and consult with financial professionals before making investment decisions. Past performance does not guarantee future results.