
Most retail investors assume a currency pair moves on interest rates. For the New Zealand Dollar, that assumption will lead you astray at least half the time, because a dairy auction result in Auckland or a factory output print from Chengdu can override a rate decision made in Wellington before the RBNZ press conference has even wrapped up.
The NZD/USD drivers you need to understand sit at the intersection of four structural forces that rarely move in the same direction at once: monetary policy set by the Reserve Bank of New Zealand, New Zealand’s deep exposure to Chinese growth, the global dairy market (the country’s largest export industry), and the broader risk appetite that pushes and pulls the US Dollar. These forces interact, and they frequently conflict.
This guide maps each driver clearly, shows you how they clash, and hands you a framework for reading why the Kiwi moves the way it does, independent of any single news cycle. What you get here is a working mental model, not a trading signal.
How RBNZ rate decisions actually move the Kiwi (and when they do not)
The intuitive logic is simple. Higher interest rates raise the yield on New Zealand government bonds, which pulls in foreign capital chasing better returns, and that demand strengthens the NZD. The interest rate gap between the RBNZ and the US Federal Reserve is one of the pair’s most reliable structural anchors.
Then reality complicates it. By the time the RBNZ actually announces a decision, the market has almost always priced it in already. So the headline number rarely moves your position much. What moves it is the surprise: what the bank signals about the future path of rates, not what it confirms about the present.
Why forward guidance matters more than the rate itself
“Priced in” means bond futures markets have already positioned for the expected outcome before the meeting. Traders build their books around the consensus forecast, so when the RBNZ delivers exactly what was expected, there is nothing new to react to.
The tradeable surprise lives in the wording of the RBNZ’s Monetary Policy Statement. A single phrase signalling a faster or slower pace of future tightening can move the Kiwi more than the rate change itself, because it forces the whole market to reprice its expectations at once.
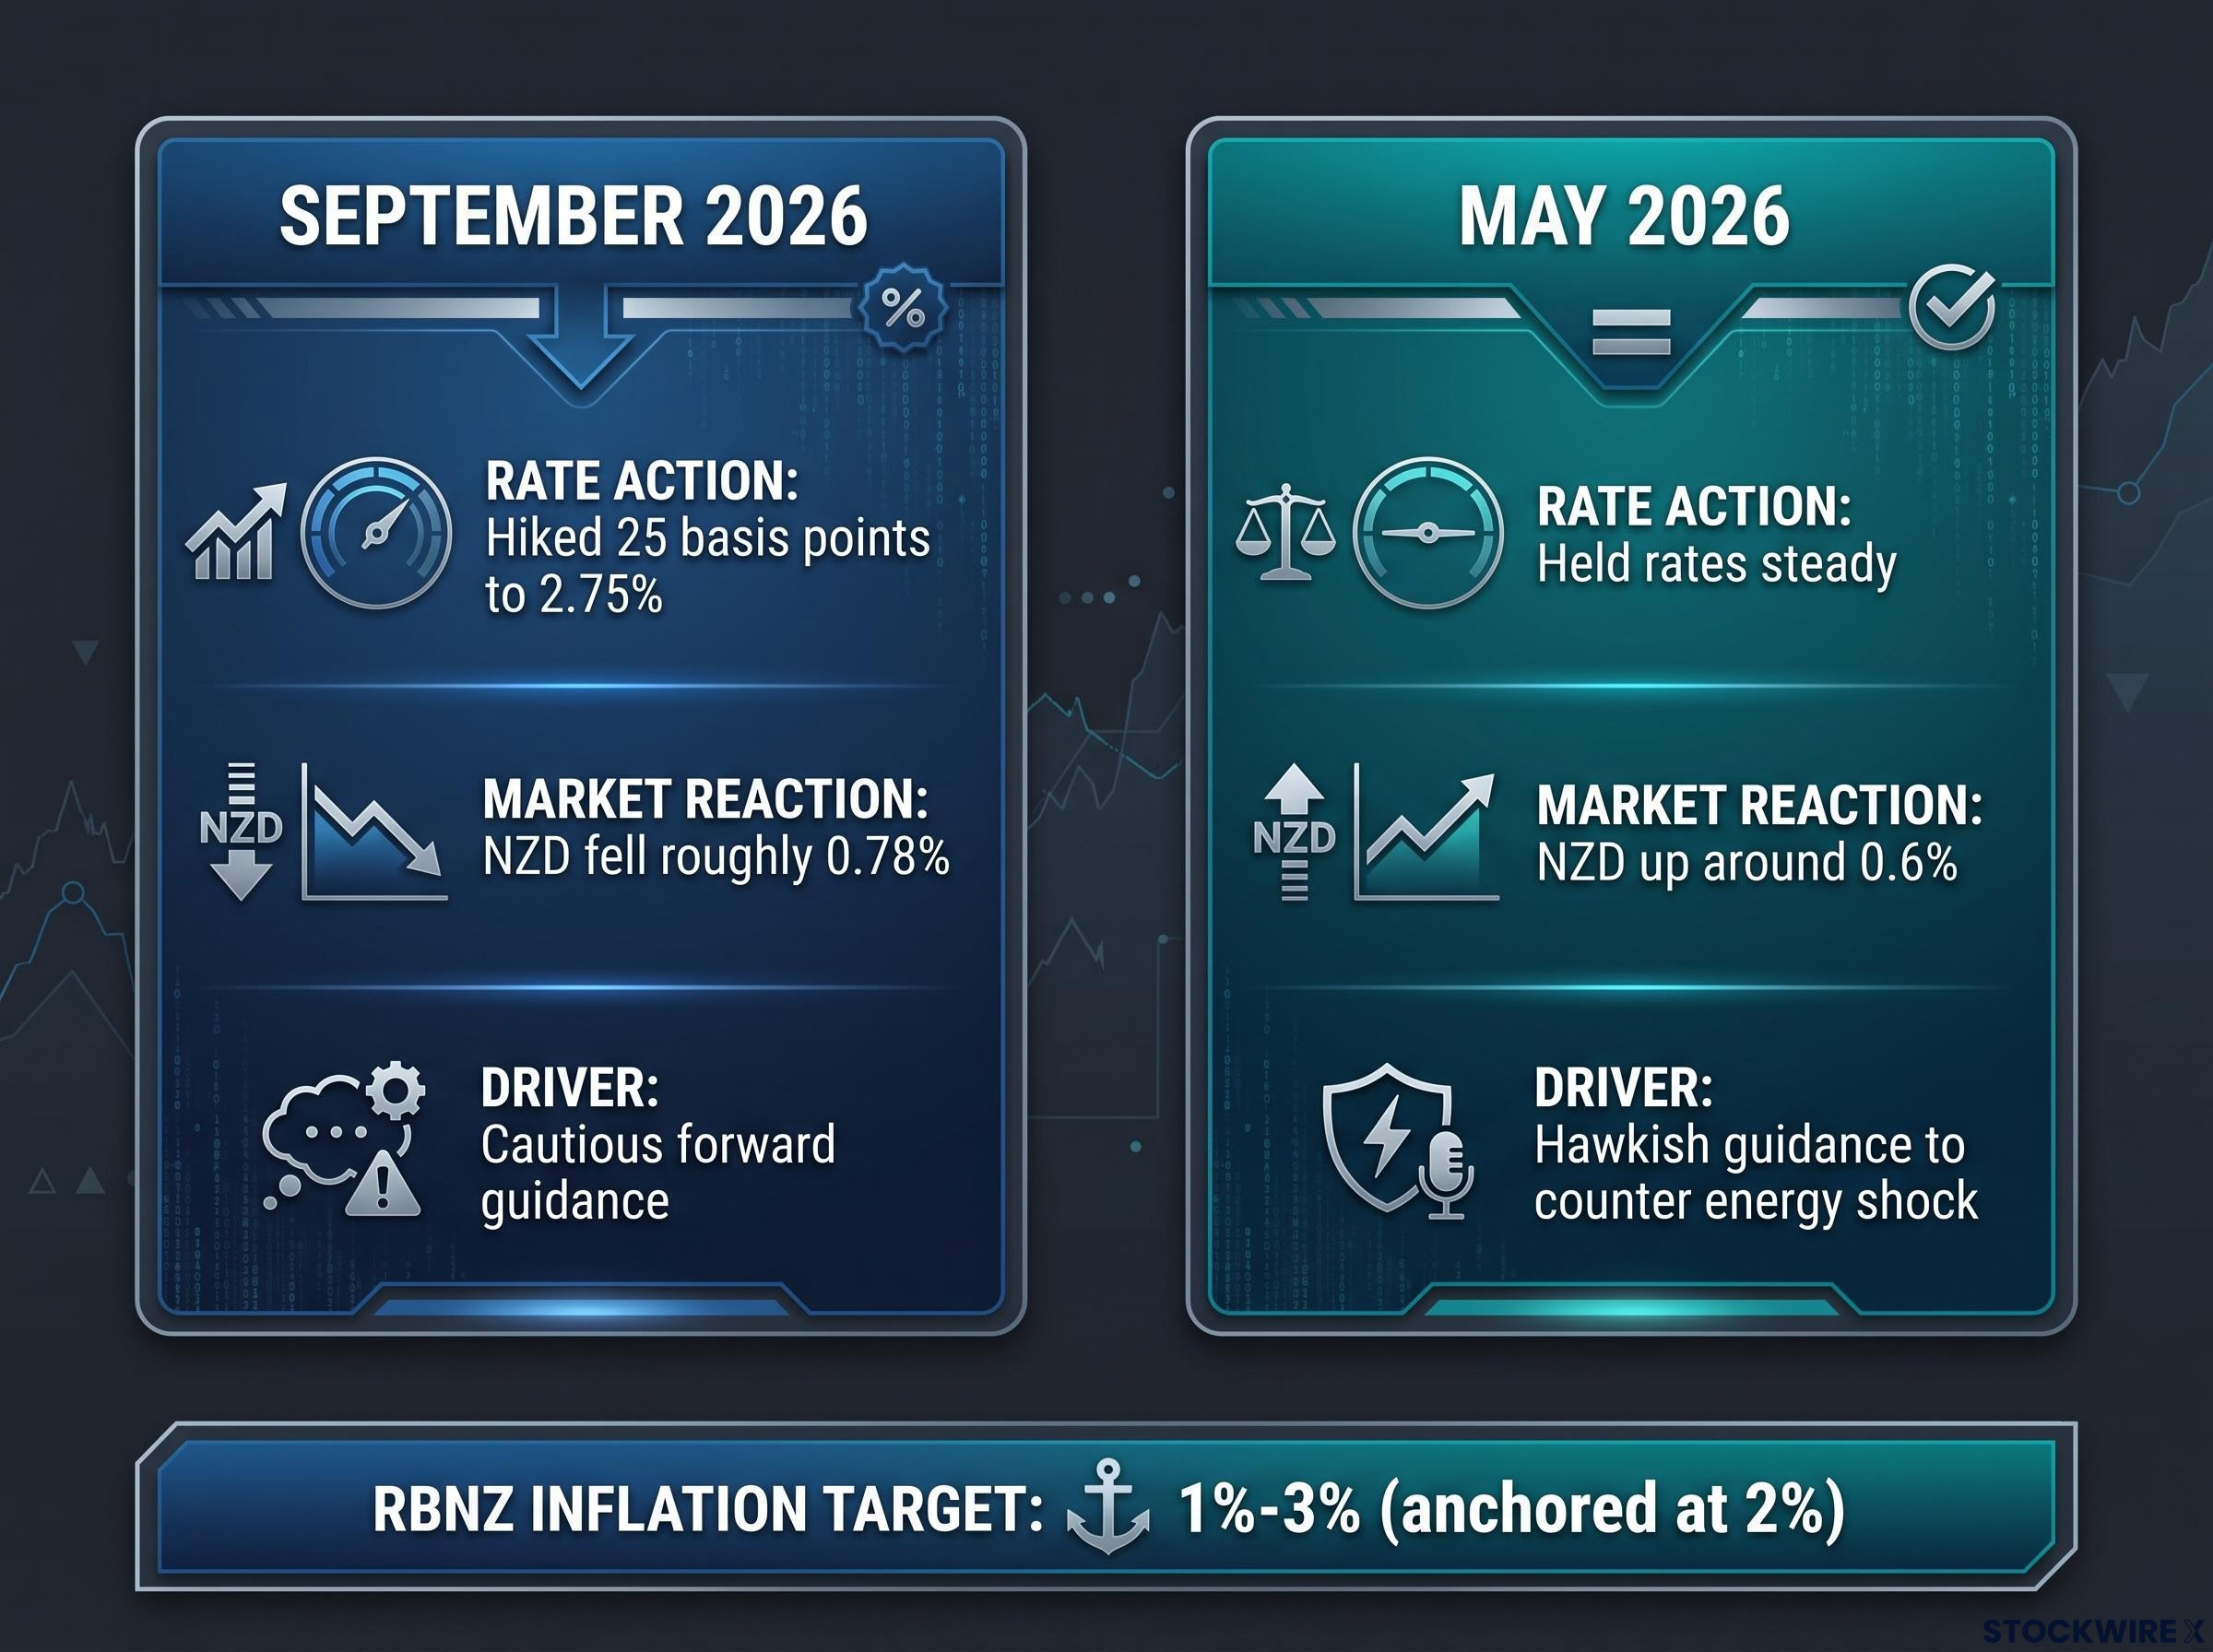
The September 2026 meeting is the cleanest example. On 2 September 2026, the RBNZ lifted the Official Cash Rate by 25 basis points to 2.75%, the second consecutive hike after an increase in July 2026. The move was widely expected, yet the NZD still fell roughly 0.78%, because the bank signalled a more cautious pace of future tightening than markets had built into the curve.
Analysts at Commerzbank noted that the September move was broadly anticipated and reflected a measured, incremental approach to withdrawing monetary support in order to anchor inflation sustainably.
Contrast that with May 2026. The RBNZ held rates steady, but warned they might rise sooner and by more than expected to counter an energy shock. That hawkish guidance pushed the NZD up around 0.6%, even though the rate itself did not budge. The RBNZ targets an inflation band of 1%-3%, anchored around the 2% midpoint, and it was the signal about defending that target, not the unchanged rate, that moved the currency.
The May 2026 RBNZ meeting is the textbook case of a hawkish hold: the bank left its Official Cash Rate unchanged at 2.25% but explicitly guided markets toward earlier and larger hikes than previously signalled, with Brent crude near $99 amplifying the inflation urgency behind the language.
Here is a reusable way to read any RBNZ meeting:
- Hawkish surprise: guidance points to faster or larger hikes than expected. NZD typically rises, even on an unchanged rate.
- As-expected delivery: the rate moves as forecast, tone matches pricing. NZD reaction is usually muted or drifts on secondary factors.
- Dovish surprise: a fully priced hike is delivered with cautious language. NZD typically weakens, even though the rate went up.
The lesson for you is blunt: watching the headline rate number is the least useful thing you can do before an RBNZ meeting. The tone of the statement, and whether the guidance leans “cautious” or “faster”, is what actually moves your position.
When big ASX news breaks, our subscribers know first
The China-proxy dynamic: why a Chengdu factory PMI moves the Kiwi
Start with the trade relationship. China is New Zealand’s largest trading partner, which means Chinese demand directly shapes New Zealand’s export volumes and, through them, the country’s terms of trade. When China’s economy runs hot, it buys more New Zealand goods, national income rises, and the NZD firms. When Chinese activity cools, the chain runs in reverse.
Now the part that surprises most people. Because the Chinese Yuan operates under capital controls and is difficult to trade freely, global investors reach for the NZD instead when they want to bet on Chinese growth. The Kiwi is liquid, accessible, and moves in sympathy with Chinese fortunes, so it becomes a stand-in.
The PBOC yuan fixing mechanism is a direct upstream input into the China-proxy dynamic: because the daily fix caps onshore USD/CNY moves within a strict 2% band and can be set stronger or weaker than market inputs alone would produce, it shapes the conditions under which the NZD tracks Chinese growth sentiment each morning.
Institutional desks refer to this as the “China-proxy Kiwi”, a high-beta, liquid vehicle for expressing a view on Chinese industrial demand.
Once you see it, previously random moves start to make sense. In early September 2026, NZD/USD found support near 0.5851-0.5855 after China’s Services PMI climbed to 51.4 in August 2026, up from 50.4 in July and ahead of the 50.6 the market expected. The Kiwi rose on Chinese data, not on anything happening in New Zealand.
The relationship is symmetric, and the downside is just as real. In late 2025, weak Chinese figures dragged the pair below 0.58, toward the 0.5775 area. A weak Chinese Manufacturing PMI print around that time, slipping to 50.6 from 51.2, sent the Kiwi down toward US$0.5651. (Precise late-2025 levels are directional estimates rather than confirmed closes.)
Which Chinese data series move NZD the most
For a Chinese data calendar, these are the four releases most likely to move the Kiwi, ranked by their typical impact:
- Manufacturing PMI: the heaviest hitter. It captures factory demand directly, and a miss or beat tends to move NZD sharply because it speaks to industrial appetite for the commodities New Zealand’s economy is geared toward.
- Services PMI: increasingly influential as China’s economy tilts toward services. The August 2026 beat is a live example of it supporting the NZD.
- Retail sales: a read on Chinese consumer strength. Softer prints tend to weigh on the Kiwi, stronger ones support it.
- Industrial production: confirms the broader activity picture. It reinforces or contradicts the PMI signals and can amplify a move already underway.
What this means for you practically is that Chinese data releases belong in your morning routine at the same priority level as RBNZ commentary. On any given day, China’s growth pulse often moves NZD/USD faster and further than anything happening domestically.
Dairy prices, the GDT auction, and why New Zealand’s exports shape the currency
Dairy is the bedrock of New Zealand’s export earnings. It is the single largest export industry, which ties it straight to the trade balance, national income, and through those, the structural valuation of the NZD. When dairy prices climb, farm incomes rise, the trade balance strengthens, and the currency gets a tailwind. When they fall, the pressure runs the other way.
The price-setting mechanism to watch is the Global Dairy Trade (GDT) auction, held fortnightly. Because it recurs on a regular cadence and sets benchmark prices for products like whole milk powder, each auction functions as a recurring sentiment event for the Kiwi.
Through 2026, the dairy market has been rebounding. The table below sets out the key auction outcomes that frame the current backdrop.
| Auction period | GDT index change | WMP price (per tonne) | Context |
|---|---|---|---|
| First auction of 2026 | +6.3% | Recovery underway | Ended nine consecutive declines |
| Mid-2026 (year-to-date) | +18% YTD (some measures) | US$3,706/MT peak | Sustained recovery momentum |
| Early August 2026 | +0.1% | Modest gain | A quieter, softer result |
| Mid-August 2026 | +0.9% | US$3,910 average | ~43,976 tonnes sold |
Here is the nuance that trips people up. A strong auction does not guarantee a stronger Kiwi. Because markets trade on relative surprise, a GDT result that comes in at +0.1% when the market expected +3.5% can still trigger an NZD sell-off, even though prices technically rose. The direction of the index matters less than whether it beat or missed expectations.
Rabobank forecasts a milk price of NZ$9.50-NZ$10.00 per kgMS for the 2026/27 season, pointing to structurally sound export earnings underpinning the currency over the medium term.
What this means for you is a matter of weighting. The GDT auction is a genuinely useful fortnightly check on New Zealand’s export health, but you should rank it below RBNZ guidance and Chinese PMI data when forming a short-term view. Macro forces almost always dominate dairy in the near term, and over-reading a bullish auction in a risk-off environment is one of the most common mistakes with this pair.
Risk sentiment and the USD: the external forces that can override everything else
You now understand three drivers: RBNZ policy, the China proxy, and dairy. This is the fourth, and in many ways it sits above the other three. It is the ceiling that can cap or crush all of them.
The NZD is classified as a “risk-on” currency, which means it appreciates when global investors feel confident and sells off when they turn defensive. In a risk-off environment, capital flees toward safe-haven assets: the US Dollar, the Japanese Yen, the Swiss Franc. When that happens, investors sell the Kiwi regardless of how attractive New Zealand’s yields or dairy prices look.
There is a second external driver layered on top. Because NZD/USD is priced against the US Dollar, US Federal Reserve policy and US labour market data create their own independent force. The current expert consensus is that near-term direction is dominated by USD strength and Fed policy more than by any supportive regional factor, and a strong US jobs report can shift focus away from a Chinese PMI beat within minutes.
The Fed communication regime shifted materially in mid-2026 when Kevin Warsh scrapped the forward-guidance framework at his first FOMC press conference, meaning the USD leg of NZD/USD now reacts more sharply to individual data releases than it did when the Fed pre-signalled its intentions months in advance.
New Zealand’s structural profile amplifies all of this. It is a small, open economy, a net energy importer, and it runs a large current account deficit, which leaves the Kiwi acutely exposed when geopolitical shocks hit.
State Street Global Advisors warns that war-related risks and supply-chain disruptions can trigger sharp risk-off behaviour, causing the NZD to underperform regardless of favourable domestic yields or dairy exports.
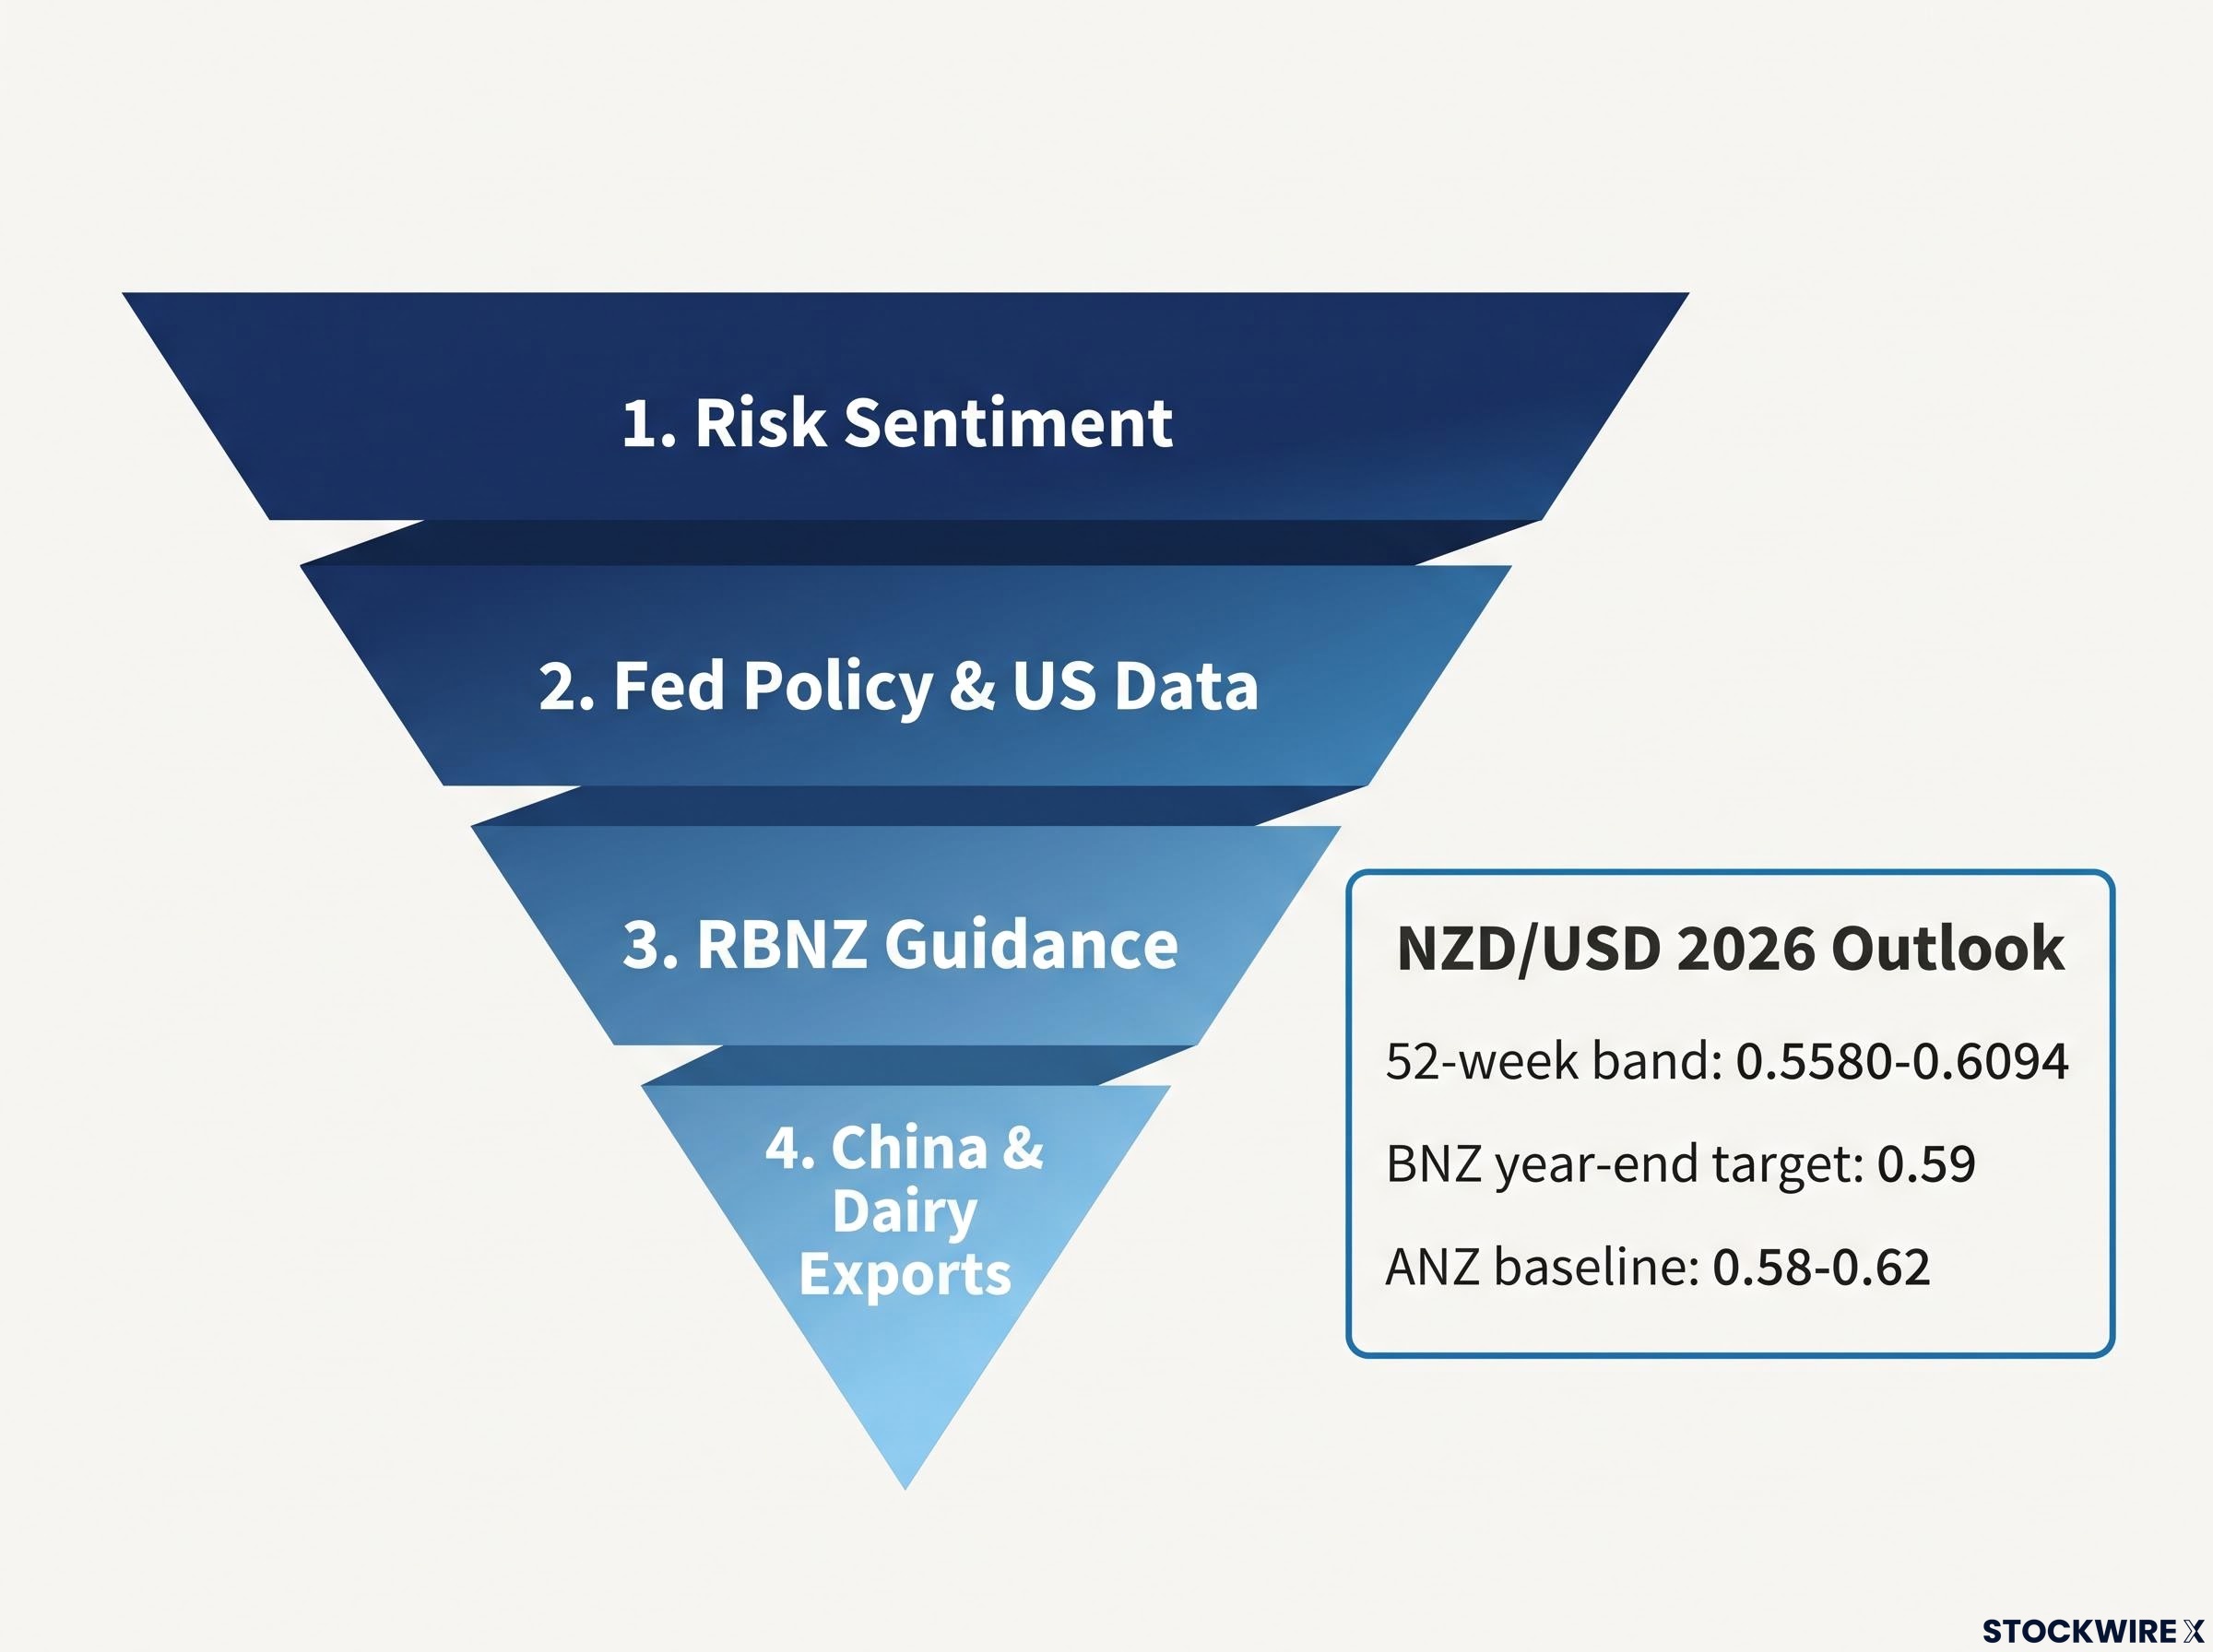
The pair’s recent range reflects this tension: a 52-week band of roughly 0.5580-0.6094, with BNZ targeting 0.59 by year-end and ANZ modelling a baseline of 0.58-0.62 for 2026. That is a relatively contained range, but it can be broken quickly when risk sentiment turns.
Building a hierarchy: which driver wins when they conflict
The practical value here is a way to resolve conflicts. When your signals point in different directions, you need to know which one to trust. Order them like this:
- Risk sentiment: the dominant force. In a genuine risk-off move, everything else is secondary and moves can be fast and large.
- Fed policy and US data: the second independent driver. Because the pair is priced against the dollar, US strength can override supportive regional news over days and weeks.
- RBNZ guidance: the domestic anchor. It sets the structural rate differential and moves the pair on the tone of forward guidance.
- China and dairy: context-setters. They shape the medium-term backdrop and move the pair on individual data prints, but they are readily overridden by the two levels above.
Work through a real conflict. If a mid-August GDT auction posts a modest gain and Chinese PMI beats expectations, the domestic and trade signals are bullish. But if US equities are selling off and traders are piling into the dollar ahead of US labour data, risk sentiment and Fed positioning sit higher in the hierarchy and can pull the Kiwi lower on the same day.
For you, the takeaway is this. The NZD is the currency most likely to be caught between good domestic news and bad global news at the same time. Once you know risk sentiment sits at the top of the stack, you stop being surprised by a strong dairy auction that still produces a weaker Kiwi.
Reading NZD/USD as a retail investor: what this framework means in practice
You have now absorbed four structural drivers. The job from here is to turn them into a monitoring routine you can actually run, because holding an informed view on this pair means tracking more than a single rate differential.
At its current level near 0.585, inside a recent 0.56-0.61 band, NZD/USD is trading quietly. But quiet ranges break, and the four-driver checklist below is what keeps you ahead of the move rather than reacting to it after the fact.
Before you position, know the structural risks of this pair. Compared with EUR/USD, the Kiwi is smaller and less liquid, so it carries wider spreads during off-peak hours, reacts more sharply to unexpected news, and can gap on weekend events when the market cannot reprice in real time.
Forex technical analysis layers on top of the four-driver framework as a second-pass filter: once you know which direction risk sentiment and RBNZ guidance point, support and resistance levels, moving average clusters, and RSI readings help you identify the specific price zones where the macro thesis is likely to be tested.
Here is the four-category monitoring framework, with what to watch and how often it lands:
- RBNZ guidance: the tone of Monetary Policy Statements, not the headline rate. Roughly eight meetings per year.
- Chinese activity data: manufacturing PMI, services PMI, retail sales, industrial production. Monthly releases.
- Global Dairy Trade auctions: the index change relative to expectations. Fortnightly.
- US labour market and Fed communications: nonfarm payrolls and Fed policy signals. Monthly and meeting-driven.
| Driver | Key data series | Release frequency | NZD signal |
|---|---|---|---|
| RBNZ policy | Monetary Policy Statement tone | ~8 meetings/year | Hawkish guidance bullish; dovish guidance bearish |
| China proxy | Manufacturing/services PMI, retail sales | Monthly | Data beats bullish; misses bearish |
| Dairy | GDT auction index | Fortnightly | Beat vs expectations bullish; miss bearish |
| Risk sentiment/USD | Nonfarm payrolls, Fed policy | Monthly/meeting-driven | Risk-on bullish; risk-off and USD strength bearish |
The honest conclusion is that NZD/USD is one of the more information-intensive major pairs to hold an informed view on. But if you track all four categories, you will understand its moves far better than anyone watching only the headline rate differential, and the forward-guidance principle is your most consistent edge across the lot.
This article is for informational purposes only and should not be considered financial advice. Investors should conduct their own research and consult with financial professionals before making investment decisions.
Past performance does not guarantee future results. Forecasts and projections cited here are subject to market conditions and various risk factors, and forward-looking statements are speculative and may change as conditions evolve.