The dollar has given back 1.1% from its 18-month high. That sounds like a retreat. The chart says otherwise.
The US dollar index (DXY), a gauge of the greenback’s value versus a group of leading currencies, moved sideways around 101.70 during Thursday’s Asian session on 22 October 2026. It is holding just above the near three-week low it touched on Tuesday, pinned between falling Treasury yields pulling it down and Federal Reserve hike expectations holding it up.
That standoff may not last much longer. The Federal Open Market Committee (FOMC), the Fed’s rate-setting body, concludes its two-day meeting on 28 October. A day later, on 29 October, the personal consumption expenditures (PCE) price index and the advance estimate of third-quarter GDP land within the same hour. Together they could decide which force wins.
Here is what is keeping the index afloat, which levels would signal its next move, and which data points would change the picture.
Why is the US dollar index stuck near 101.70 after its 18-month high?
Start with the path. The index climbed to its highest level since April 2025 last week before Treasury yields reversed sharply.
The rally to 102.86 began with the breakout above 100 in September, when a unanimous Fed hike, a higher dot plot and Middle East risk converged to lift the index against every major currency.
- 102.86 on 14 October, the 18-month high (Reuters)
- 102.03 on 15 October, the day after the yield reversal (Reuters)
- About 101.70 on 22 October, just above Tuesday’s near three-week low (Mitrade/FXStreet)
The pullback in one figure The index has shed roughly 1.16 points, or 1.1%, from its 14 October peak.
The striking part is how little has happened since. Reuters had the dollar index down only 0.14% for the week as of 16 October, and price has drifted rather than slid in the days since.
The rate backdrop explains part of the drop. The Fed lifted its funds target range to 3.75%-4.00% with a 25 basis point hike in September, but the 10-year Treasury yield has since eased to about 5.09%, roughly 25 bp below its multi-year peak near 5.34%. A basis point is one hundredth of a percentage point.
What stops the slide is risk. Oil-driven inflation worries and the Iran situation keep a floor under the dollar as a safe haven. Tehran’s top diplomat, Abbas Araghchi, indicated that Iran would be open to talks once more provided Washington shows credible signs it genuinely wants a settlement. Meanwhile, The New York Times reported that American and Israeli officials have drafted options for a further wave of attacks once the US midterm elections have passed.
Those two headlines point in opposite directions, and so does the market. A flat index ahead of a cluster of major events tells you traders have not picked a side, so you should read the current price action as positioning, not conviction.
When big ASX news breaks, our subscribers know first
How do falling yields and Fed hike expectations pull the dollar in opposite directions?
The puzzle is a currency that is both supported and restrained at the same time. To see why, it helps to know what drives the DXY in the first place.
The index measures the dollar’s value against six major currencies, led by the euro and including the yen and sterling. It rises when global investors want dollar assets, and that demand depends mainly on two things: the return those assets pay, and how nervous markets feel.
Forces supporting the dollar
- Expected policy channel. Markets price roughly 80%-83% odds of an October hold but 88%-92% odds of a December hike, according to Kitco/Reuters and Mitrade. Brown Brothers Harriman (BBH) calls a December increase fully priced. Higher expected short-term rates lift the relative return on dollar assets.
- Oil-inflation channel. Higher oil prices raise US inflation expectations and the odds of a tighter Fed. They also hurt oil-importing economies such as the euro area and Japan, while US energy independence leaves America relatively insulated.
- Geopolitical haven channel. Escalation with Iran drives demand for liquid, safe assets, and the dollar remains the default choice.
Forces restraining the dollar
- Long-term yield and growth channel. The retreat from the 5.34% peak shrinks the income advantage of holding dollars and can signal softer growth ahead.
- Treasury haven channel. This is where safe-haven demand cuts both ways. Worries about the AI-led equity rally pushed money into Treasuries and drove yields lower, even as the dollar itself drew haven buying.
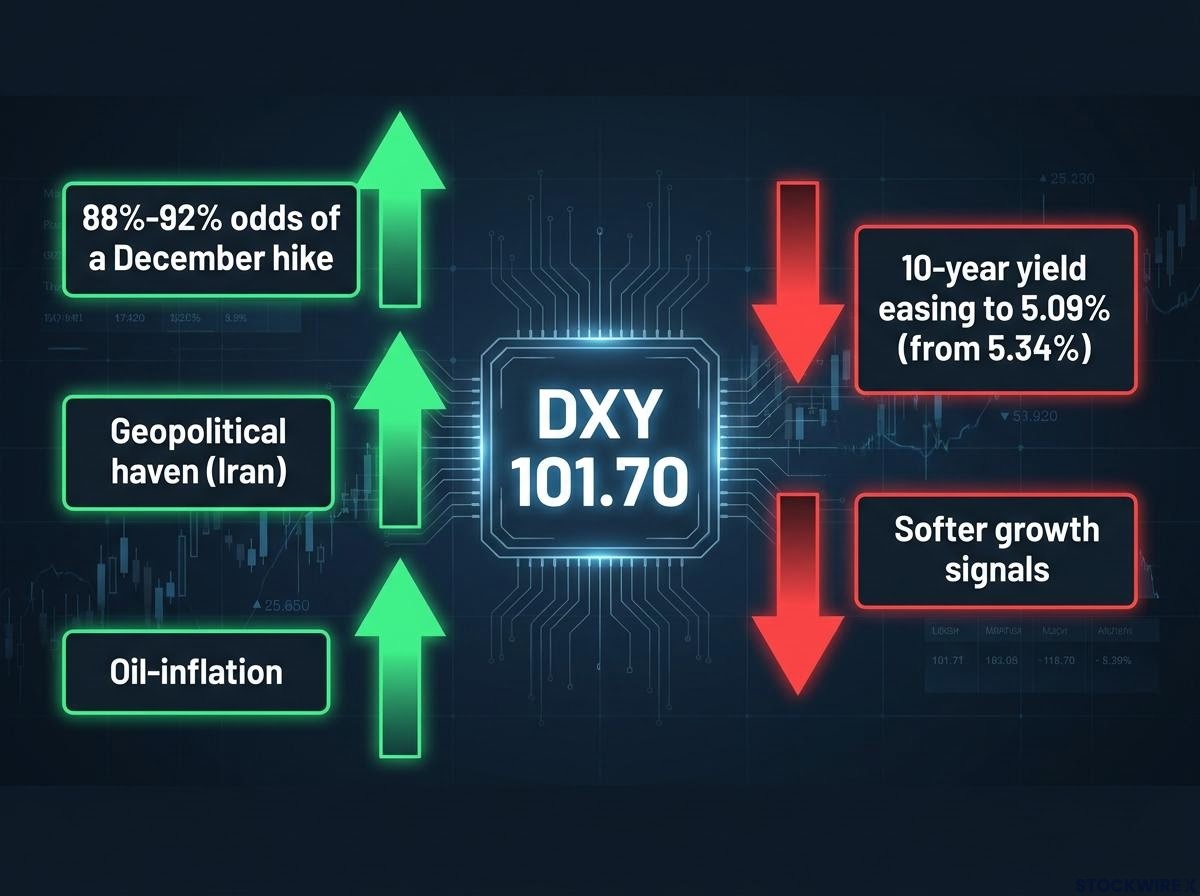
The net result Oil and Fed hike expectations push the dollar up. Lower long-term yields, weaker growth signals and Treasury buying hold it down. The index sits where those forces cancel out.
John Velis of BNY argues the dollar will stay sensitive to the direction of yields rather than react mechanically to every inflation headline. Marc Chandler of Bannockburn Capital Markets says rates have driven the dollar since mid-June, but concerns about whether the AI rally can last are starting to offset that support.
The takeaway for you is that the next move depends on which channel dominates. Watching the 10-year yield will tell you more than reacting to headlines alone.
What do the technical levels say, and how has the dollar fared against the majors?
That balance shows up on the chart as a narrow corridor. Step outside the index, though, and the dollar looks weaker than its sideways drift suggests.
The technical map
On the 4-hour chart analysed by FXStreet, the bias is mildly bullish because the index trades above its 200-period simple moving average (SMA). An SMA is the average closing price over a set number of periods, here 200 four-hour candles. Recovery is capped at the 23.6% Fibonacci retracement, a level derived from the size of the prior move that traders use to mark likely turning points.
The sideways drift sits inside a corridor that DXY technical analysis would read through moving averages and momentum: the 200-period SMA at 101.00 is the line a bullish bias depends on, while the 23.6% retracement caps recovery.
| Level | Role | What a break implies |
|---|---|---|
| 101.92 | Resistance (23.6% retracement) | A sustained move above it would resume the uptrend |
| 101.28 | Initial support (38.2% retracement) | A drop below it exposes the moving average |
| 101.00 | Secondary support (200-period SMA) | A decisive break undermines the bullish bias |
Seven-day scoreboard against the majors
| Currency | 7-day USD change | Approximate spot level |
|---|---|---|
| NZD | -1.76% | NZD/USD 0.5702-0.5709 |
| GBP | -1.47% | GBP/USD 1.3392-1.3396 |
| CAD | -1.38% | USD/CAD 1.4042 |
| CHF | -1.38% | USD/CHF 0.8244 |
| EUR | -0.74% | EUR/USD 1.1232 |
| AUD | -0.62% | AUD/USD 0.7025 |
| JPY | -0.19% | USD/JPY 158 |
The dollar fell against every major in FXStreet’s heat map. The New Zealand dollar led, helped by expectations of a domestic rate hike, while sterling touched a one-month high of 1.3409 earlier in the week.
The yen is the exception. The dollar barely slipped against it, and with USD/JPY near 158, the yen remains weak in absolute terms.
Put the two halves together and the risk is clear. A tight range combined with broad weakness against peers leaves the index vulnerable to a break lower, yet it sits only about 0.2 points below 101.92, so a hawkish surprise could flip the picture quickly.
What could move the dollar next: the FOMC, PCE and GDP week
The trigger for that break is now on the calendar.
- 28 October: FOMC decision, concluding the two-day meeting
- 29 October, 8:30 a.m. ET: PCE price index for September
- 29 October, 8:30 a.m. ET: advance Q3 GDP estimate
Continuum Economics expects core PCE, the Fed’s preferred inflation gauge excluding food and energy, at 2.4% annualised. Trading Economics puts the GDP consensus at 2.2% quarter-on-quarter annualised, down from 3.1% previously.
Core PCE has run above 3% in every month of 2026 on one estimate, so a reading near the 2.4% forecast would mark a sharp change in the inflation story that has underpinned hike pricing.
| Scenario | Likely dollar reaction | What would trigger it |
|---|---|---|
| Hawkish hold | Dollar and yields rise | Firm guidance toward a December hike |
| Dovish hold | Pullback extends toward 101.00 | Signs September’s hike was enough |
| Hot PCE | Push back toward 102.86 | Broad monthly acceleration in core inflation |
| Weak GDP | Growth and yield support erodes | A clear miss on the 2.2% consensus |
| Iran escalation | Haven buying lifts the dollar | Attacks on energy infrastructure or an oil spike |
| De-escalation | Haven premium fades | A diplomatic breakthrough and falling oil |
BBH expects a dollar recovery if October PMI data confirm the US still holds a growth advantage, while TD Securities still expected an October hike. Joel Kruger of LMAX Group counters that much of the expected tightening is already priced.
That matters for your read. With a December hike close to fully priced, the dollar needs a hawkish surprise, not mere confirmation, to push meaningfully higher.
The longer view is more sobering for dollar bulls. Strategists in a Reuters poll treated recent strength as cyclical, though 80% saw near-term risk of the dollar beating their three-month forecasts.
MUFG’s DXY forecast path 102.19 (Q4 2026), 100.58 (Q1 2027), 98.88 (Q2 2027), 97.27 (Q3 2027)
No historical study found quantifies how the dollar behaves when an FOMC decision, PCE and GDP release land in the same week, so treat any confident call with caution. Past performance does not guarantee future results, and these projections are subject to market conditions and various risk factors.
Reading the dollar through next week’s catalysts
The index is balanced, not broken. Hike pricing, oil and haven demand hold one side; falling yields and softer growth pull the other. The lines that matter are 101.92 above and 101.00 below.
Keep two horizons in mind. Strategists expect the medium-term trend to point lower, but next week’s events can still produce sharp short-term moves in either direction.
Before forming a view, watch three variables:
- Yield direction: whether the 10-year keeps falling from 5.34% or turns higher
- Core PCE: whether it runs hotter than 2.4%
- Iran and oil headlines: escalation supports the dollar, de-escalation removes the cushion
This article is for informational purposes only and should not be considered financial advice. Investors should conduct their own research and consult with financial professionals before making investment decisions.
—