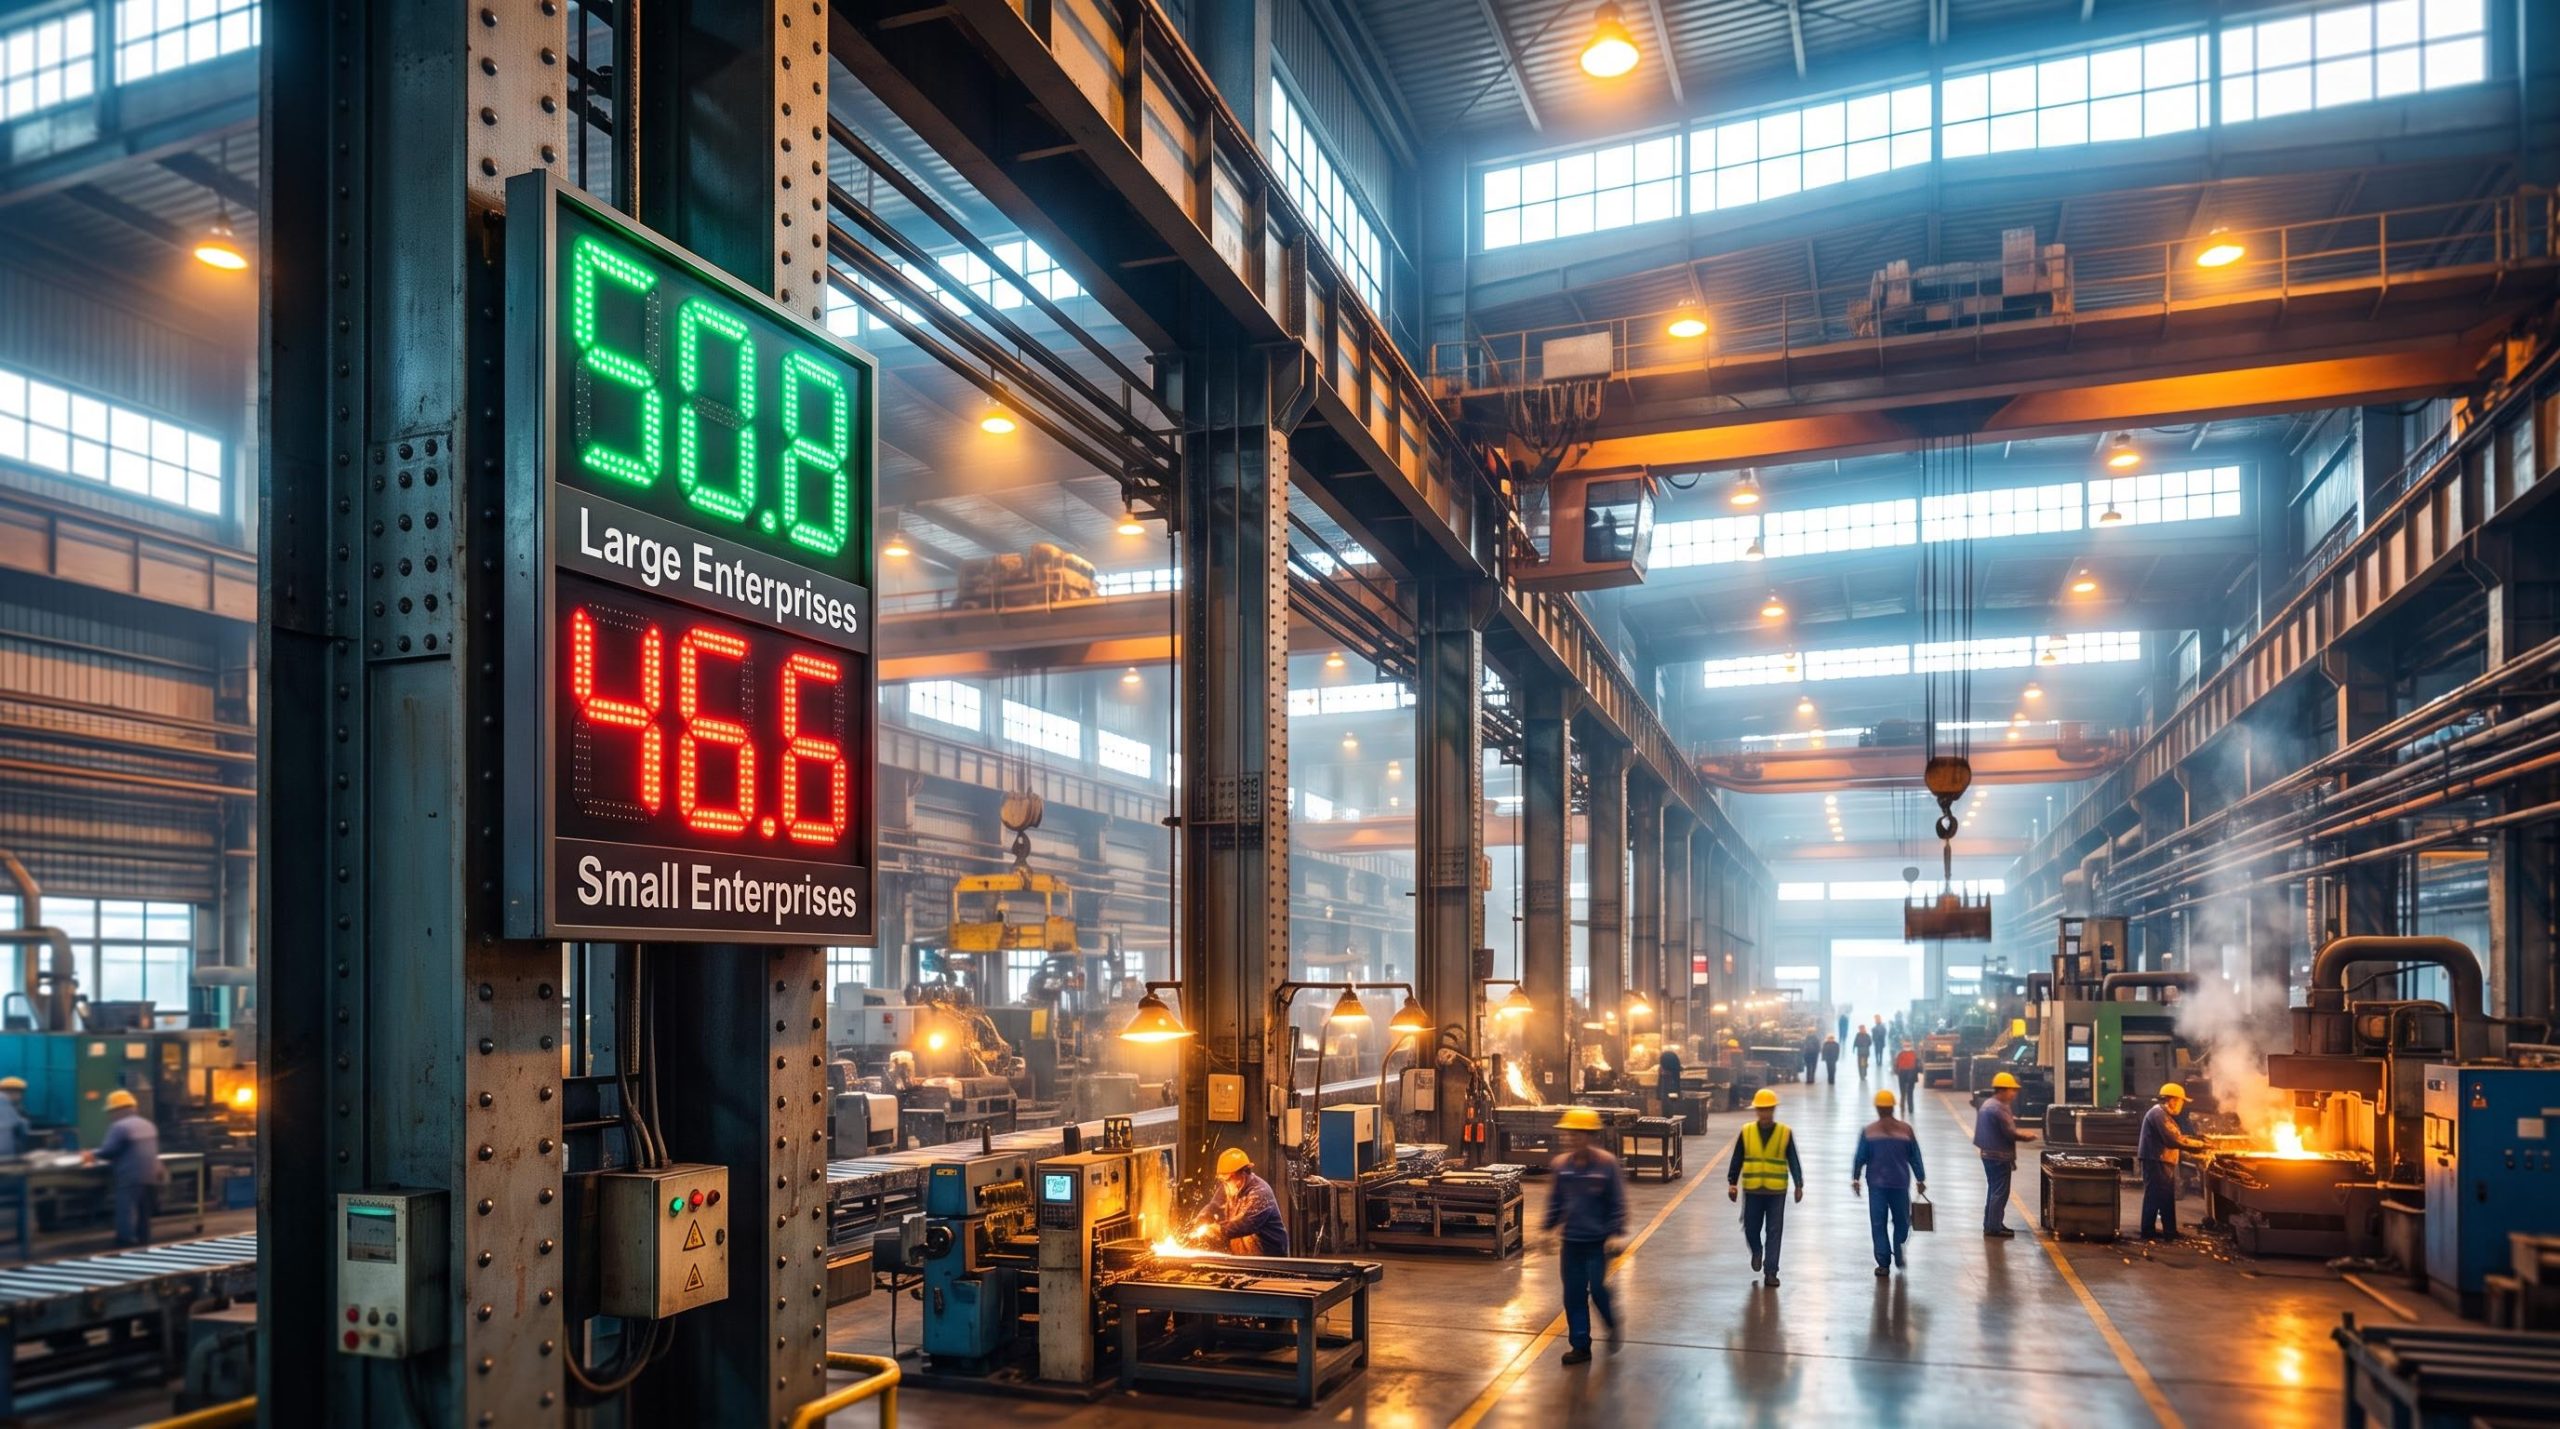
China’s official manufacturing PMI printed at 49.4 in August 2025, a fifth consecutive month below the expansion threshold of 50.0, yet large enterprises crossed back into growth territory at 50.8. The factory sector is still technically contracting. The firms that anchor global supply chains are expanding. That contradiction is the story.
China’s manufacturing data is a bellwether for commodity demand, emerging market equity performance, and global trade flows. A reading that remains sub-50 while showing sharp internal divergence asks investors to think in layers rather than react to the headline alone.
Here is what the enterprise-size breakdown, the sub-index dynamics, and the margin-squeeze mechanics actually tell you about which parts of China’s industrial economy are recovering, and what that means for where you have money working.
Five months below 50, but the headline understates the split
The headline number confirms what markets already suspected. 49.4 is the fifth consecutive month below the expansion threshold, placing the reading squarely within a Q3 2025 trend of marginal improvement against a backdrop of persistent contraction. Up from 49.3 in July, the move is directional but barely perceptible.
Equity markets typically pre-price PMI trends well before official releases, meaning PMI surprise components carry more market-moving weight than the absolute level of any single print, a dynamic that explains why 49.4 provoked a muted rather than sharp market reaction.
The enterprise-size breakdown tells a different story entirely.
Large manufacturers, many of them state-linked or plugged into global export supply chains, posted a PMI of 50.8 in August, up from 50.3 in July. That is expansion, and it is accelerating. Medium enterprises moved in the opposite direction, slipping to 48.9 from 49.5. Small enterprises sat at 46.6, up fractionally from 46.4 but still deep in contraction territory.
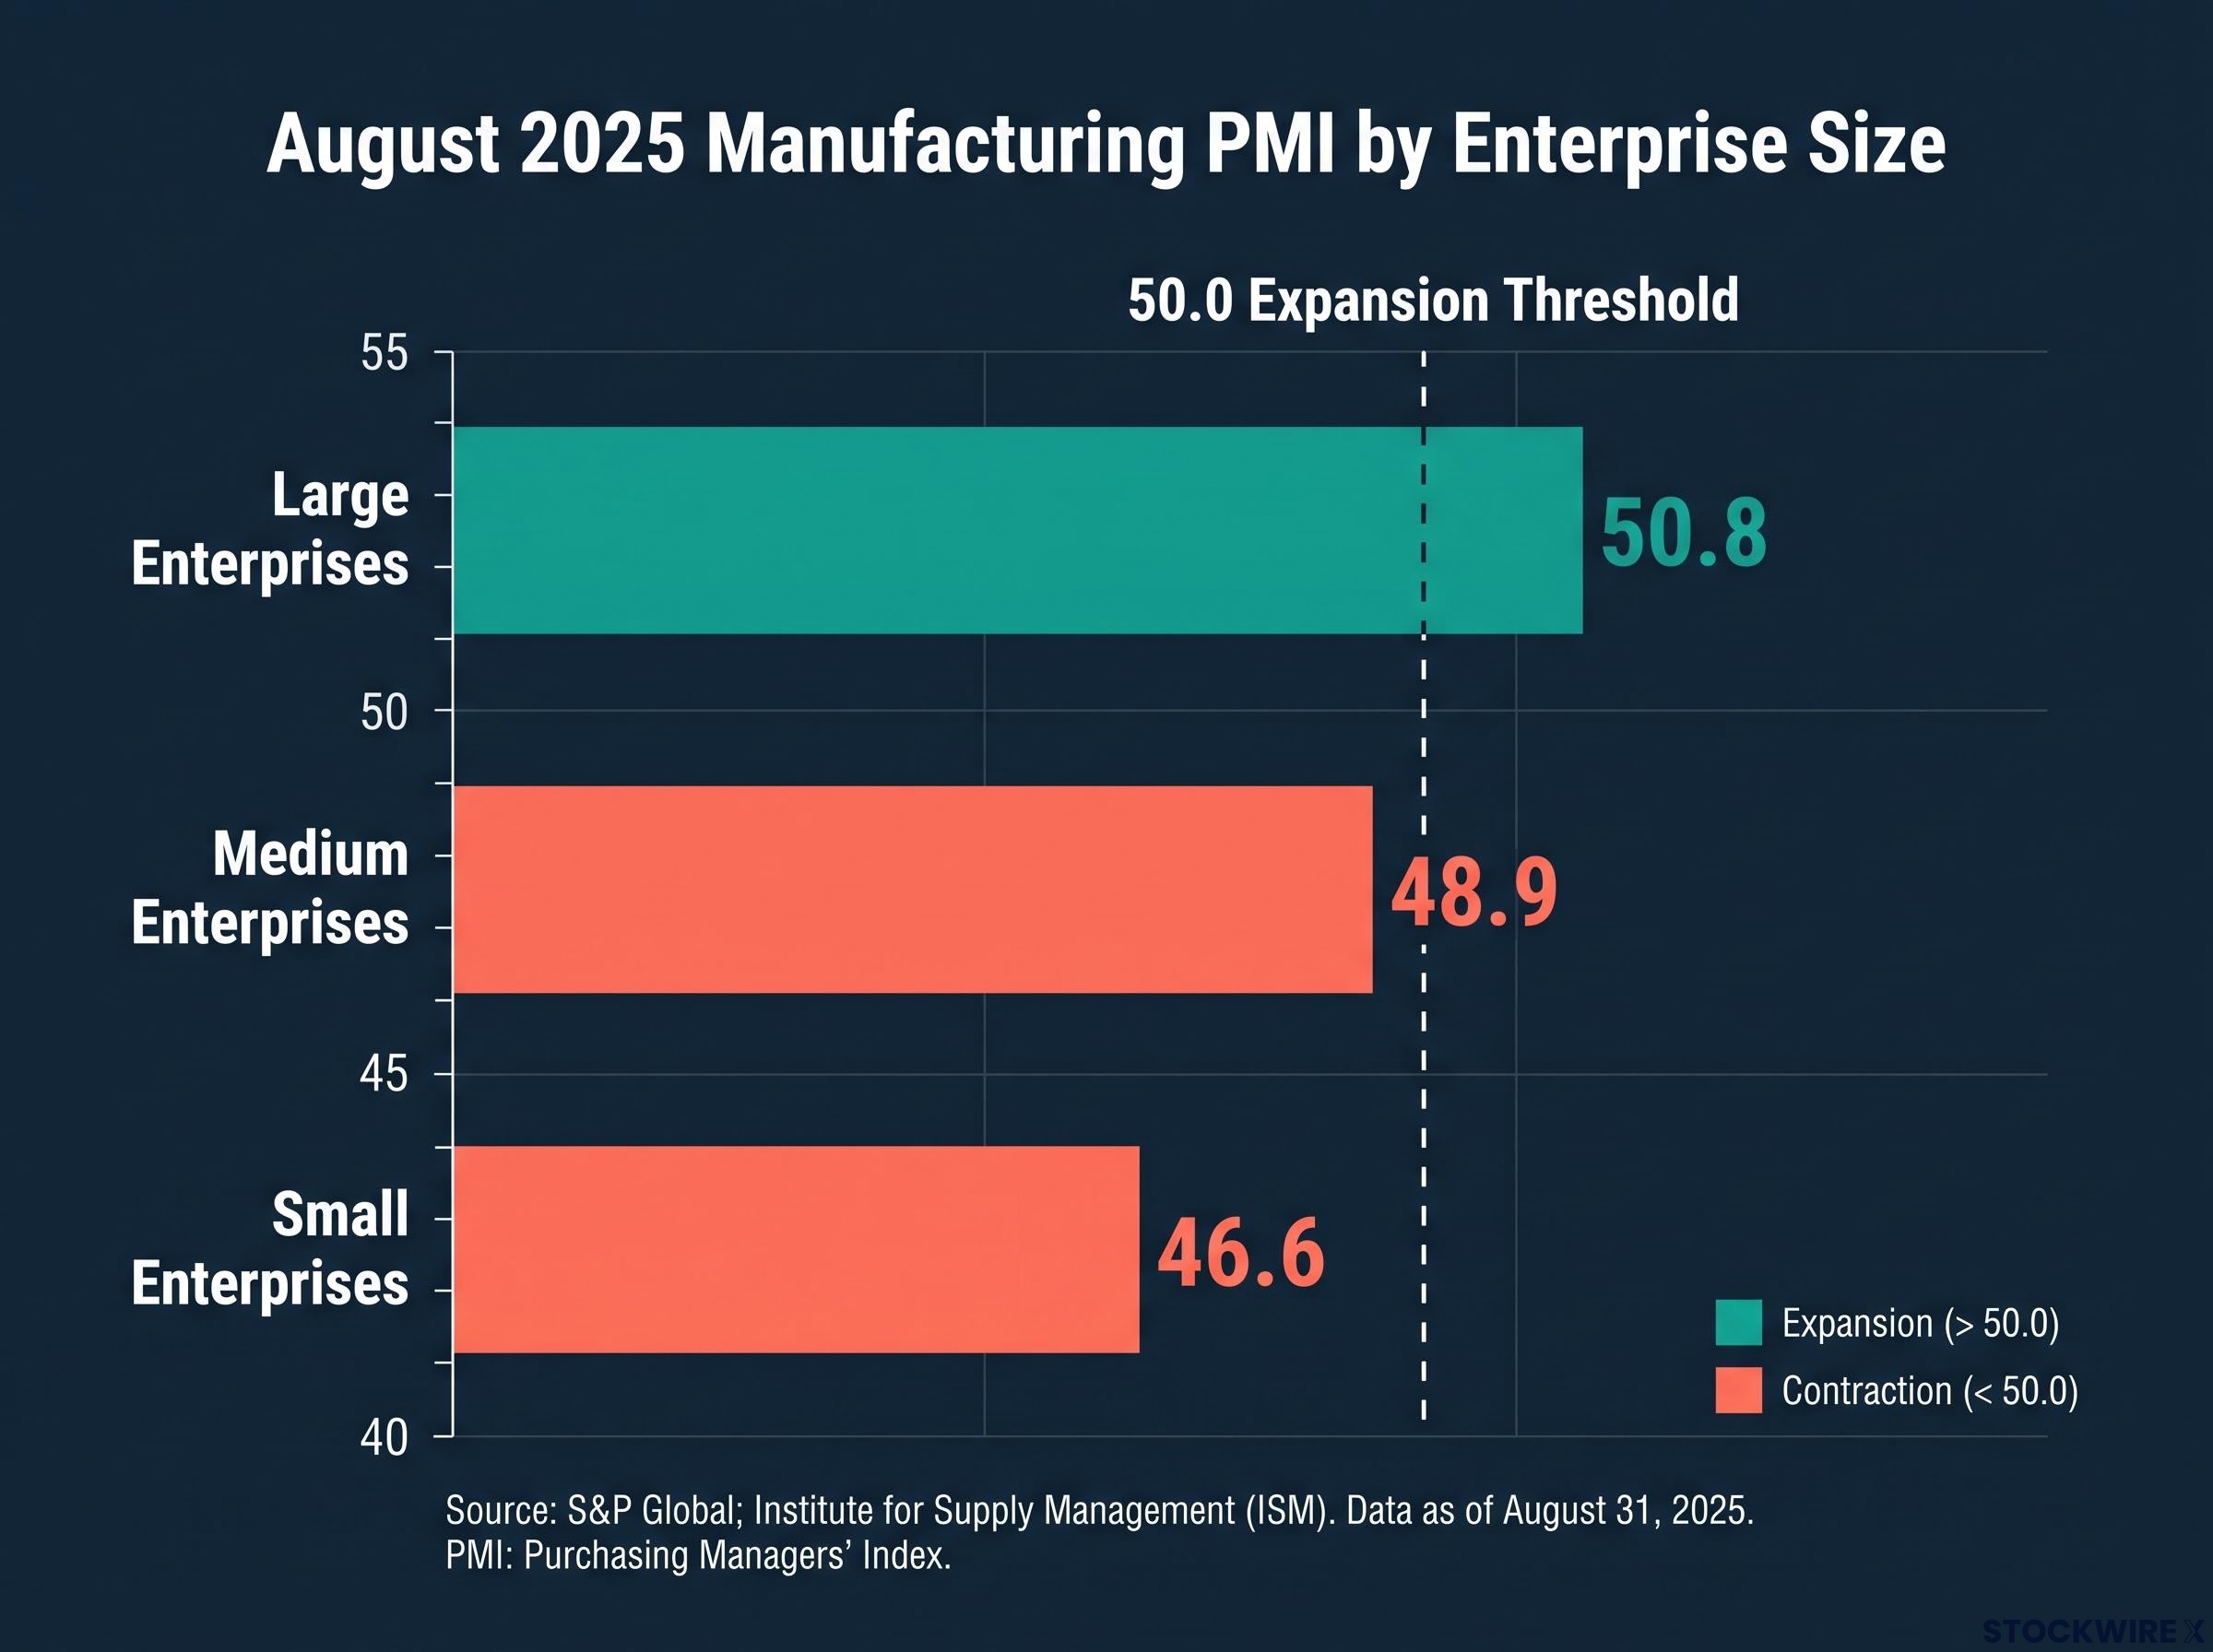
BNY analyst Wee Khoon Chong, reported via FXStreet, noted that large-scale firms returned to expansion territory, a finding consistent with stabilisation in the export-oriented segment of China’s manufacturing base.
| Enterprise tier | August 2025 PMI | July 2025 PMI | Direction |
|---|---|---|---|
| Large enterprises | 50.8 | 50.3 | Expanding, accelerating |
| Medium enterprises | 48.9 | 49.5 | Contracting, worsening |
| Small enterprises | 46.6 | 46.4 | Contracting, marginally less weak |
The private Caixin/S&P Global manufacturing PMI came in at 50.5 for August, the fastest expansion pace in five months. That survey tends to sample smaller, more market-oriented firms, which makes its above-50 reading a more encouraging signal for the private sector than the official data provides.
The enterprise-size split tells you that the firms most connected to global export supply chains are recovering, while the domestic SME base remains under meaningful stress. The “China recovery” is real for some investors and not yet real for others, depending entirely on where their exposure sits.
The K-shaped divergence between China’s technology-export complex and its property-consumption economy has now persisted for six consecutive years, meaning the large-enterprise versus small-enterprise PMI split in August sits within a structural pattern rather than representing a new or temporary phenomenon.
Costs are rising, selling prices are falling, and services are not picking up the slack
The enterprise divergence is the observation. The sub-index data explains the mechanics behind it.
Start with the margin squeeze. The input prices index (a measure of what manufacturers pay for raw materials and components) sat at 53.3 in August, above the 50.0 threshold, meaning costs are rising. The ex-factory prices index (what manufacturers charge for finished goods) printed at 49.1, below 50.0, meaning selling prices are falling. Manufacturers are paying more and receiving less. That compresses margins even where volumes are stable.
China’s demand shortfall was already visible in July 2025 data, when industrial production, retail sales, fixed-asset investment, and employment deteriorated simultaneously, making the August PMI margin squeeze a continuation of a documented multi-month pattern rather than a new signal.
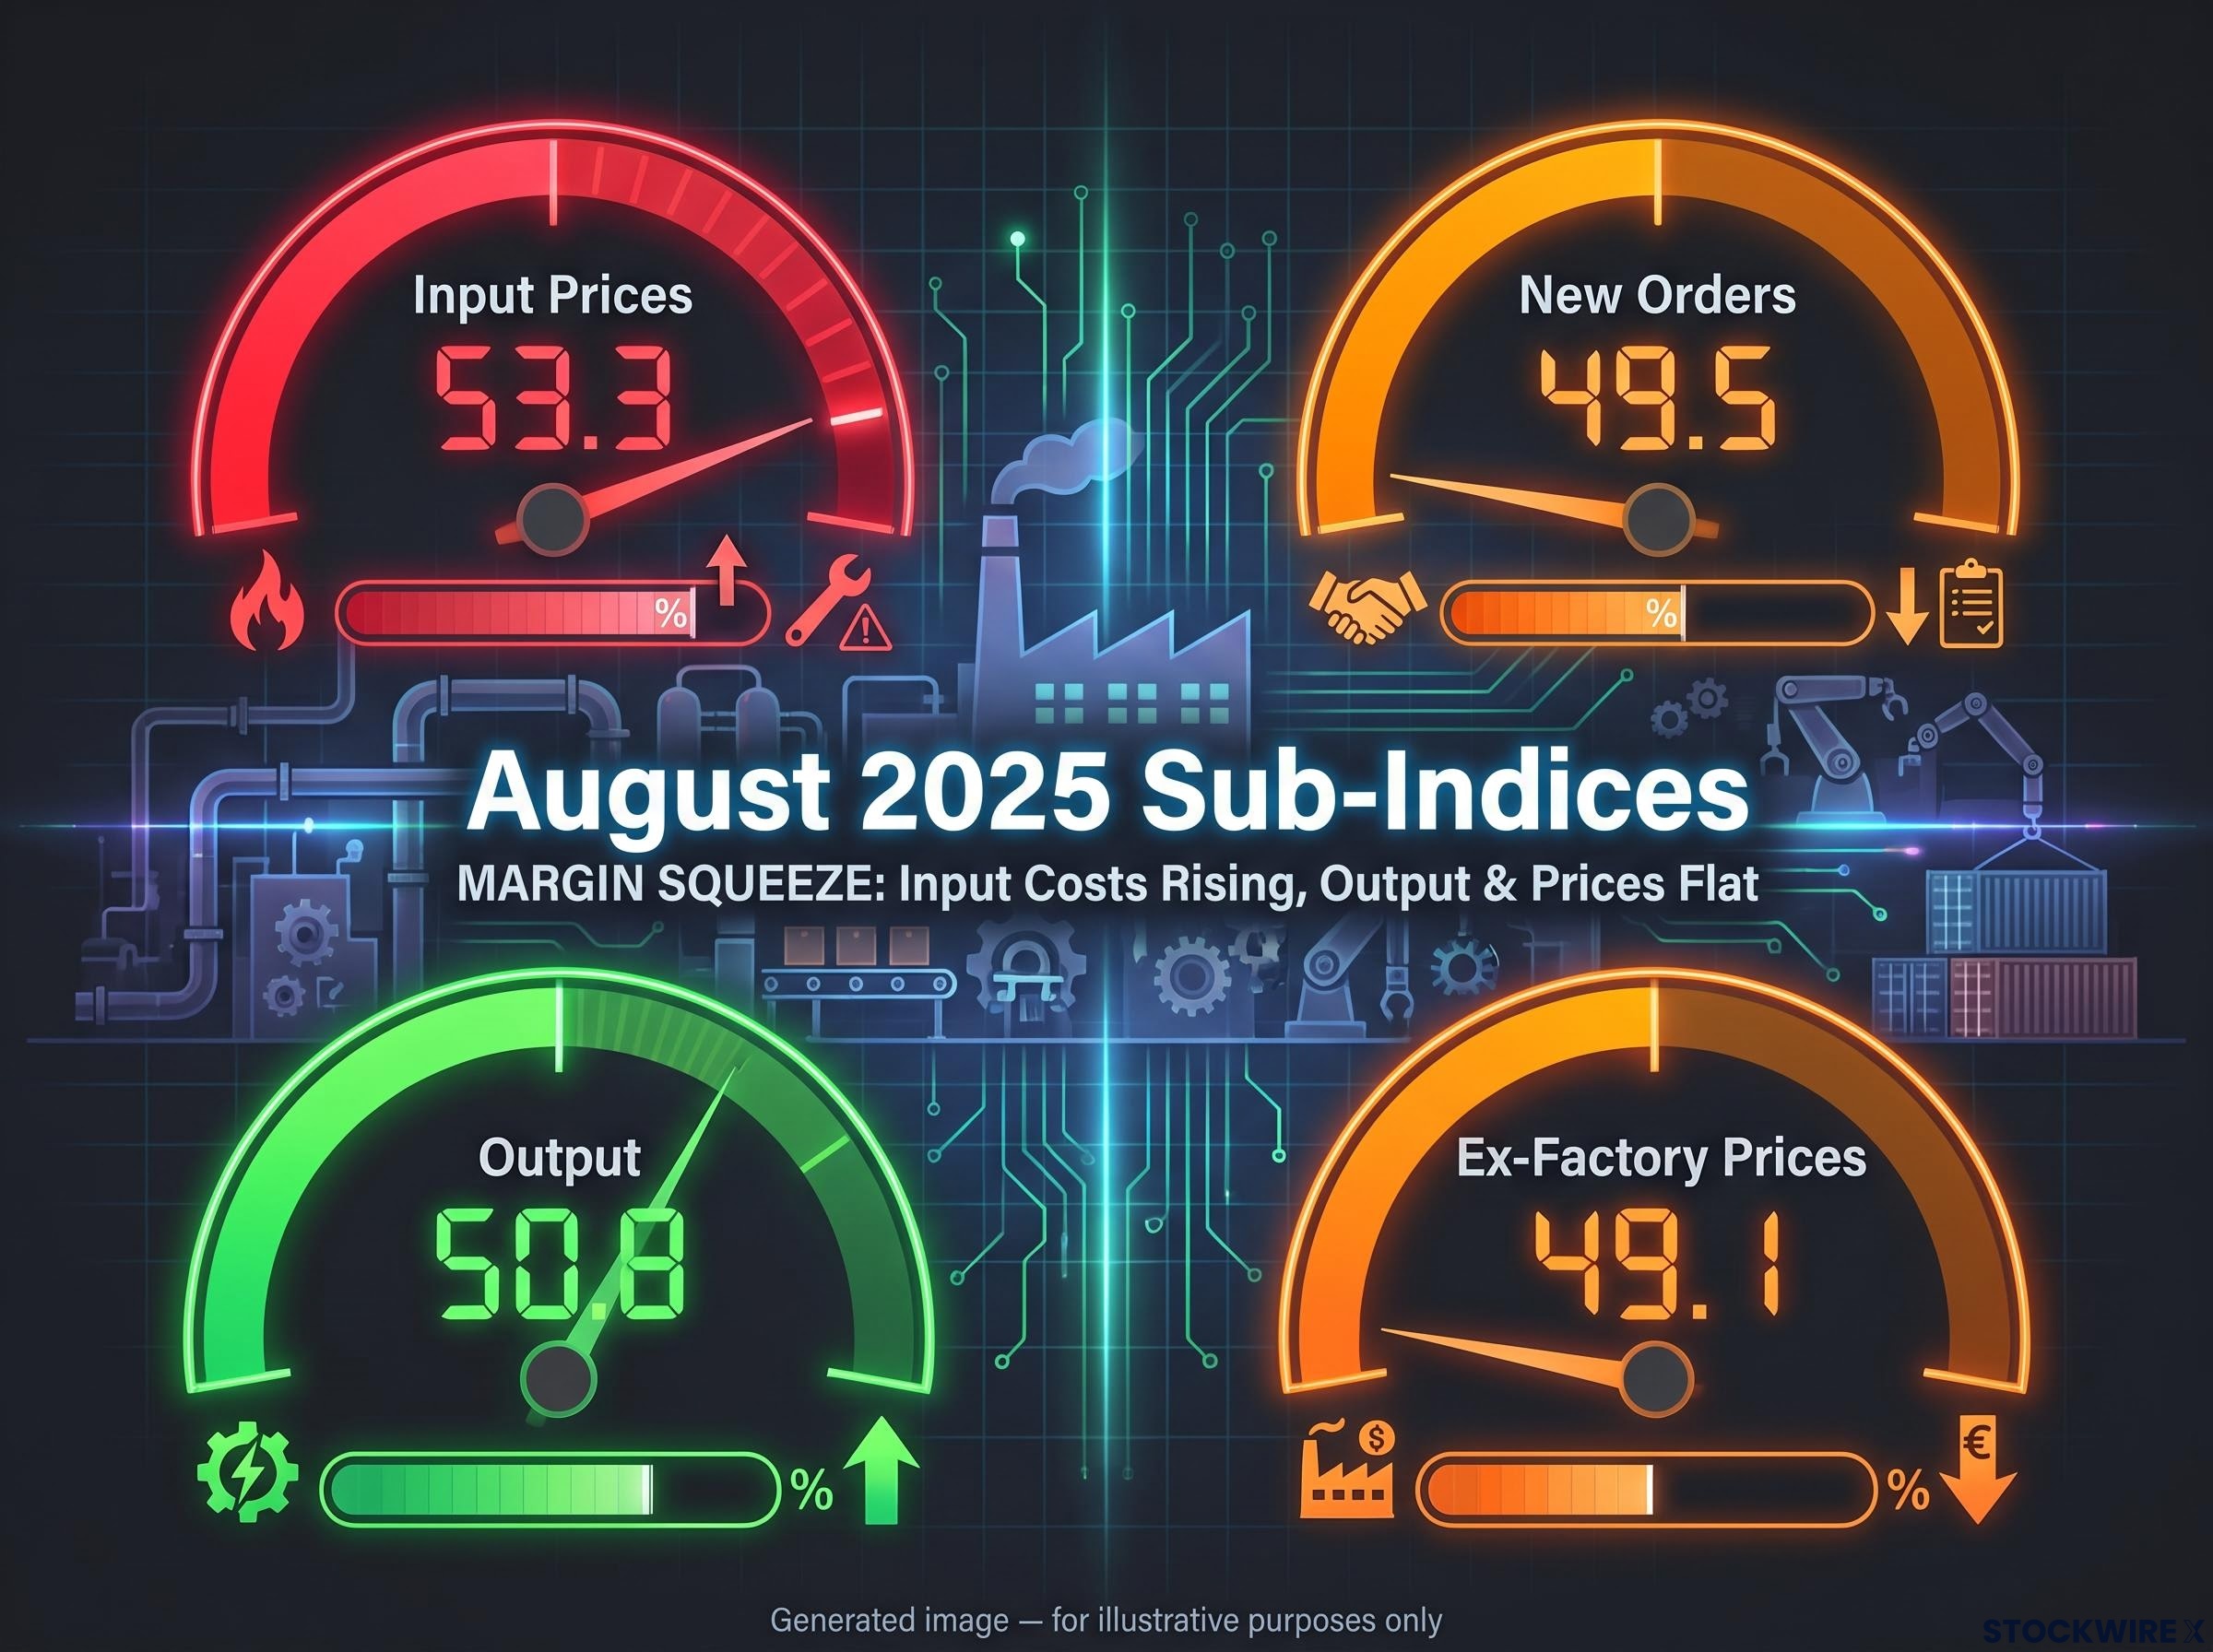
The output and demand picture is mixed:
- Output sub-index: 50.8, indicating production volumes are growing
- New orders sub-index: 49.5, showing demand is still technically contracting, though less sharply
- Input prices index: 53.3, costs rising for manufacturers
- Ex-factory prices index: 49.1, selling prices falling
Production is running, but demand is not pulling hard enough to push the headline above 50, and manufacturers cannot pass rising costs through to buyers. That combination caps earnings recovery even in sectors where activity is stabilising. Improving PMI headlines do not automatically translate into improving corporate profitability in the near term, and that distinction matters if you are sizing positions on the assumption that output growth equals margin growth.
What the services and construction reading adds to the picture
The official non-manufacturing PMI, which covers services and construction, came in at approximately 50.5 for August 2025, with a separate services reading of approximately 50.3, according to data from the National Bureau of Statistics (NBS). Both figures sit just above the expansion threshold.
Technically positive, but the reading reflects a muted domestic impulse rather than a consumer-led offset to manufacturing weakness. The ongoing property-sector overhang continues to weigh on construction and property-adjacent services, constraining the growth rate in ways that a single above-50 print does not fully convey.
One note of transparency: an alternative source reports a sub-50 non-manufacturing reading for the same period. The 50.5 figure is used here on source-consistency grounds, but certainty is limited. Either way, services are not providing the demand engine that would close the gap for struggling manufacturers.
The combination of margin pressure and tepid domestic services demand explains why the headline PMI recovery has been slow and why the data warrants caution rather than a simple read-through to bullish positioning across Chinese equities.
What investors actually do with a two-speed PMI reading
Analysis from the pre-verified original source described a “two-speed economic situation within China,” a characterisation that captures why a single headline number is not sufficient for positioning decisions.
Three distinct investor positions are affected differently by this data.
If you hold Chinese equities: The data supports selective overweight in large-cap, export-linked industrials, the segment where PMI is above 50 and accelerating. It warrants caution on SMEs, domestically oriented cyclicals, and consumer or services names that depend on stronger household demand. The 46.6 small-enterprise reading is the number to sit with before adding broad index exposure.
If you hold commodity or trade-linked positions: The manufacturing output improvement and better new orders provide a modestly supportive backdrop for industrial metals (copper, aluminium, steel) and freight or logistics names. But the sub-50 headline and weak SME segment argue against reading this as the start of a strong demand surge. The signal is incremental, not transformational.
World Bank research on commodity demand confirms that China has remained the single largest consumer of many industrial commodities, which is why sub-indices showing output and new orders moving in opposite directions carry material implications for global metals and freight pricing.
If you hold emerging market funds: China typically accounts for 25-30% of major EM equity benchmarks. This two-speed dynamic flows directly through broad EM allocations. Until PMI is consistently above 50 across enterprise sizes and sectors, neutral-to-cautious positioning on China-heavy EM funds is more consistent with the data than an aggressive overweight.
The Caixin private PMI at 50.5 offers a more optimistic reading, but it samples different enterprise characteristics, typically smaller and more market-oriented firms, compared to the official survey. The two readings are complementary, not interchangeable.
Four conditions would justify a materially stronger shift toward bullish positioning:
- Headline manufacturing PMI sustaining above 50 for several consecutive months, alongside rising new orders and output
- Convergence of enterprise-size PMIs, showing improvement is broad rather than concentrated in large, state-linked firms
- Faster non-manufacturing PMI growth with clearer evidence of stronger services and consumption, indicating domestic demand is becoming the main growth engine
- Policy support, whether fiscal measures, credit easing, or property-sector stabilisation, translating into measurable real-economy improvement
The asymmetry between large and small enterprise PMIs tells you that broad index exposure to China captures both the recovery and the stress simultaneously. Selective positioning in specific sectors or factor tilts is a more disciplined response than a binary in-or-out call.
The same industrial output divergence visible in the PMI enterprise breakdown also runs through China’s sector-level production data, where aggregate industrial growth of 4.5% in July masked cement falling 11.6%, steel dropping 4.1%, and advanced manufacturing in EVs and batteries expanding fast enough to lift the headline.
Reading the next PMI release with clearer eyes
August’s data delivers stabilisation, not recovery confirmation. Large enterprises are expanding at 50.8. Small enterprises remain deep in contraction at 46.6. Services sit just above neutral. Margin pressures persist. The five-month streak below 50 is the trend context that any single print must be measured against.
The September and Q4 PMI releases are the meaningful test. Sustained above-50 readings across enterprise sizes, combined with an easing of the margin squeeze, would materially change the investment case. Until then, 49.4 is a directional signal that warrants selective, patient positioning rather than either panic or aggressive bullish reallocation.
The actionable insight from the August data is not a trade. It is a watch-list: specific conditions to monitor, month by month, that will tell you when the investment case for broader China exposure genuinely strengthens.
This article is for informational purposes only and should not be considered financial advice. Investors should conduct their own research and consult with financial professionals before making investment decisions.