Someone just put $18.8 million in net premium behind a single thesis on Microsoft. Three sweep orders, one strike, one expiration: October 16, 2026, at the $510 level. The entire position was built and shaped in a matter of minutes.
The timing is not arbitrary. The stock has climbed back to its strongest levels in roughly eight months, the broader mega-cap technology complex is breaking higher across the board, and earnings are still weeks away. That combination, a stock in an upswing with a catalyst on the horizon, is precisely the environment where institutional capital tends to show its hand in the options market.
Here is what that hand actually looks like, what the structure communicates about conviction and timing, which price levels matter most, and how to use this information even if you never trade a single options contract.
What $18.8 million in Microsoft calls actually looks like
The position arrived in three pieces, and the sequence matters.
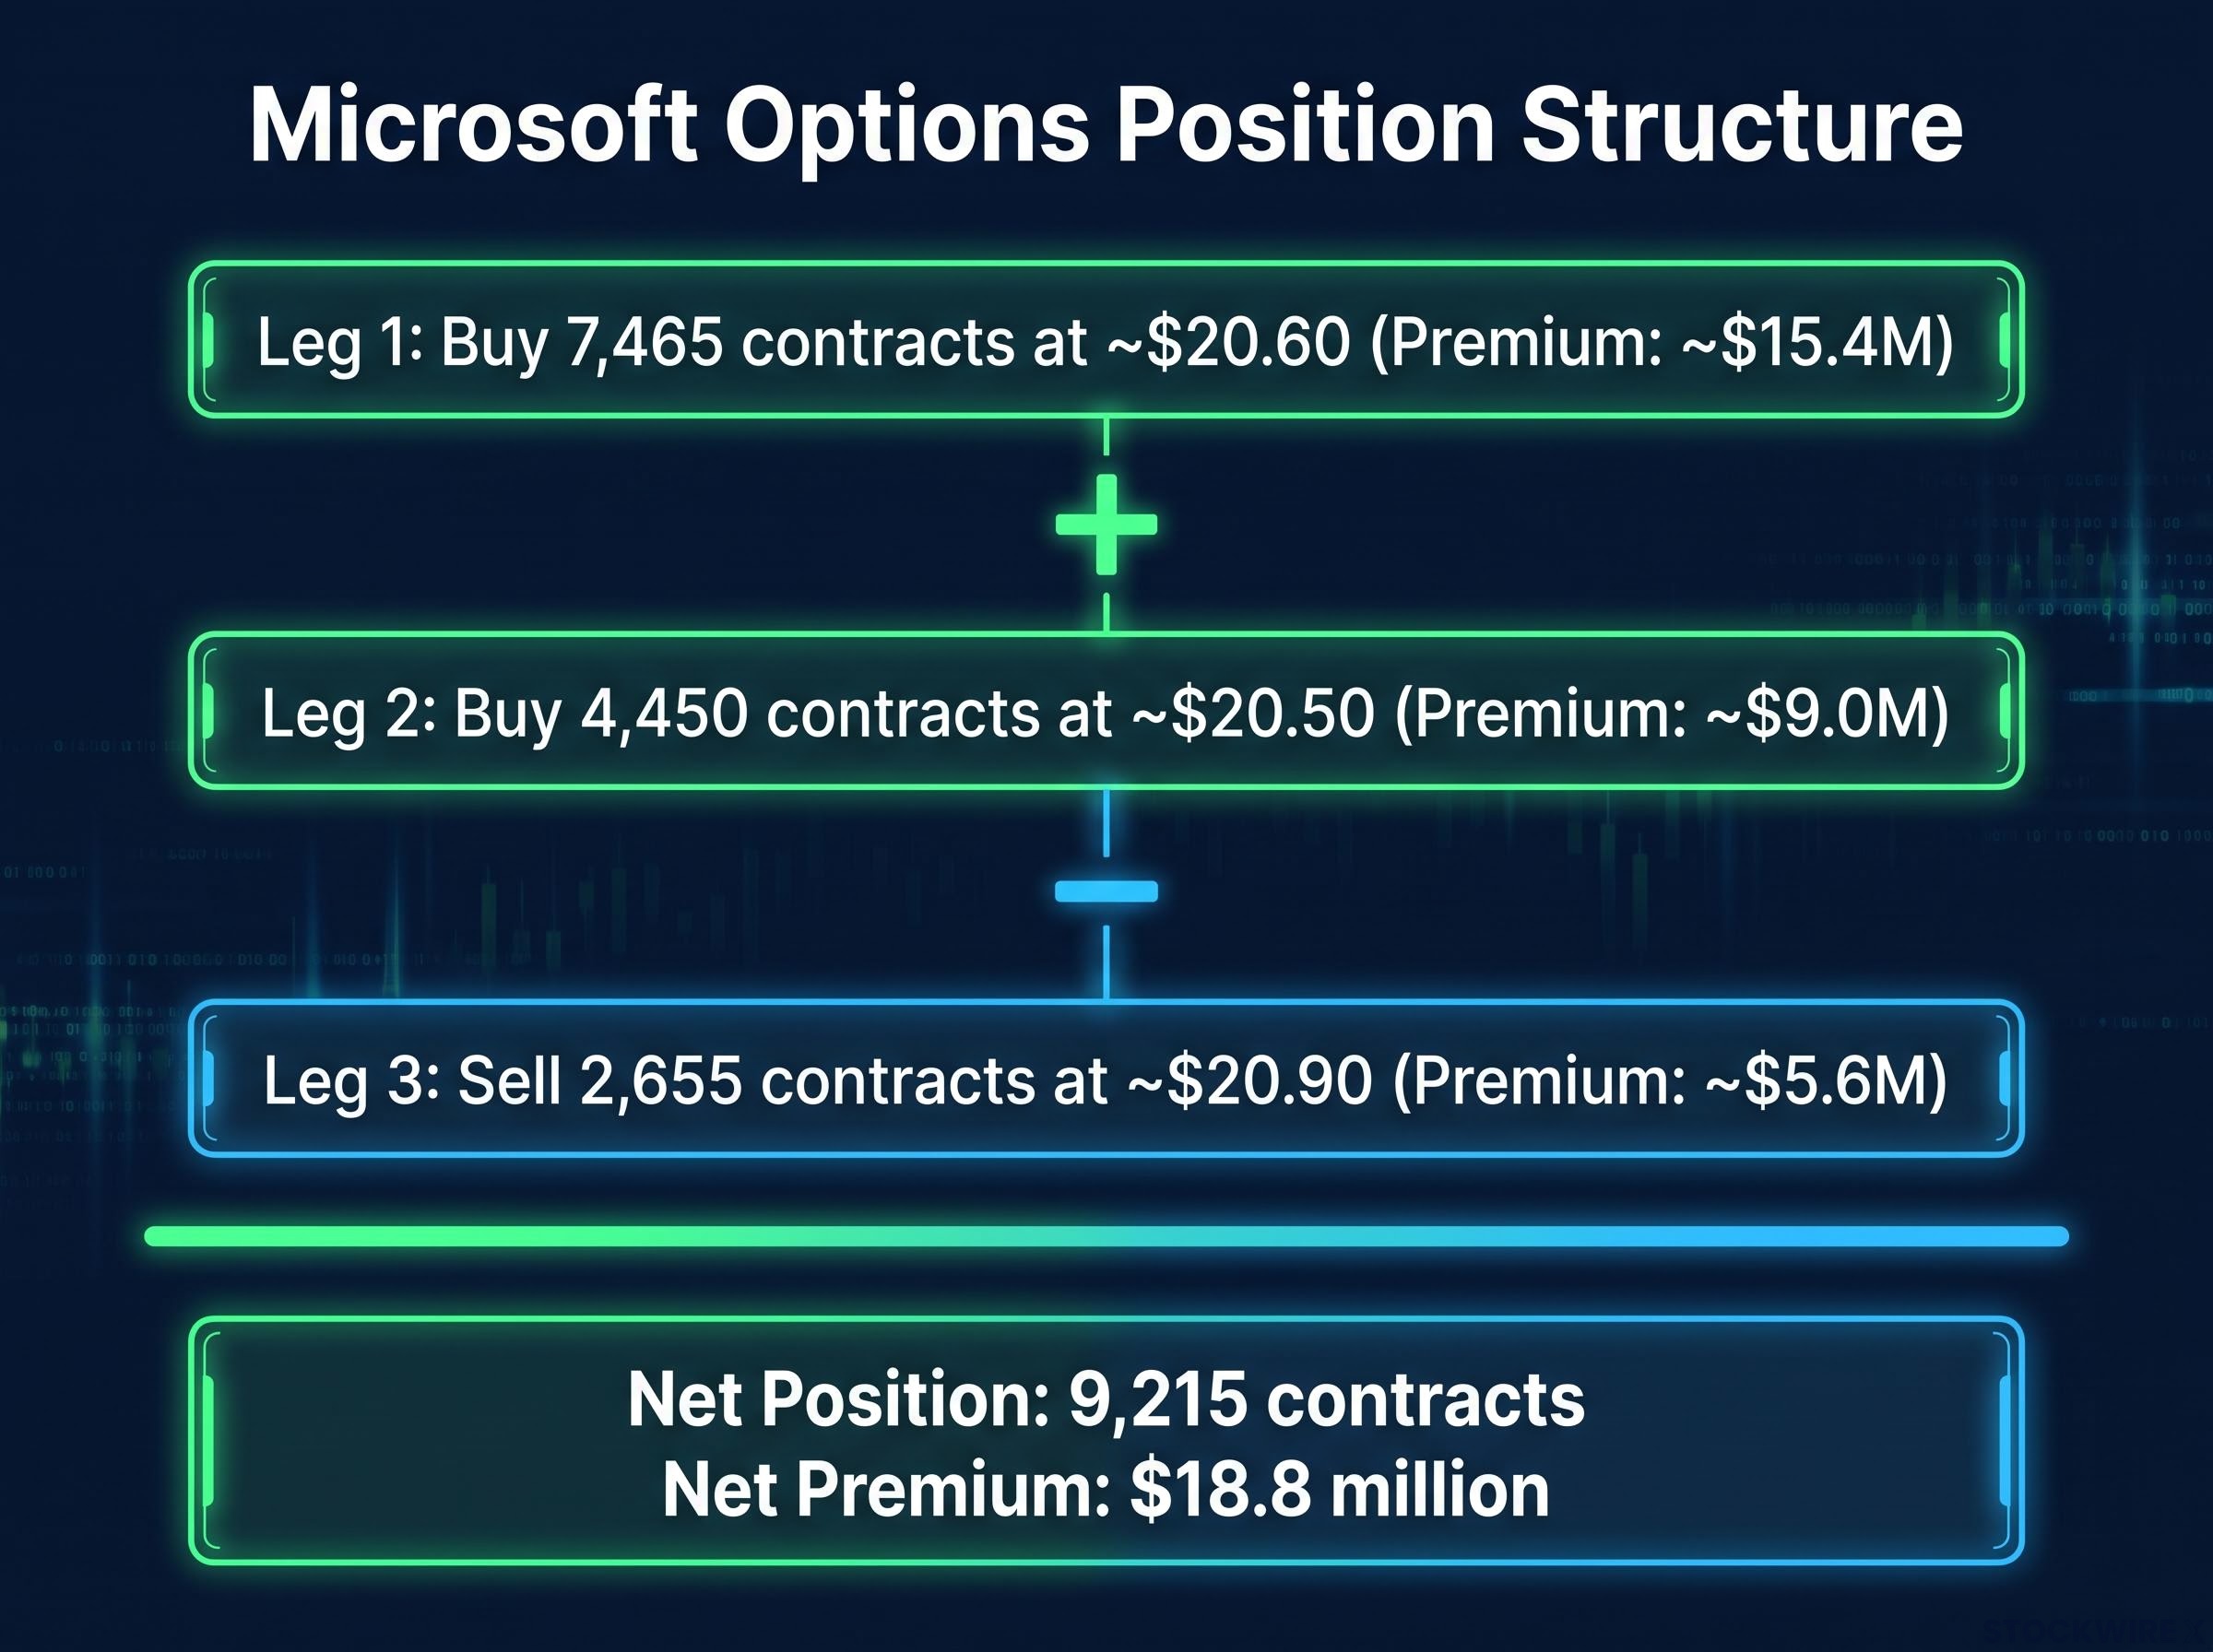
The first order was the largest: 7,465 contracts purchased at approximately $20.60 per contract, totalling roughly $15.4 million in premium. The second buy followed closely, adding 4,450 contracts at approximately $20.50 per contract for another $9 million. Both orders were executed as sweeps at the ask price, meaning the buyer hit the offered price across multiple venues simultaneously rather than waiting for a better fill.
Then came the offsetting sale: 2,655 contracts sold at approximately $20.90 per contract, reducing the gross outlay by roughly $5.6 million.
| Leg | Action | Contracts | Price Per Contract | Total Premium |
|---|---|---|---|---|
| 1 | Buy | 7,465 | ~$20.60 | ~$15.4M |
| 2 | Buy | 4,450 | ~$20.50 | ~$9.0M |
| 3 | Sell | 2,655 | ~$20.90 | ~$5.6M |
When the three legs are combined, the position totals approximately 9,215 contracts and $18.8 million in net premium, representing economic exposure to roughly 921,500 shares of Microsoft. By the time this analysis was conducted, the stock had moved higher since the trade was placed, meaning rebuilding the same position from scratch would have required approximately $22.48 million.
Why sweep execution at the ask matters
A sweep order (an order routed simultaneously across multiple exchanges to get filled immediately) hitting the ask price tells you something specific. The buyer prioritised speed and certainty of execution over price efficiency. Paying the ask, rather than placing a limit order at the midpoint or below, means the buyer believed the window to build this position was closing and that full, immediate fills were worth the premium.
Fragmenting the order across venues is standard institutional practice. It reduces the visible footprint on any single exchange, making the position harder to detect in real time. The buyer wanted the contracts. They did not want the market to know they wanted them until they already had them.
FINRA Rule 2360 reporting thresholds require disclosure of options positions at 200 or more contracts, which puts a 9,215-contract position like this one well inside the category of institutional activity that regulators actively monitor for concentration and coordination.
When big ASX news breaks, our subscribers know first
What the trade structure is designed to communicate
The raw numbers describe a large bet. The structure of the bet describes a deliberate thesis.
Start with the breakeven. Adding approximately $20.40 in net premium per contract to the $510 strike yields a breakeven of approximately $530.50. That figure encodes both the strike selection and the net cost of the position: it is the price Microsoft must reach for the trade to turn profitable, and getting there from the strike requires a move of roughly 4%.
“$530.50 is not just a number. It is the price at which the institutional buyer breaks even, and it encodes both the strike choice and the net premium paid in a single, trackable level.”
The sale leg is where the structure reveals its sophistication. Those 2,655 contracts sold against the larger long position could represent several things:
- The short leg of a call spread, capping upside in exchange for reducing cost
- A covered overwrite against an existing stock position in Microsoft
- A partial adjustment to an earlier long position, trimming exposure at a higher price
Regardless of which interpretation is correct, the sale leg is evidence of intentional payoff shaping. Someone is sculpting a risk profile, not placing a single directional gamble.
Why October 16 and not after earnings
This is perhaps the most telling decision in the entire structure. Microsoft’s next earnings report is estimated for late October 2026, roughly 11-12 days after the October 16 expiration. That gap is deliberate.
By expiring before the earnings print, the position captures any pre-earnings momentum, the tendency for institutional capital to flow into high-conviction names in the weeks before a catalyst, without taking on the binary risk of the earnings reaction itself. Implied volatility (a measure of how much the market expects a stock’s price to move) typically rises into earnings, which would normally increase the value of long calls. But this position expires before that volatility event resolves.
Implied volatility dynamics are central to why this position expires before earnings rather than through them: IV typically expands into a catalyst and collapses immediately after, which would erode the value of long calls even if the stock moves in the right direction.

The 49-day window, the pre-earnings expiry, and the sale leg together communicate a thesis about a measured upward drift, not a lottery ticket on an earnings surprise. That distinction should change how you weight this as a signal.
The technical picture the trade is anchored to
The institutional bet does not exist in a vacuum. It is anchored to five specific price levels that form a coherent map of where the thesis succeeds and where it fails.
Microsoft closed at $513.53 on 28 August 2026, with an intraday high of $517.78. The stock has risen approximately 5% from mid-August to late August, confirming an active upswing rather than a sideways drift.
The MSFT technical structure entering late August 2026 reflects a significant recovery from the mid-year correction, when the stock traded near $349 and the $471-$487 resistance band was the defining ceiling for any potential rebound.
The $510 strike is the primary line in the sand. It is both the strike price and the level the position needs to hold. Above it, the calls remain near at-the-money and time is an ally. Below it, time decay starts working against the position with increasing severity.
A peak of $513.73 reached on 10 August 2026 marks the first confirmation level to watch. Clearing it convincingly on solid volume would indicate that the uptrend is reasserting itself and that the institutional thesis is gaining traction.
Beyond that, $530.50 serves as the breakeven and sentiment checkpoint. Reaching that level would mean the momentum thesis has delivered on its first objective. Beyond the breakeven, the next area of significance is the broader institutional consensus target near $569-$570, which comes into focus once the position moves into profit.
| Price Level | Role | What It Signals |
|---|---|---|
| $510 | Strike / primary support | Holding above preserves the bullish structure |
| $513.73 | Prior swing high (10 Aug) | First confirmation the uptrend is resuming |
| ~$530.50 | Options breakeven | Pre-earnings momentum thesis validated |
| $475-$480 | Deeper support zone | Clean break severely damages the bullish thesis |
| $569-$570 | Institutional consensus target | Next area of interest if breakeven clears |
Where the thesis breaks down
A sustained break below $510 is where the position starts to deteriorate. Time decay, the natural erosion of an option’s value as expiration approaches, begins working against the long calls with increasing force once the stock drops below the strike. If the stock also loses its one-week moving average, which has been acting as a near-term floor and keeping the daily candles tethered to a consistent upward path, the weight of evidence shifts toward a trend reversal rather than a temporary dip.
The $475-$480 zone represents the more serious stress test, where the one-month moving average lines up with pivot lows left behind after a previous gap. A sustained move through that cluster of support would undermine the bullish case substantially, regardless of how much time remains on the options. Knowing where the thesis breaks down is as useful as knowing where it succeeds: the $475-$480 zone is the level at which anyone monitoring this trade should reassess whether the institutional premise is still intact.
How to use this signal if you are not trading 9,000 contracts
The size and structure of this trade are not replicable for most investors. Trying to mirror it at a fraction of the scale would miss the point. The value is not in the position itself; it is in what the position communicates.
- Active options traders: Treat the trade as a signal, not a script. Watching price behaviour around $510, $513.73, and $530.50 gives you a clear framework for shorter-dated, smaller-scale trades. A more modest call or call-spread structure into mid-October can express a similar directional view with defined risk, without requiring eight-figure capital.
- Long-term investors: Use the trade as a sentiment gauge. It tells you that at least one large institutional participant was willing to put eight-figure premium behind the view that Microsoft’s trend remains intact into earnings. That should not override your own fundamental work, but it belongs in the mosaic of signals about institutional confidence.
The fundamental valuation case for Microsoft at current levels rests on a Morningstar wide moat rating, a $600 fair value estimate against a mid-year trading price near $382, and a net cash position of $51 billion, factors that inform how institutional capital weights the risk-reward of a pre-earnings momentum structure versus simply holding the stock outright.
- Students of market structure: This is a live case study in how strike selection reflects technical levels, how expiration choice encodes a view on timing and catalysts, and how execution style reveals urgency and conviction. Tracking how price behaves against the outlined levels over the coming weeks is one of the best ways to learn how institutional positioning interacts with technical structure.
“The levels are $510, $513.73, $530.50, and $569-$570. The clock runs to October 16. The trade either works inside that window or it does not.”
Over the 49-day horizon covered by this position, the options market’s implied price range for Microsoft stretches out to roughly $555, indicating that the market assigns a plausible probability to the breakeven being reached, even though it is far from a certainty.
What this trade tells you about institutional conviction right now
Three dimensions make this position worth tracking, and they are worth restating not as a summary, but as a single coherent signal.
The size is real: $18.8 million in net premium is not an accidental print or an algorithmic artefact. The structure is intentional: a three-leg design with a sale component that shapes the payoff profile rather than simply maximising directional exposure. And the timing is specific: a 49-day window sized to harvest any pre-earnings price appreciation without carrying the position into the announcement itself, where a binary reaction could erase the gains.
Microsoft’s Q4 2026 earnings results, a 10% EPS beat on $90 billion in revenue driven by 32% Intelligent Cloud growth, established the fundamental backdrop against which the current options thesis is playing out, confirming that the pre-earnings momentum trade is anchored to a business that has already demonstrated execution.
Together, these three elements communicate something that a headline dollar figure alone cannot. This is not noise in the options tape. It is a deliberate, time-bounded thesis from someone who sized and shaped the position with discipline, and that combination of sweep execution, multi-leg structure, and pre-earnings timing is the signal worth paying attention to.
Does it mean Microsoft will reach $530.50 by October 16? No. Institutional positioning can be wrong. It can be part of a larger hedge the market cannot see. It should always be weighed against your own fundamental and technical work, not treated as a green light.
What it does mean is that one sophisticated institutional actor surveyed this particular market setup, a stock that has recovered to levels not seen since late 2025 while the wider large-cap technology sector pushes higher and a major earnings catalyst looms, and concluded that the risk-reward of a structured pre-earnings momentum bet justified an eight-figure commitment. That conviction, expressed through structure rather than speculation, is worth monitoring.
October 16, 2026 is the resolution date. The breakeven is $530.50. The required advance is approximately 4% from the $510 strike. Anyone following this trade now has a clear scorecard and a defined window in which it either works or it does not.
This article is for informational purposes only and should not be considered financial advice. Investors should conduct their own research and consult with financial professionals before making investment decisions. Past performance does not guarantee future results. These forward-looking observations about Microsoft’s price trajectory are speculative and subject to change based on market developments and company performance.