The dollar moved sharply on the last Federal Reserve announcement, and every headline explained it the same way: “the Fed raised rates.” That sentence is technically accurate and practically useless. It leaves out the mechanics that determine how much the dollar moves, in which direction, and for how long.
Fed decisions sit upstream of almost everything in your financial life. Mortgage rates, import prices, the competitiveness of US exports, and the yield on your savings account all trace back to a committee vote in Washington. Yet the transmission chain linking that vote to a shift in the dollar’s global value is rarely laid out in terms that a non-economist can actually use.
Here is what this piece gives you: a working model for interpreting any Fed announcement and understanding which way it should push the dollar, and why. It covers who makes the decisions, how each of the Fed’s three primary tools operates, and what the hawkish/dovish shorthand actually means in currency terms. By the end, you will have a three-question framework you can bring to every Federal Open Market Committee (FOMC) meeting from here forward.
The Fed’s mandate and the committee that sets policy
The Federal Reserve exists because Congress gave it a job. That statutory mandate has three components: promote maximum employment, maintain stable prices, and encourage moderate long-term interest rates. In practice, the first two dominate the conversation. Market participants, financial media, and the Fed itself typically frame policy debates around employment and inflation, which is why you will hear the phrase “dual mandate” far more often than “triple mandate.” The third goal, moderate long-term interest rates, is real but rarely drives headlines.
Understanding the mandate matters because it tells you what the Fed is optimising for at any given moment. When inflation is running hot, the mandate pulls the committee toward tightening. When employment weakens, it pulls toward easing. The tension between those two objectives is the engine of almost every policy debate you will encounter.
The Federal Reserve monetary policy framework establishes maximum employment and stable prices as the two dominant policy objectives, with the balance between them determining whether the committee leans toward tightening or easing at any given meeting.
Who sits at the table, and who gets a vote
The FOMC is the body that makes the rate decisions. Its voting membership totals 12 at any point, assembled from three distinct groups:
- Seven members of the Board of Governors, appointed by the President and confirmed by the Senate
- The president of the Federal Reserve Bank of New York, who holds a permanent voting seat
- Four rotating seats, filled by presidents drawn from the remaining 11 regional Federal Reserve Banks (there are 12 Federal Reserve Banks in total)
Non-voting regional presidents still attend every meeting and participate fully in the discussion. Their regional economic perspectives shape the debate even when they do not cast a formal vote.
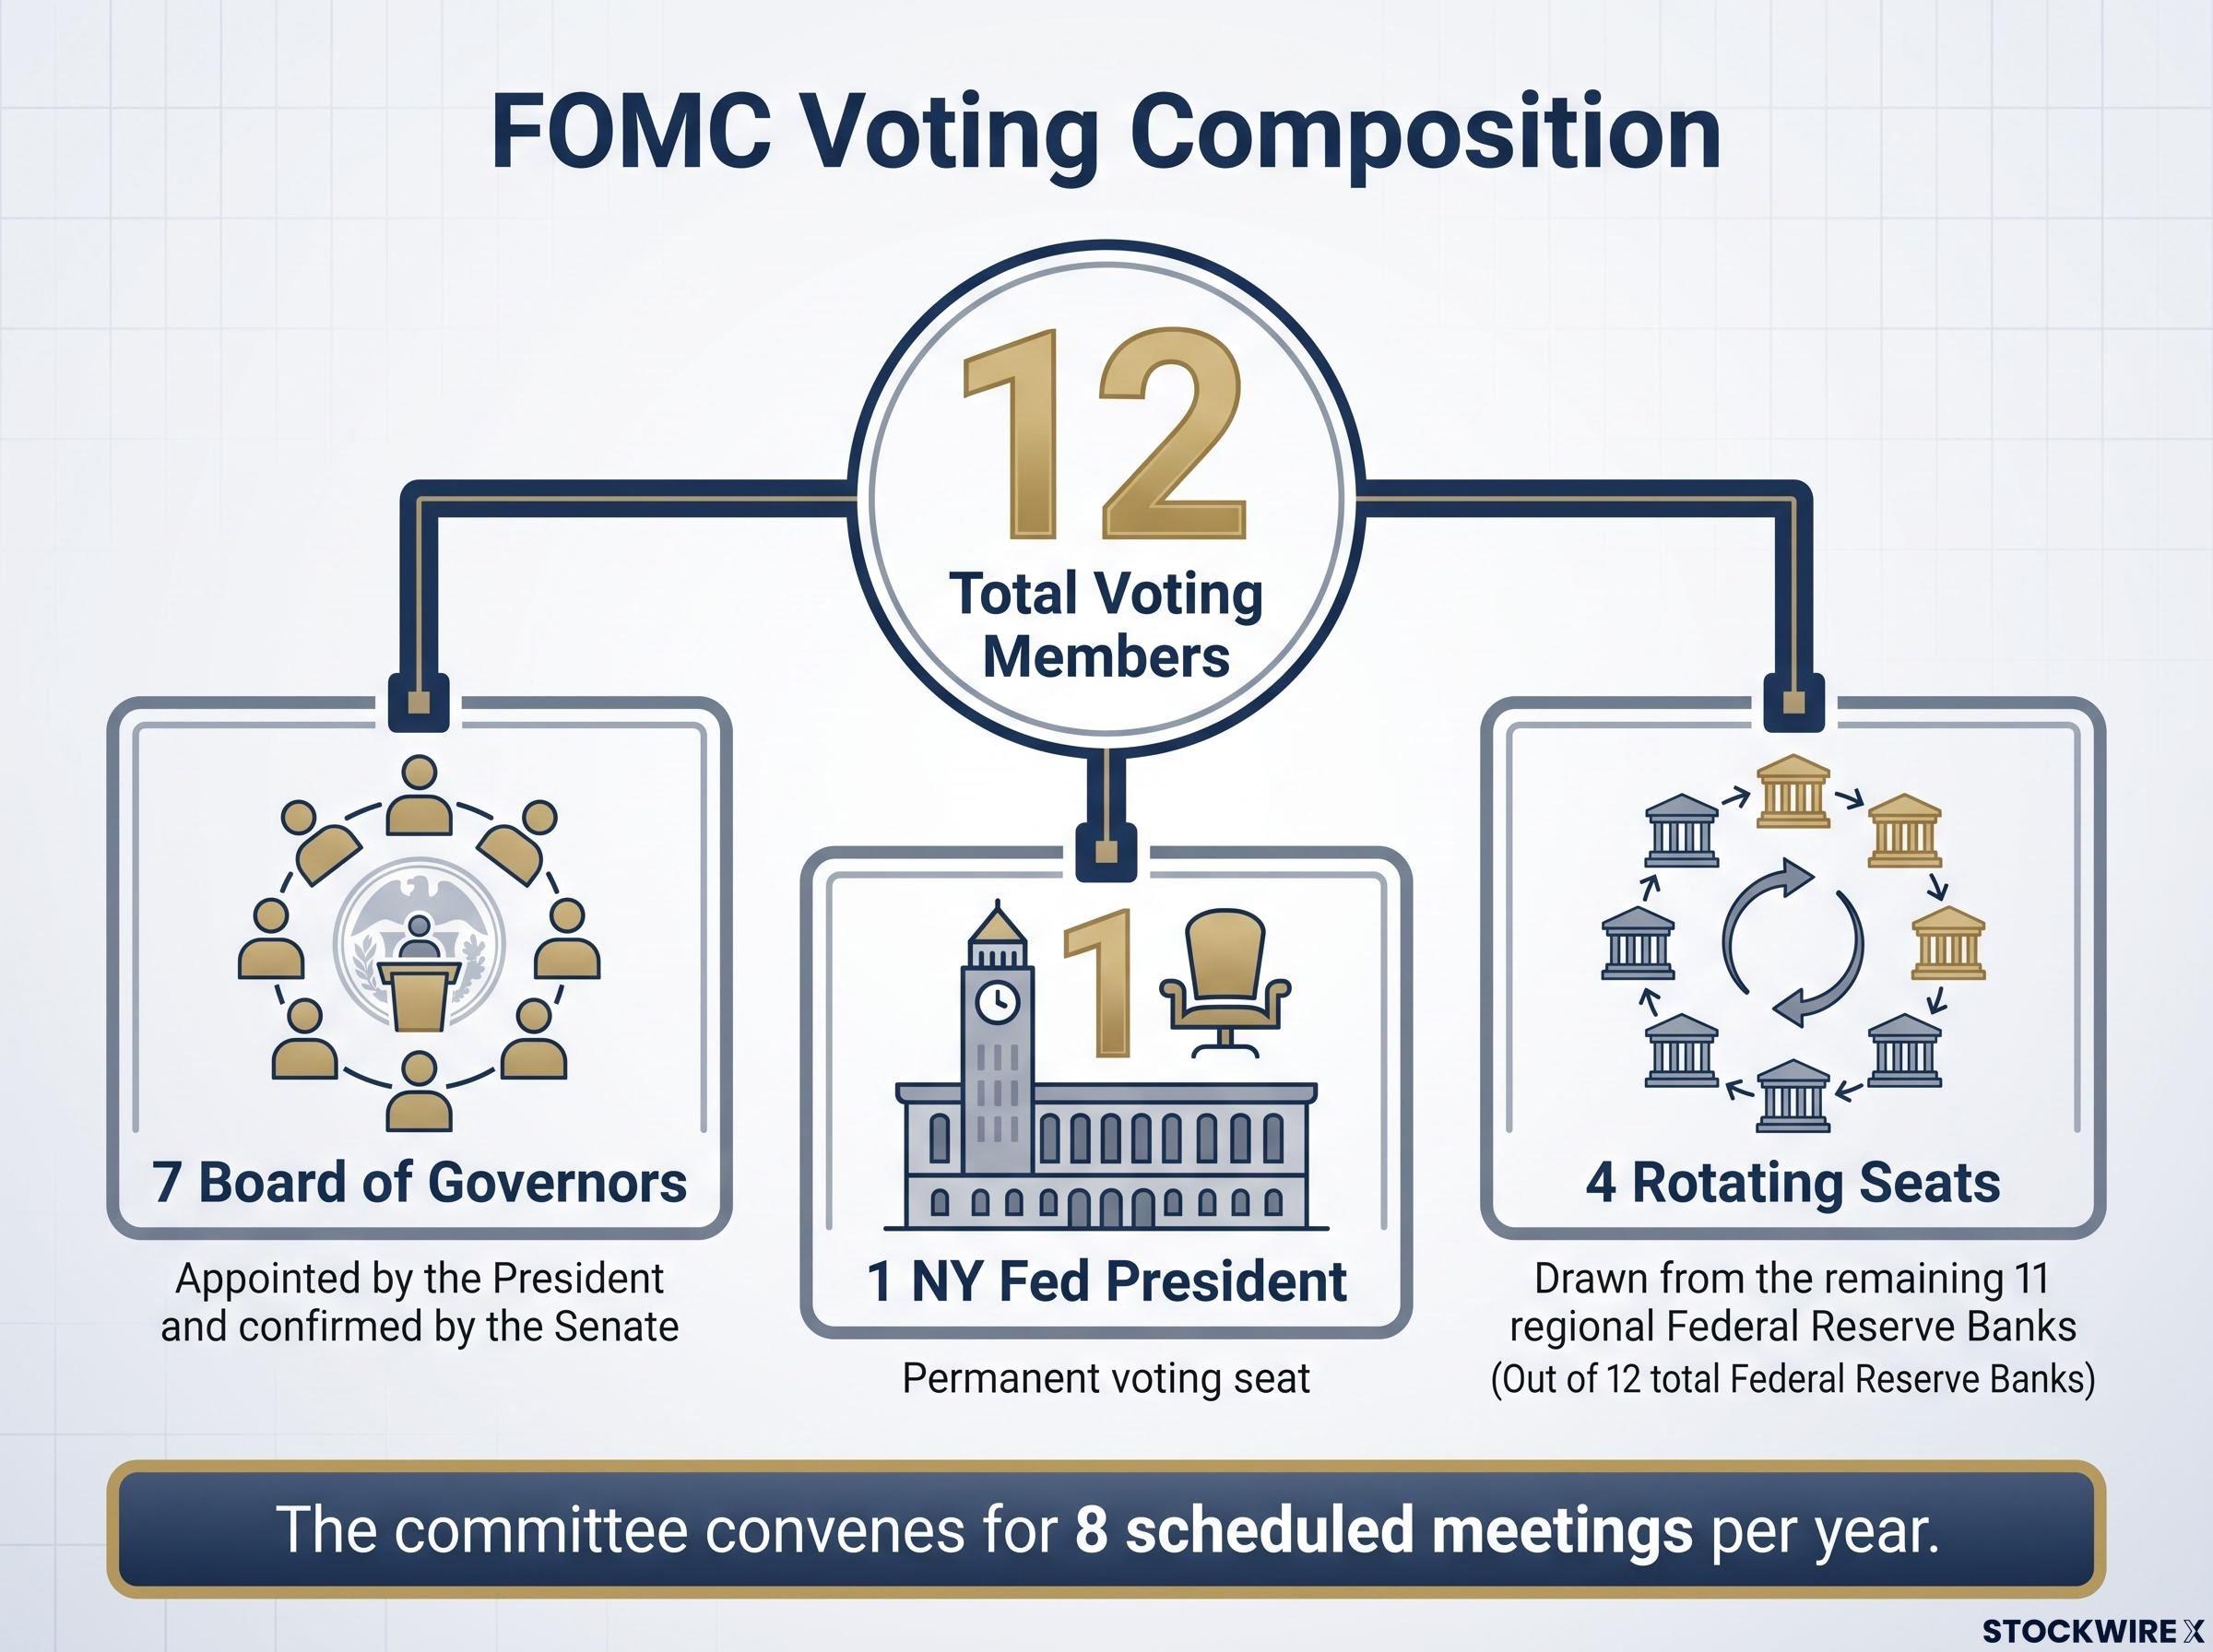
This rotating structure is a deliberate design choice, not a technicality. It means the voting composition shifts each year, which is why the same policy question can draw a different vote count depending on which regional presidents currently hold seats. For you, the practical takeaway is straightforward: the committee convenes for eight scheduled meetings per year, and those gatherings produce the decisions that move markets, currencies, and borrowing costs. Those eight dates are your calendar for Fed-watching.
When big ASX news breaks, our subscribers know first
How interest rate decisions move the dollar
The federal funds rate is the Fed’s primary instrument. It is the interest rate at which banks lend reserves to each other overnight, and when the FOMC raises or lowers it, the effects ripple outward through every corner of the financial system. The transmission to the dollar follows a specific chain, and understanding each link tells you why some rate hikes produce large dollar moves while others barely register.
The federal funds rate sits at the top of a transmission chain that runs through bank funding costs, mortgage rates, deposit yields, and ultimately inflation; central bank rate mechanics govern overnight interbank lending but reshape every asset class in a portfolio through that downstream sequence.
The sequence works like this:
- The Fed raises the federal funds rate, which pushes up yields on US dollar-denominated assets across the maturity spectrum.
- The yield differential between US assets and foreign assets widens, making dollar-denominated bonds and deposits more attractive to global investors seeking higher returns.
- Foreign capital flows into dollar assets, and those investors must buy dollars to make those purchases, which bids up the dollar’s value on currency markets.
That three-step chain is the textbook version. It works, but it is incomplete.
Why real yields, not headline rates, drive sustained currency moves
What moves currencies over sustained periods is not the nominal interest rate but the real yield: the return you earn after accounting for inflation. You can approximate this as the nominal rate minus expected inflation. One market-based measure of expected inflation is the breakeven rate implied by Treasury Inflation-Protected Securities (TIPS), which are US government bonds whose principal adjusts with inflation.
The real yield distinction is the single most important concept separating informed Fed-watching from headline reading. A rate hike that markets view as “behind the curve” on inflation raises the nominal rate without necessarily improving real yields. If inflation expectations are rising just as fast as rates, the real return to holding dollar assets has not improved, and the dollar may barely move despite a headline rate increase.
Forward guidance matters here too. The expected path of rates, not just the current setting, is itself a policy tool. If the Fed signals “higher for longer” at a press conference, the dollar can strengthen immediately, even with no formal rate change that day. Markets are pricing the anticipated path, not just the present number. For you, this means that watching only the rate decision itself misses most of the signal. The press conference, the dot plot (the chart showing each FOMC member’s rate projection), and the statement language often tell you more about where the dollar is headed than the number in the headline.
Forward guidance as policy is a relatively recent but now dominant transmission channel: the Fed can move markets, currencies, and yield curves through statement language and press conference tone without changing the rate number at all, which is why the communication surrounding each FOMC meeting carries as much analytical weight as the decision itself.
How the Fed’s bond-buying programme shapes dollar strength
Quantitative easing (QE) is the Fed’s second major tool, and it operates through the balance sheet rather than the interest rate. When the Fed conducts QE, it purchases high-quality bonds, primarily US Treasuries and mortgage-backed securities (MBS), from financial institutions. To fund those purchases, the Fed creates bank reserves, expanding its balance sheet and injecting liquidity into the financial system. This is not a one-for-one expansion of the broader money supply; banks are not reserve-constrained in the way that simple descriptions often imply. The transmission to lending and broader monetary conditions is indirect.
The scale of these interventions has been extraordinary. Three balance sheet eras tell the story:
| Era | Approximate balance sheet size | Associated event or programme |
|---|---|---|
| Pre-2008 baseline | Below $1 trillion | Normal operations before crisis intervention |
| Post-Global Financial Crisis peak | Above $4 trillion | QE programmes following the 2008 GFC |
| Post-COVID peak | Near $9 trillion | QE expansion during 2020-2022 pandemic response |
A balance sheet that expanded from under $1 trillion to near $9 trillion over roughly fifteen years represents an intervention without historical precedent. The dollar impact, however, is more conditional than most summaries suggest. All else equal, QE leans against the dollar by pushing down yields and expanding the supply of liquid dollar assets. But “all else equal” rarely applies in the moments when QE is actually deployed.
The relationship breaks down because of three factors that can override the default:
- Safe-haven demand: In major crises, global capital flows into dollars regardless of yield, because the dollar remains the world’s primary reserve currency.
- Relative US economic strength: If the US economy recovers faster than peers, capital follows growth, supporting the dollar even while QE suppresses yields.
- Forward guidance about the exit path: If markets believe QE will be wound down quickly, they price the tightening ahead of time, limiting the currency-weakening effect.
For you, the practical implication is that seeing a QE announcement and automatically concluding “dollar down” is an oversimplification. It will produce wrong predictions in the scenarios that matter most, specifically in crisis conditions when safe-haven dynamics can dominate any yield-compression effect.
Balance sheet contraction and its limits as a dollar driver
Quantitative tightening (QT) is the mirror image of QE, but it carries its own distinct transmission dynamics. The mechanics work in two forms:
- Passive QT: Rather than actively selling assets, the Fed allows its bond holdings to roll off naturally: when Treasuries and MBS reach maturity, the proceeds are not put back to work in new purchases, causing the balance sheet to shrink gradually without direct market intervention.
- Active QT: The Fed sells securities directly into the market, accelerating the balance sheet reduction. This approach has a larger and more immediate impact on market conditions because it adds supply to the bond market rather than simply waiting for maturities.
Passive QT has been the standard first approach, and the Fed’s balance sheet normalisation efforts have continued as an ongoing post-2022 process extending into at least 2026.
By reducing Fed demand for Treasuries and MBS, QT puts upward pressure on longer-term yields. Private buyers must be attracted to absorb the supply the Fed is no longer purchasing, and they demand higher yields to do so. This amplifies the rate-hike channel: QT pushes up the same longer-term yields that rate hikes target from the short end, creating a second supportive force for the dollar, particularly when peer central banks are simultaneously easing.
The conditional most readers have not considered: very aggressive QT that tightens financial conditions too sharply can trigger market pricing of earlier-than-expected rate cuts. When that happens, the initial dollar-positive effect reverses, even while the Fed’s nominal policy stance remains restrictive. The market is not reacting to what the Fed is doing today; it is reacting to what it expects the Fed will be forced to do tomorrow.
For you, this means QT adds a second supportive channel for the dollar beyond rate hikes, but it also introduces a ceiling. If the market concludes QT has gone too far and a policy reversal is coming, the dollar positive can rapidly unwind. That is exactly the dynamic to watch during any sustained balance sheet reduction phase, and it is why the QT pace deserves as much attention as the headline rate decision.
The Federal Reserve H.4.1 balance sheet release is the primary official source for tracking the pace and direction of balance sheet change week by week, giving you the data needed to monitor whether QT is accelerating, decelerating, or approaching a pause.
Reading the hawk/dove spectrum to anticipate dollar moves before they happen
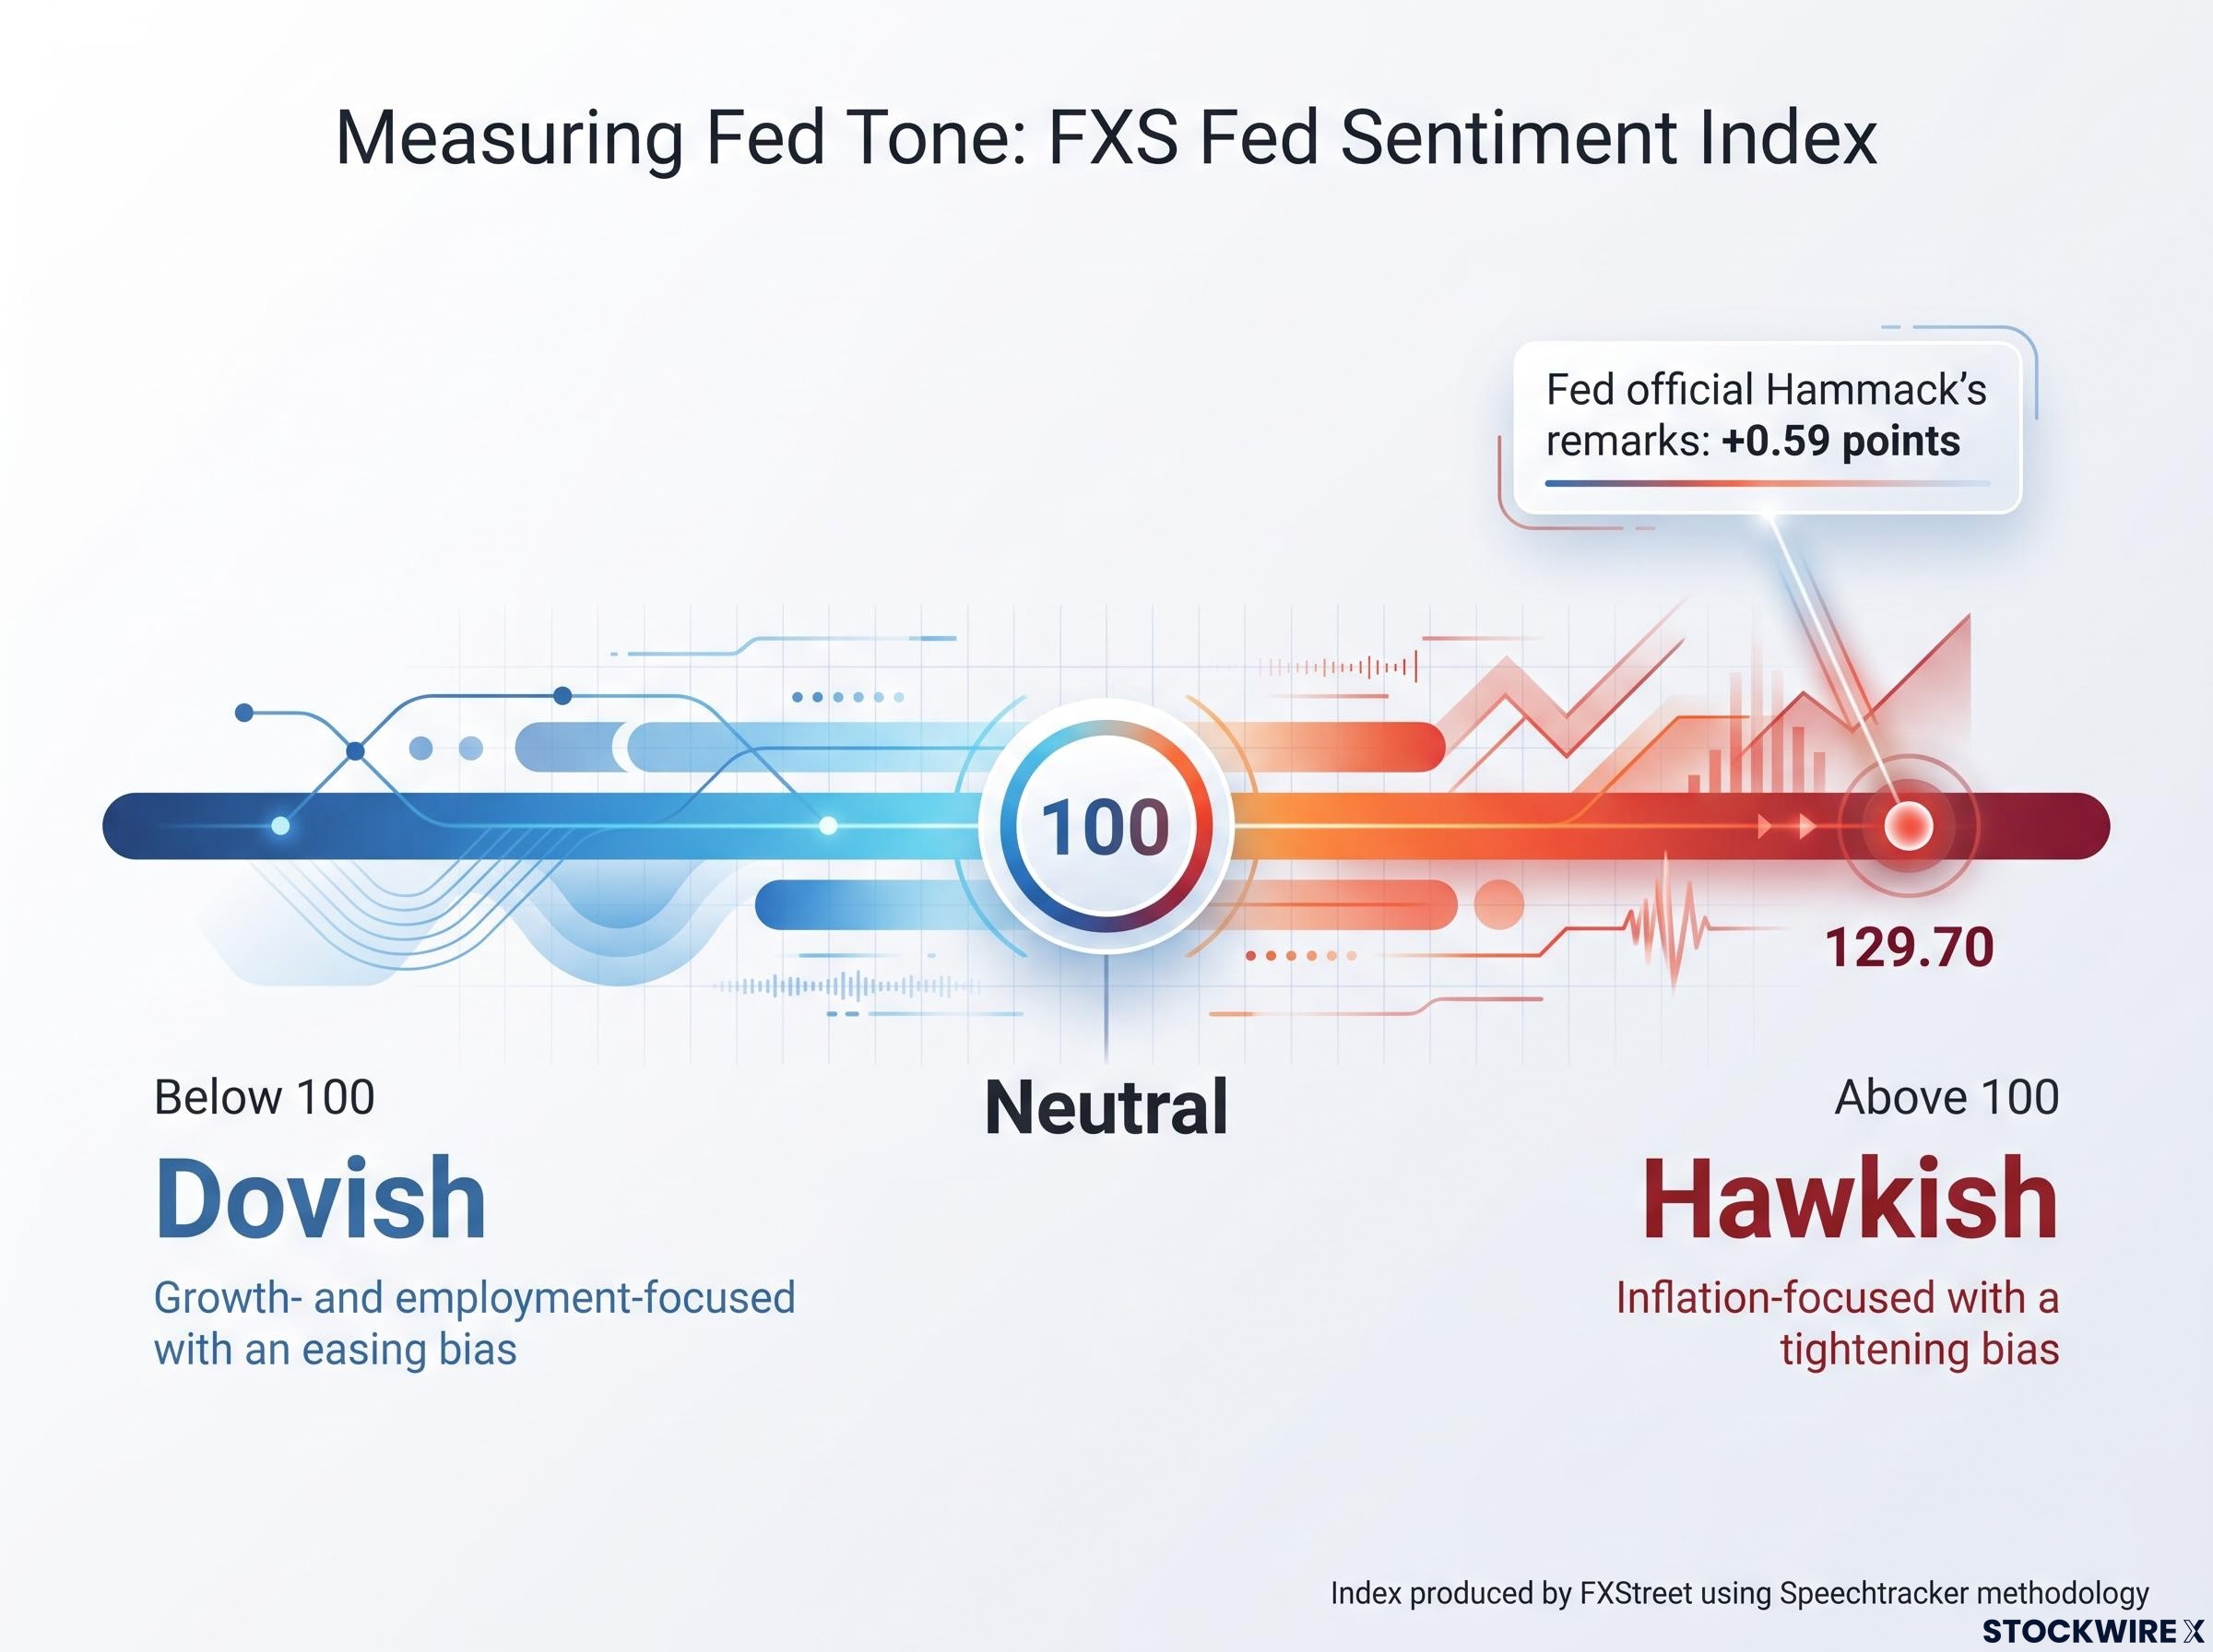
Every Fed communication carries a tonal signal that markets sort into two categories. A hawkish stance is inflation-focused with a tightening bias: policymakers prioritise bringing inflation down and signal willingness to raise rates or keep policy restrictive for longer. A dovish stance is growth- and employment-focused with an easing bias: policymakers signal openness to rate cuts or accommodative measures.
For currency markets, the mapping is direct. Hawkish signals support the dollar because they point toward higher real yields. Dovish signals weigh on it because they point toward lower yields and easier financial conditions.
Market participants try to quantify this tonal signal numerically. The FXS Fed Sentiment Index, a proprietary indicator produced by FXStreet using its Speechtracker methodology (not an official Federal Reserve measure), scores Fed rhetoric on a numerical scale. A reading of 100 is neutral. Above 100 is hawkish; below 100 is dovish. After Fed official Hammack’s remarks explicitly advocating for additional rate hikes, the index climbed +0.59 points to reach 129.70, a level well above the neutral midpoint and one that market analysts associate with conditions broadly supportive of the dollar.
The FOMC vote split adds a further layer to the hawk/dove reading: a nine-to-three hawkish split on a hold decision tells markets the committee is much closer to a hike than the headline outcome implies, and yield curves and the dollar reprice that probability immediately even though no rate change occurred.
| Fed signal | Typical dollar direction |
|---|---|
| Rate hike / hawkish guidance | Supportive (higher yields attract capital) |
| QE / dovish guidance | Weighs on dollar (conditional on crisis context) |
| QT / hawkish stance | Supportive (especially if peers are easing) |
The table above is useful as a default, but it only works when combined with the relativity principle. Everything in Fed-to-dollar transmission is relative: relative to what markets had already priced, and relative to what peer central banks are doing. Three conditional factors determine how much any signal actually moves the dollar:
- Was the move anticipated? A hawkish outcome that was fully priced may produce little movement; a surprise dovish tilt at a meeting where markets expected a hold can move the dollar sharply.
- What are peer central banks doing? A Fed rate hike matters less for the dollar if the European Central Bank and Bank of England are hiking at the same pace.
- Are real yields rising, or just nominal ones? A rate hike accompanied by rising inflation expectations may do little for the dollar if the real yield differential has not actually widened.
The practical upshot for you is that the statement language, the press conference tone, and the dot plot projections released at each FOMC meeting often contain more forward information about dollar direction than the rate decision number itself. Experienced Fed-watchers read the words at least as closely as the figure.
Putting it all together: a practical framework for interpreting any Fed decision
Everything above condenses into three questions you can ask every time the Fed acts or signals. Bring these to any FOMC meeting week, and you are processing the outcome as a practitioner would rather than waiting for the media summary that typically strips out the nuance determining actual dollar direction.
- Does this raise or lower real yields relative to peers? Not nominal rates; real yields after expected inflation. And not in isolation; relative to what other major central banks are offering.
- Is the balance sheet contracting or expanding? QT reinforces the rate-hike channel; QE works against it. The pace of balance sheet change matters, not just the direction.
- Was this anticipated, or does it represent a surprise? A fully priced hawkish outcome may move the dollar less than a surprise dovish comment in a press conference. The gap between expectation and reality is where currency moves live.
The overarching principle: the dollar does not simply respond to what the Fed does. It responds to what the Fed does relative to what was expected and what peer central banks are doing. Relativity governs all of it.
These three questions apply to the next Fed decision, the one after that, and any future policy regime. The eight scheduled FOMC meetings per year give you a structured cadence for applying them. Between meetings, watch the balance sheet trajectory and the tone of individual FOMC members’ speeches with the same attention you give the headline rate.
For readers wanting to apply the three-question framework to a live meeting, our dedicated guide to reading the FOMC statement walks through the exact two paragraphs in each statement that carry the most market-moving weight, including how inflation confidence phrasing and labour market characterisation shift rate-path pricing.
No framework eliminates uncertainty. The same tool applied in a crisis context (where safe-haven demand dominates) produces different outcomes than in a stable environment, which is why these are guide questions, not mechanical formulas. But they give you a structure for reading any Fed action with precision rather than relying on the one-sentence summary that leaves out almost everything that actually matters.
This article is for informational purposes only and should not be considered financial advice. Investors should conduct their own research and consult with financial professionals before making investment decisions.