
Bubs Australia lifts FY26 revenue 9% to $111.9M as US momentum drives growth
In its FY26 results presentation delivered on 27 August 2026, Bubs Australia reported full-year revenue of $111.9M, up 9.2% and landing within its guidance range of $105M–$115M. Growth was led by the United States, where revenue rose 24% on the prior corresponding period (pcp).
Management outlined that underlying earnings strengthened materially over the year, though reported profitability was affected by temporary second-half cost headwinds spanning tariffs, a regulatory reset and air freight. The presentation also flagged that the company’s US Food and Drug Administration (FDA) approval process has progressed to the final review stage.
Key headline metrics disclosed against guidance included:
-
Revenue of $111.9M (guidance $105M–$115M)
-
Gross profit margin of 39.8% (guidance greater than 40%)
-
Underlying EBITDA of $5.3M (guidance $4M–$8M)
-
Reported EBITDA of -$1.8M
The results reflect a business that delivered top-line growth despite macro headwinds, while investing ahead of anticipated future scale.
When big ASX news breaks, our subscribers know first
FY26 financial results — revenue growth meets temporary cost pressures
The presentation detailed a full-year P&L where revenue advanced but reported earnings declined on identifiable one-off second-half costs. Revenue climbed to $111.9M from $102.5M in FY25, driven by the 24% uplift in US sales and partly offset by weaker performance in Australia and the rest of the world.
The FY26 full-year revenue outcome reflects a significant acceleration from the H1 FY26 results, where Bubs reported a return to underlying profitability alongside 48% US revenue growth and upgraded full-year guidance to $120M-$125M.
Gross profit fell 9.4% to $44.5M, representing a margin of 39.8% (FY25: 47.8%), impacted by increased air freight, regulatory and tariff-related costs. Operating expenses rose 5.0% to $48.8M, reflecting increased marketing spend, though the opex-to-revenue ratio improved to 44% from 45%.
The standout figure was underlying EBITDA (a non-IFRS measure that excludes one-off items and is unaudited), which rose 338% to $5.3M from $1.2M in FY25. Net profit after tax registered a loss of -$4.6M, against a $5.5M profit in the prior year.
| Metric ($AUDm) | FY26 | FY25 | Change |
|---|---|---|---|
| Revenue | 111.9 | 102.5 | +9.2% |
| Gross Profit | 44.5 | 49.1 | -9.4% |
| Gross Profit % | 39.8% | 47.8% | -8.0pts |
| Reported EBITDA | (1.8) | 5.2 | n/m |
| Underlying EBITDA | 5.3 | 1.2 | +338% |
| NPAT | (4.6) | 5.5 | n/m |
Bridging reported to underlying earnings
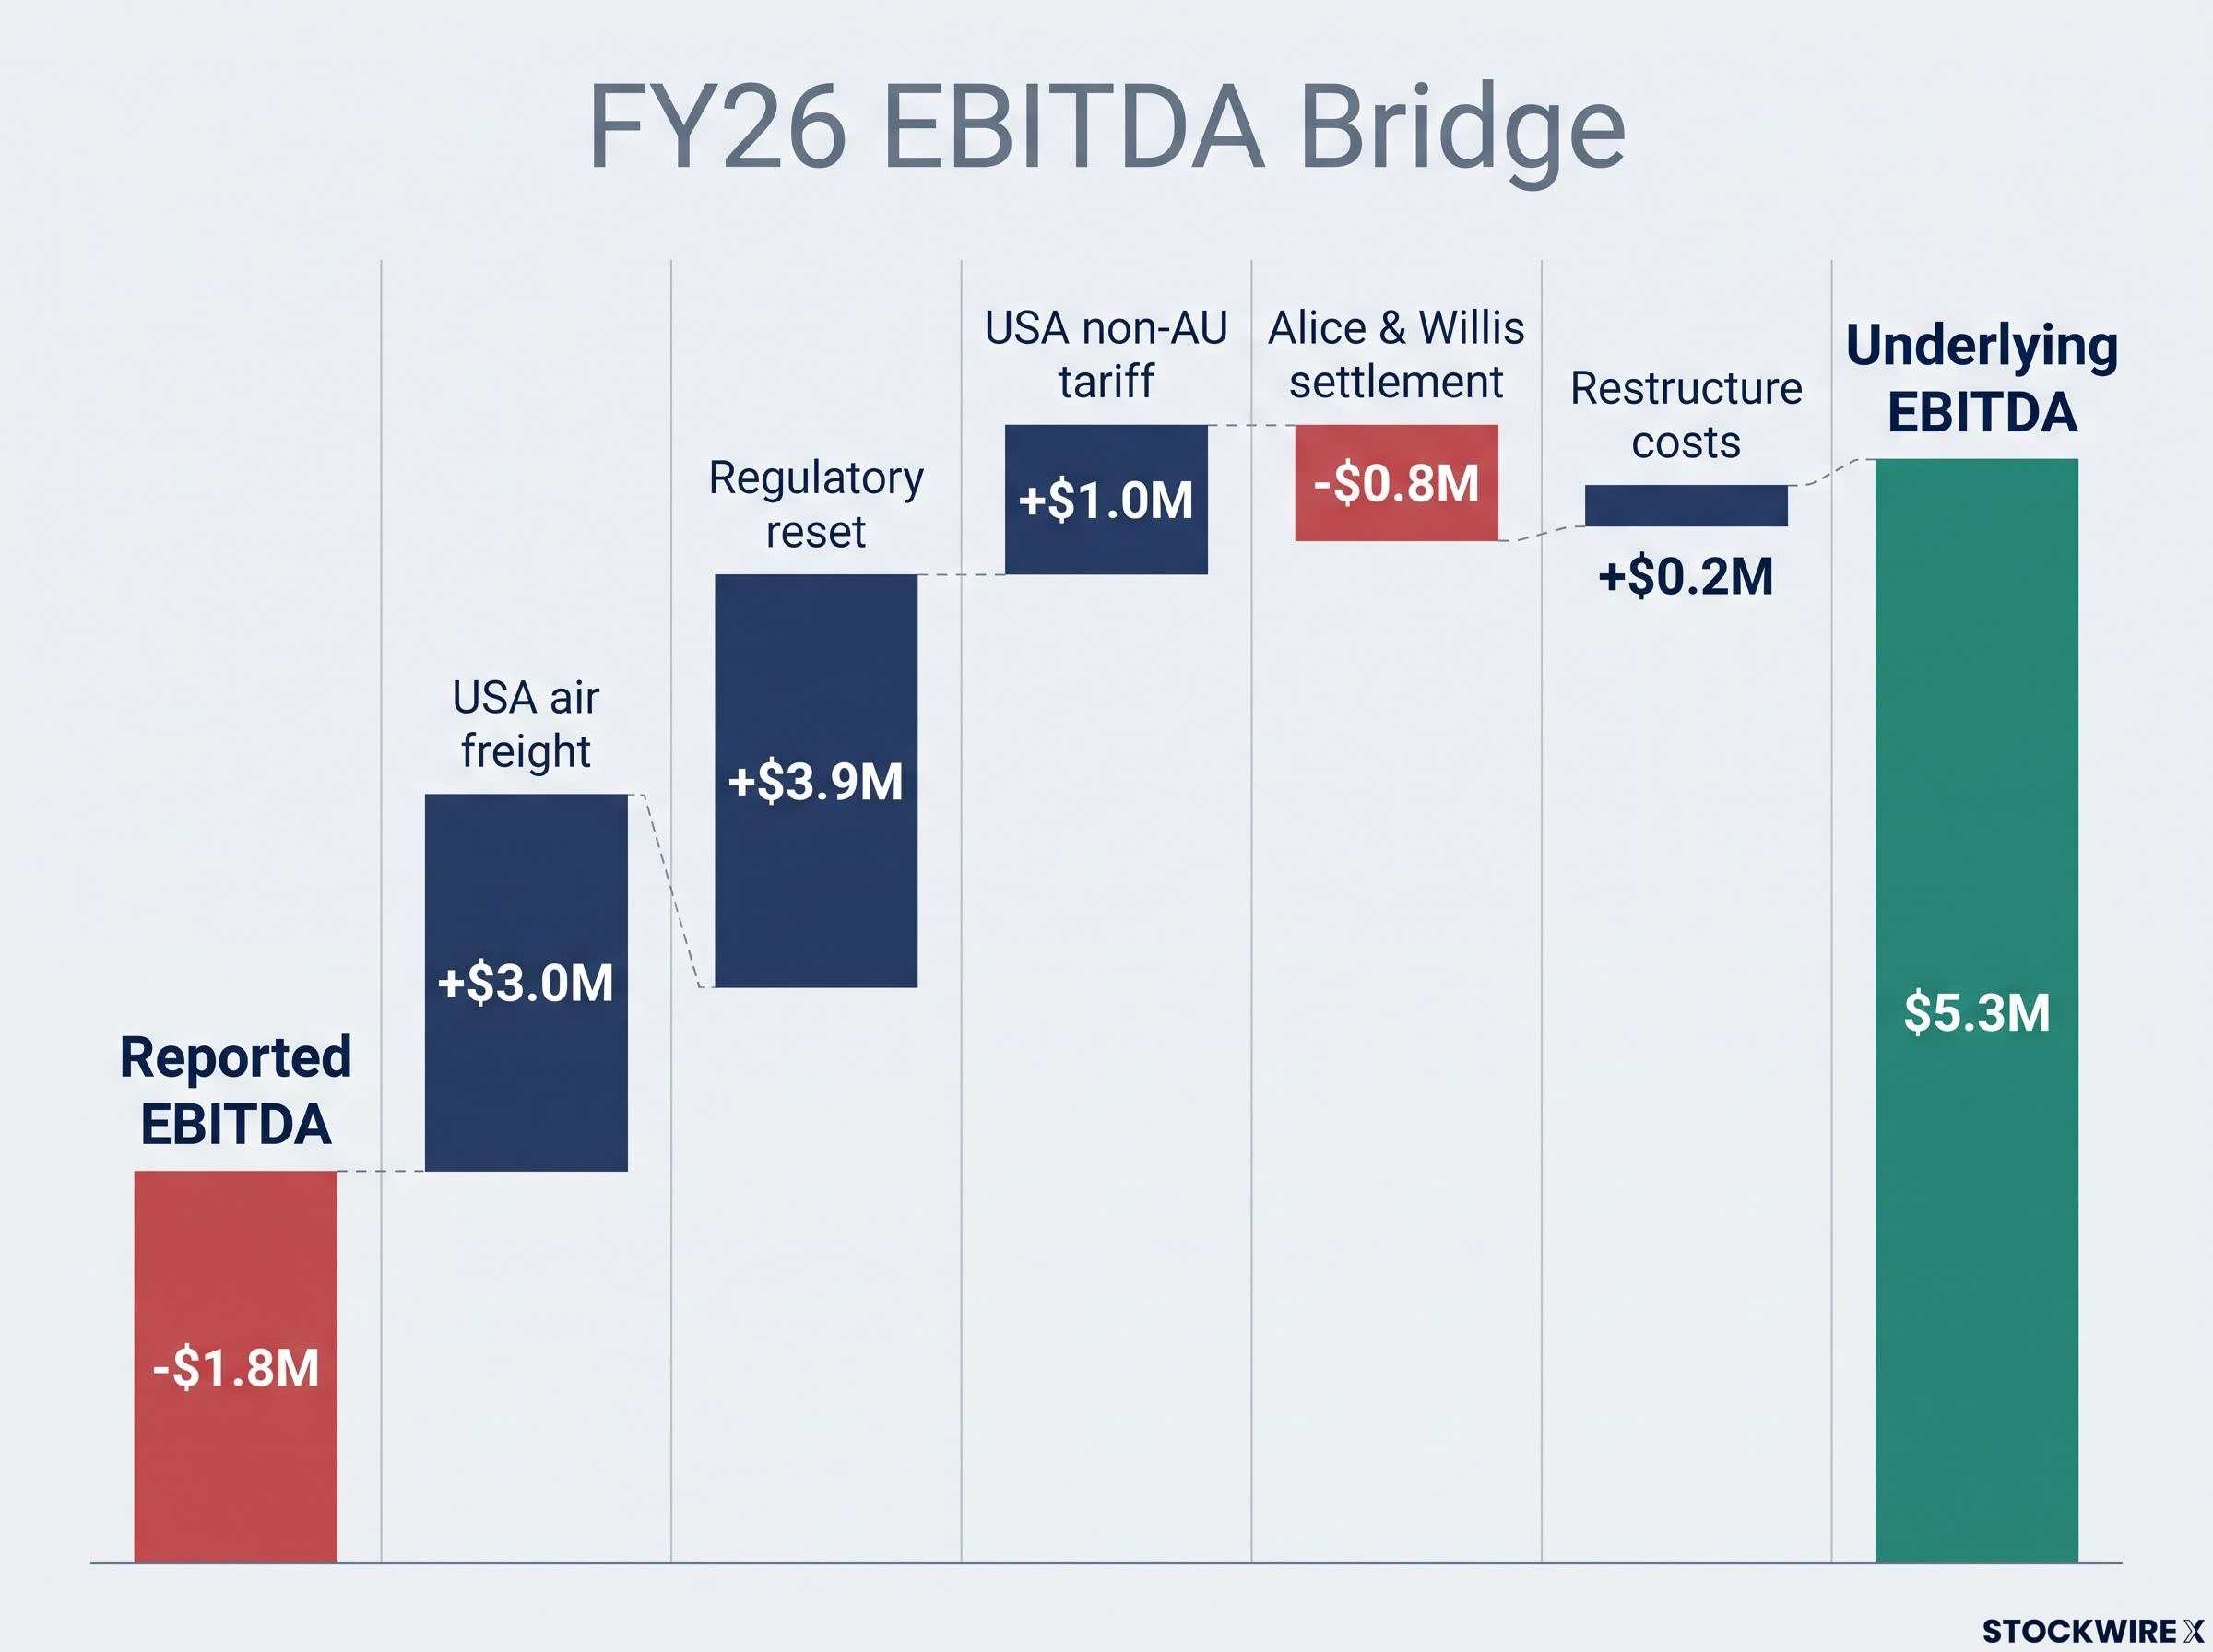
Management provided a reconciliation from reported EBITDA to the underlying figure, isolating the temporary items that weighed on second-half results:
-
FY26 Reported EBITDA: -$1.8M
-
USA air freight: +$3.0M
-
Regulatory reset: +$3.9M
-
USA non-AU tariff: +$1.0M
-
Alice & Willis settlement: -$0.8M
-
Restructure costs: +$0.2M
-
FY26 Underlying EBITDA: $5.3M
The underlying figure is intended to illustrate the earnings trajectory once these one-off costs normalise.
Balance sheet strengthened with inventory restock complete
The presentation framed FY26 as a period of deliberate working capital investment. Current inventories increased to $36.3M (up $16.2M), driven by a targeted restocking programme to ensure continuity of supply and support growth. Management confirmed the inventory restock is now complete.
To fund the restock and associated working capital requirements, $10.0M was drawn under bank facilities. The operating cash outflow of $15.1M reflected this planned working capital investment rather than operational distress.
At period end, net assets stood at $39.0M, with closing cash of $9.4M. Net working capital increased by $12.3M to $35.5M, lifting the net working capital to sales ratio to 31.7%. This positions the inventory base to support anticipated FY27 growth.
Understanding the infant formula opportunity
Premium and goat-based infant milk formula (IMF) refers to higher-priced products often formulated with alternative protein sources such as goat’s milk. Even as birth rates decline in key markets, premiumisation, where consumers trade up to higher-value products, continues to drive category demand.
Within this backdrop, the presentation noted Bubs held total US IMF market share at 1%, premium natural share at 8%, and goat infant share at 20%. The company’s stated purpose is to provide “clean nutrition products that offer peace of mind for parents and lifelong wellbeing for their bubs.”
This premiumisation trend, offsetting volume declines, represents the structural tailwind underpinning the growth thesis.
Regional performance — USA leads, China stable, Australia rebuilding
Regional results varied, with the United States operating as the primary growth engine while other markets navigated regulatory and competitive dynamics.
USA — distribution expansion powers 24% growth
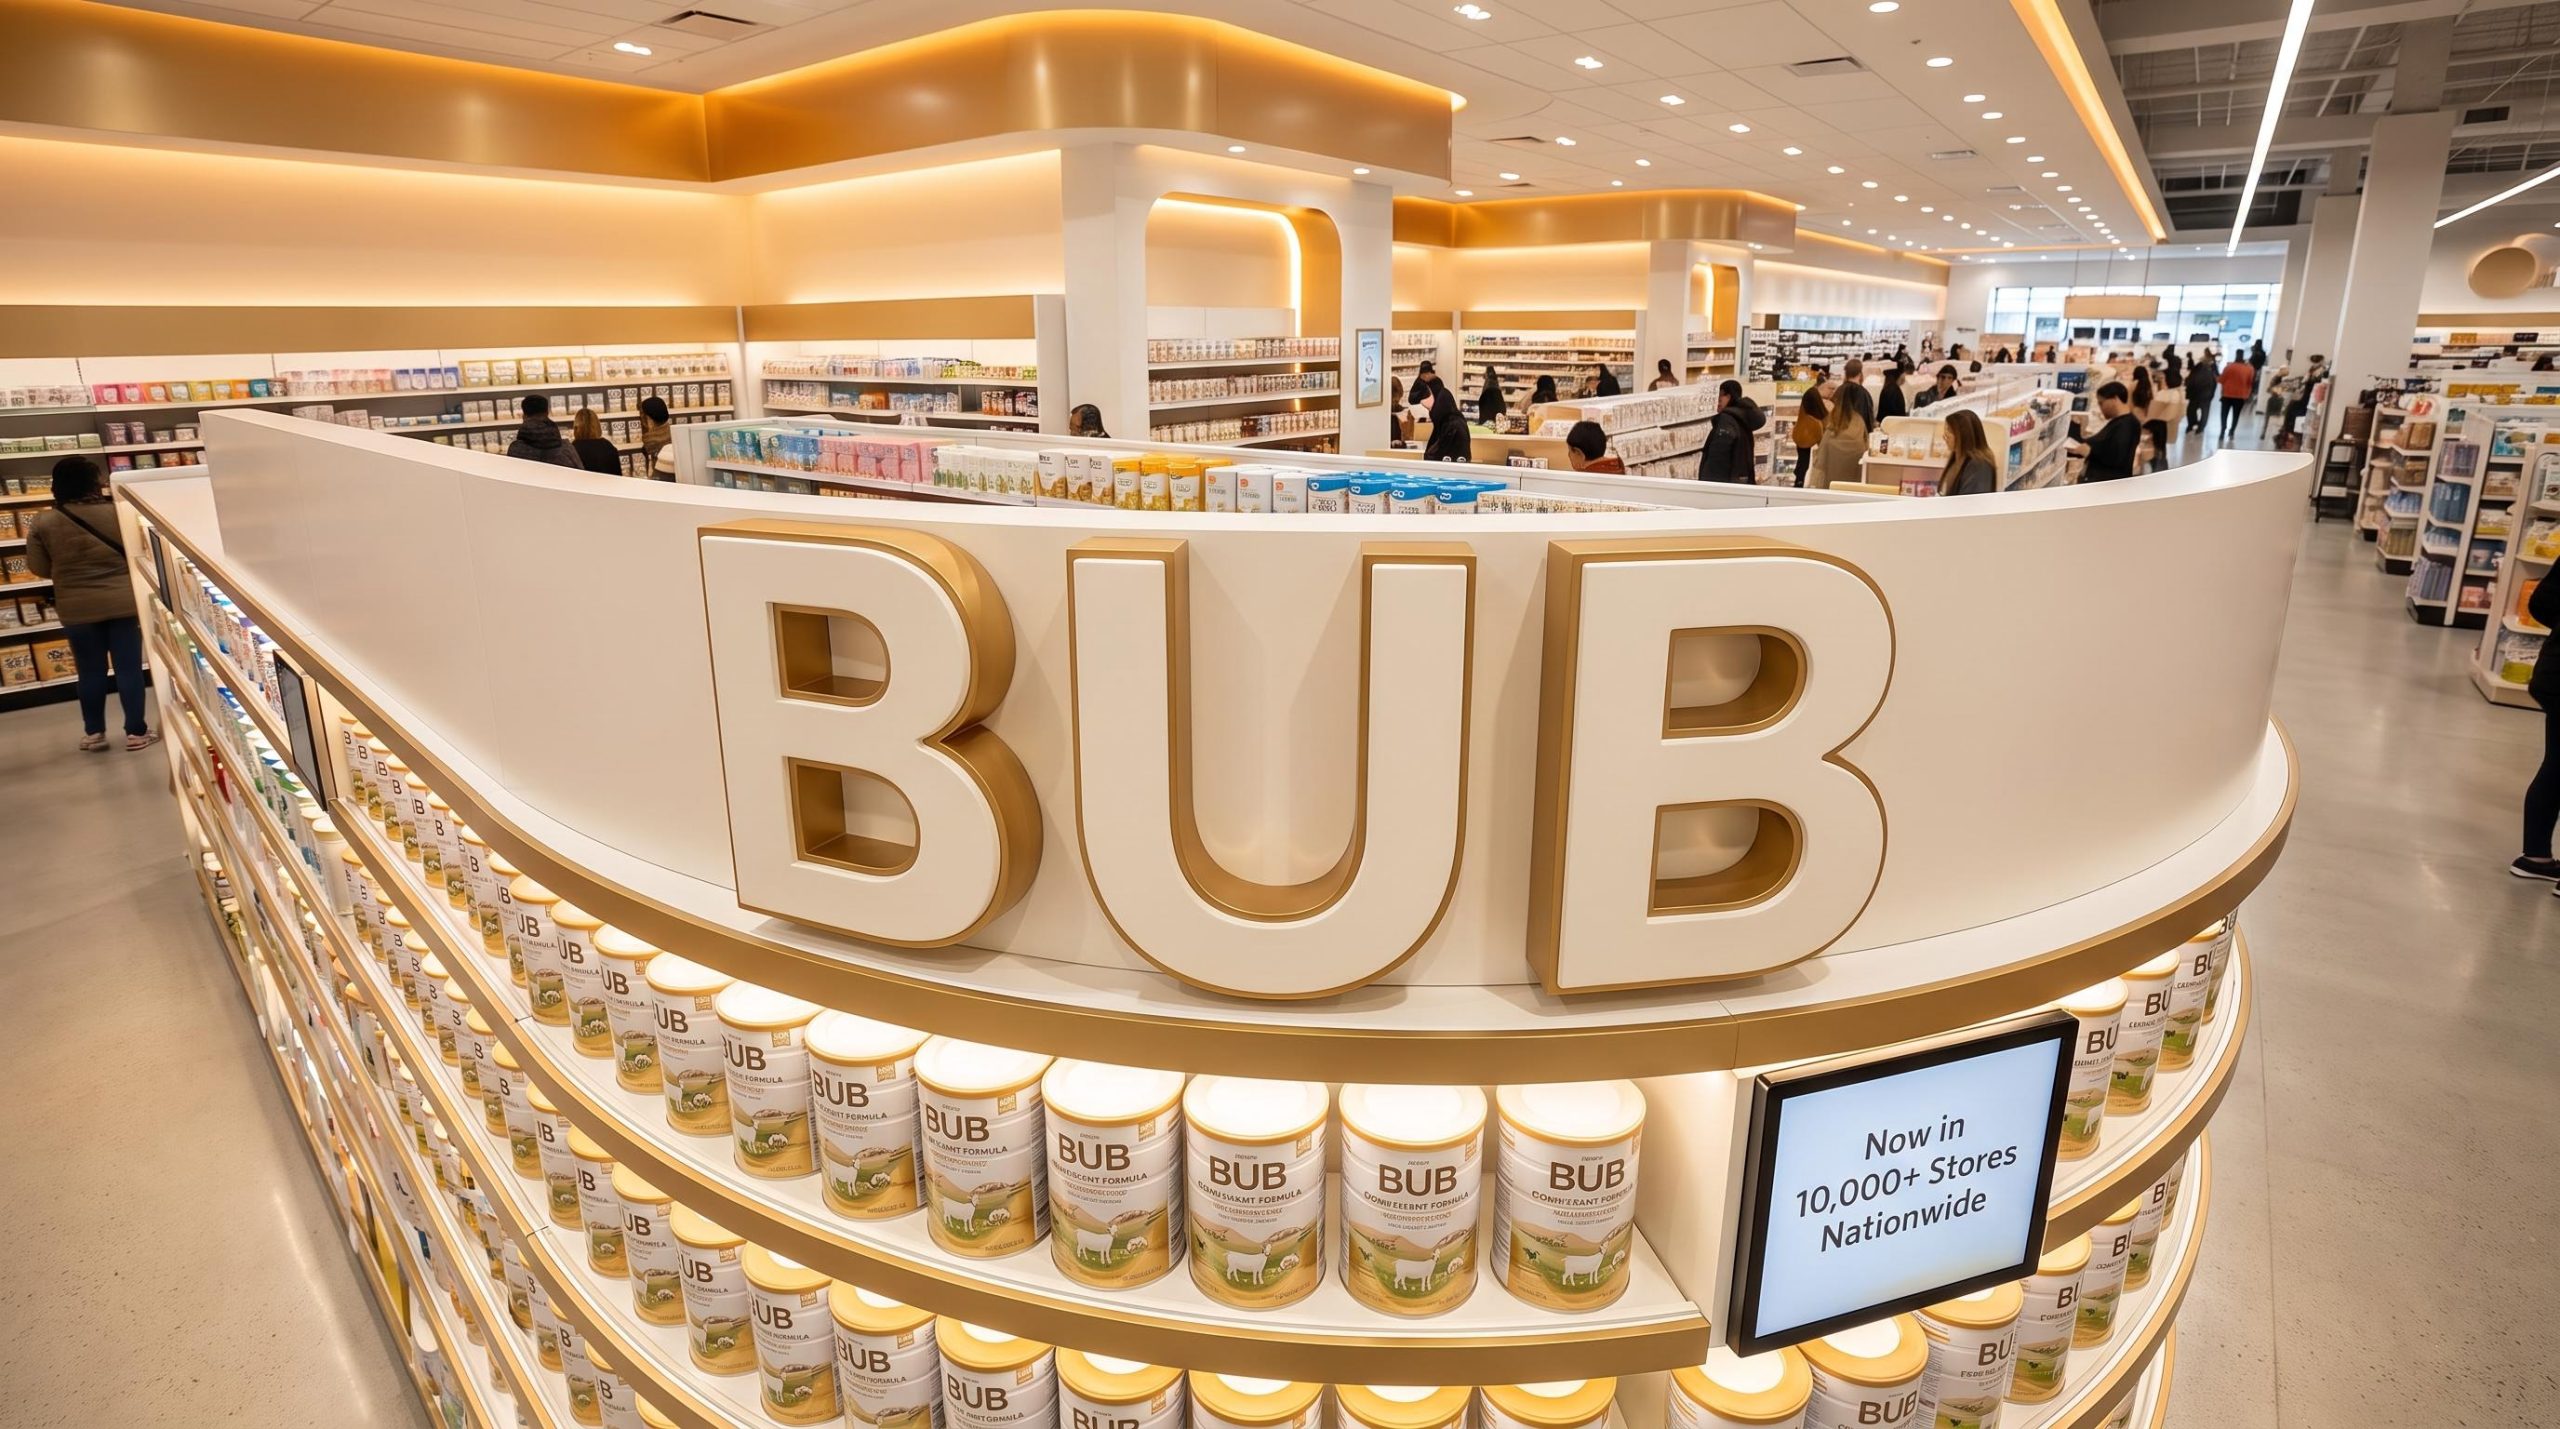
US sales revenue reached $65.8M, up 24% vs pcp. Distribution expanded from 4,000 to 10,000+ stores across all 50 states, including national availability through Amazon, Target and Walmart, with a club format launched at Sam’s Club targeting bulk-purchasing consumers.
Management outlined that digital targeting on Amazon, Reddit and TikTok drove incremental sales, delivering a +20% year-on-year click rate on Amazon.
China — demand healthy, inventory normalised
China sales revenue was $21.4M, flat vs pcp, with inventory levels normalising as the regulatory reset concluded. The online-to-offline (O2O) channel expanded to 1,800+ stores (up 39%), with sell-out increasing 30%.
The company entered KidsWant, described as China’s largest Mother & Baby retail chain, while cross-border e-commerce (CBEC) sell-out rose 34%.
Australia & ROW — recovery underway
The Australian and rest-of-world segments showed early signs of recovery:
-
Australia: revenue of $18.3M, down 7%; H2 marketing lifted to 16% of sales (H1: 9%); brand awareness up 10 points to 87%; regaining market share
-
ROW: revenue of $6.4M, down 25%, impacted by the regulatory reset, with Vietnam re-launching in H1 FY27
| Region | FY26 Revenue | Change vs pcp |
|---|---|---|
| USA | $65.8M | +24% |
| China | $21.4M | Flat |
| Australia | $18.3M | -7% |
| ROW | $6.4M | -25% |
Strategy execution and the H1 FY27 outlook
The presentation framed the growth strategy as coming to life across three pillars: Activate Brand and Consumer, Build a Winning Portfolio, and Connect Farm to Formula. Management highlighted several delivered milestones during the period:
The Bubs 2030 Strategy, presented by CEO Joe Coote at an investor day in March 2026, maps the company’s long-term growth roadmap across ten international markets including the US, China, Southeast Asia and the Middle East, providing the strategic architecture behind the regional investments visible in the FY26 results.
-
$1.15M in logistics and manufacturing savings delivered
-
Australian goat herd expanded by more than 70%
-
Canada market entry in progress
-
Global brand refresh in progress
What comes next for investors
For the first half of FY27, management disclosed a positive revenue growth outlook, with regional performance to remain mixed. The US is expected to sustain strong growth momentum, China growth is anticipated via expanded distribution and marketing, Australia’s recovery is to be accelerated through continued marketing investment, and ROW product flows are improving.
Gross margin is expected to improve, with working capital positioned to support the anticipated growth. Management also confirmed the company is working to finalise the FDA approval process, currently at the final review stage.
Management Outlook
The presentation noted that improved momentum is expected through H1 FY27 as the business adapts to the new regulatory and tariff environment, with confidence in the growth outlook underpinning continued brand investment.
For investors, FDA approval progress and margin recovery stand out as the near-term value drivers, with the completed inventory build positioning the company to convert demand into sales through FY27.
Don’t Miss the Next Consumer Sector Breakout
Big News Blast delivers FREE breaking ASX consumer sector news directly to your inbox within minutes of release, complete with in-depth analysis. Join 20,000+ subscribers already staying ahead of the market. Click the “Free Alerts” button at StockWire X to get the next market-moving announcement the moment it drops.