
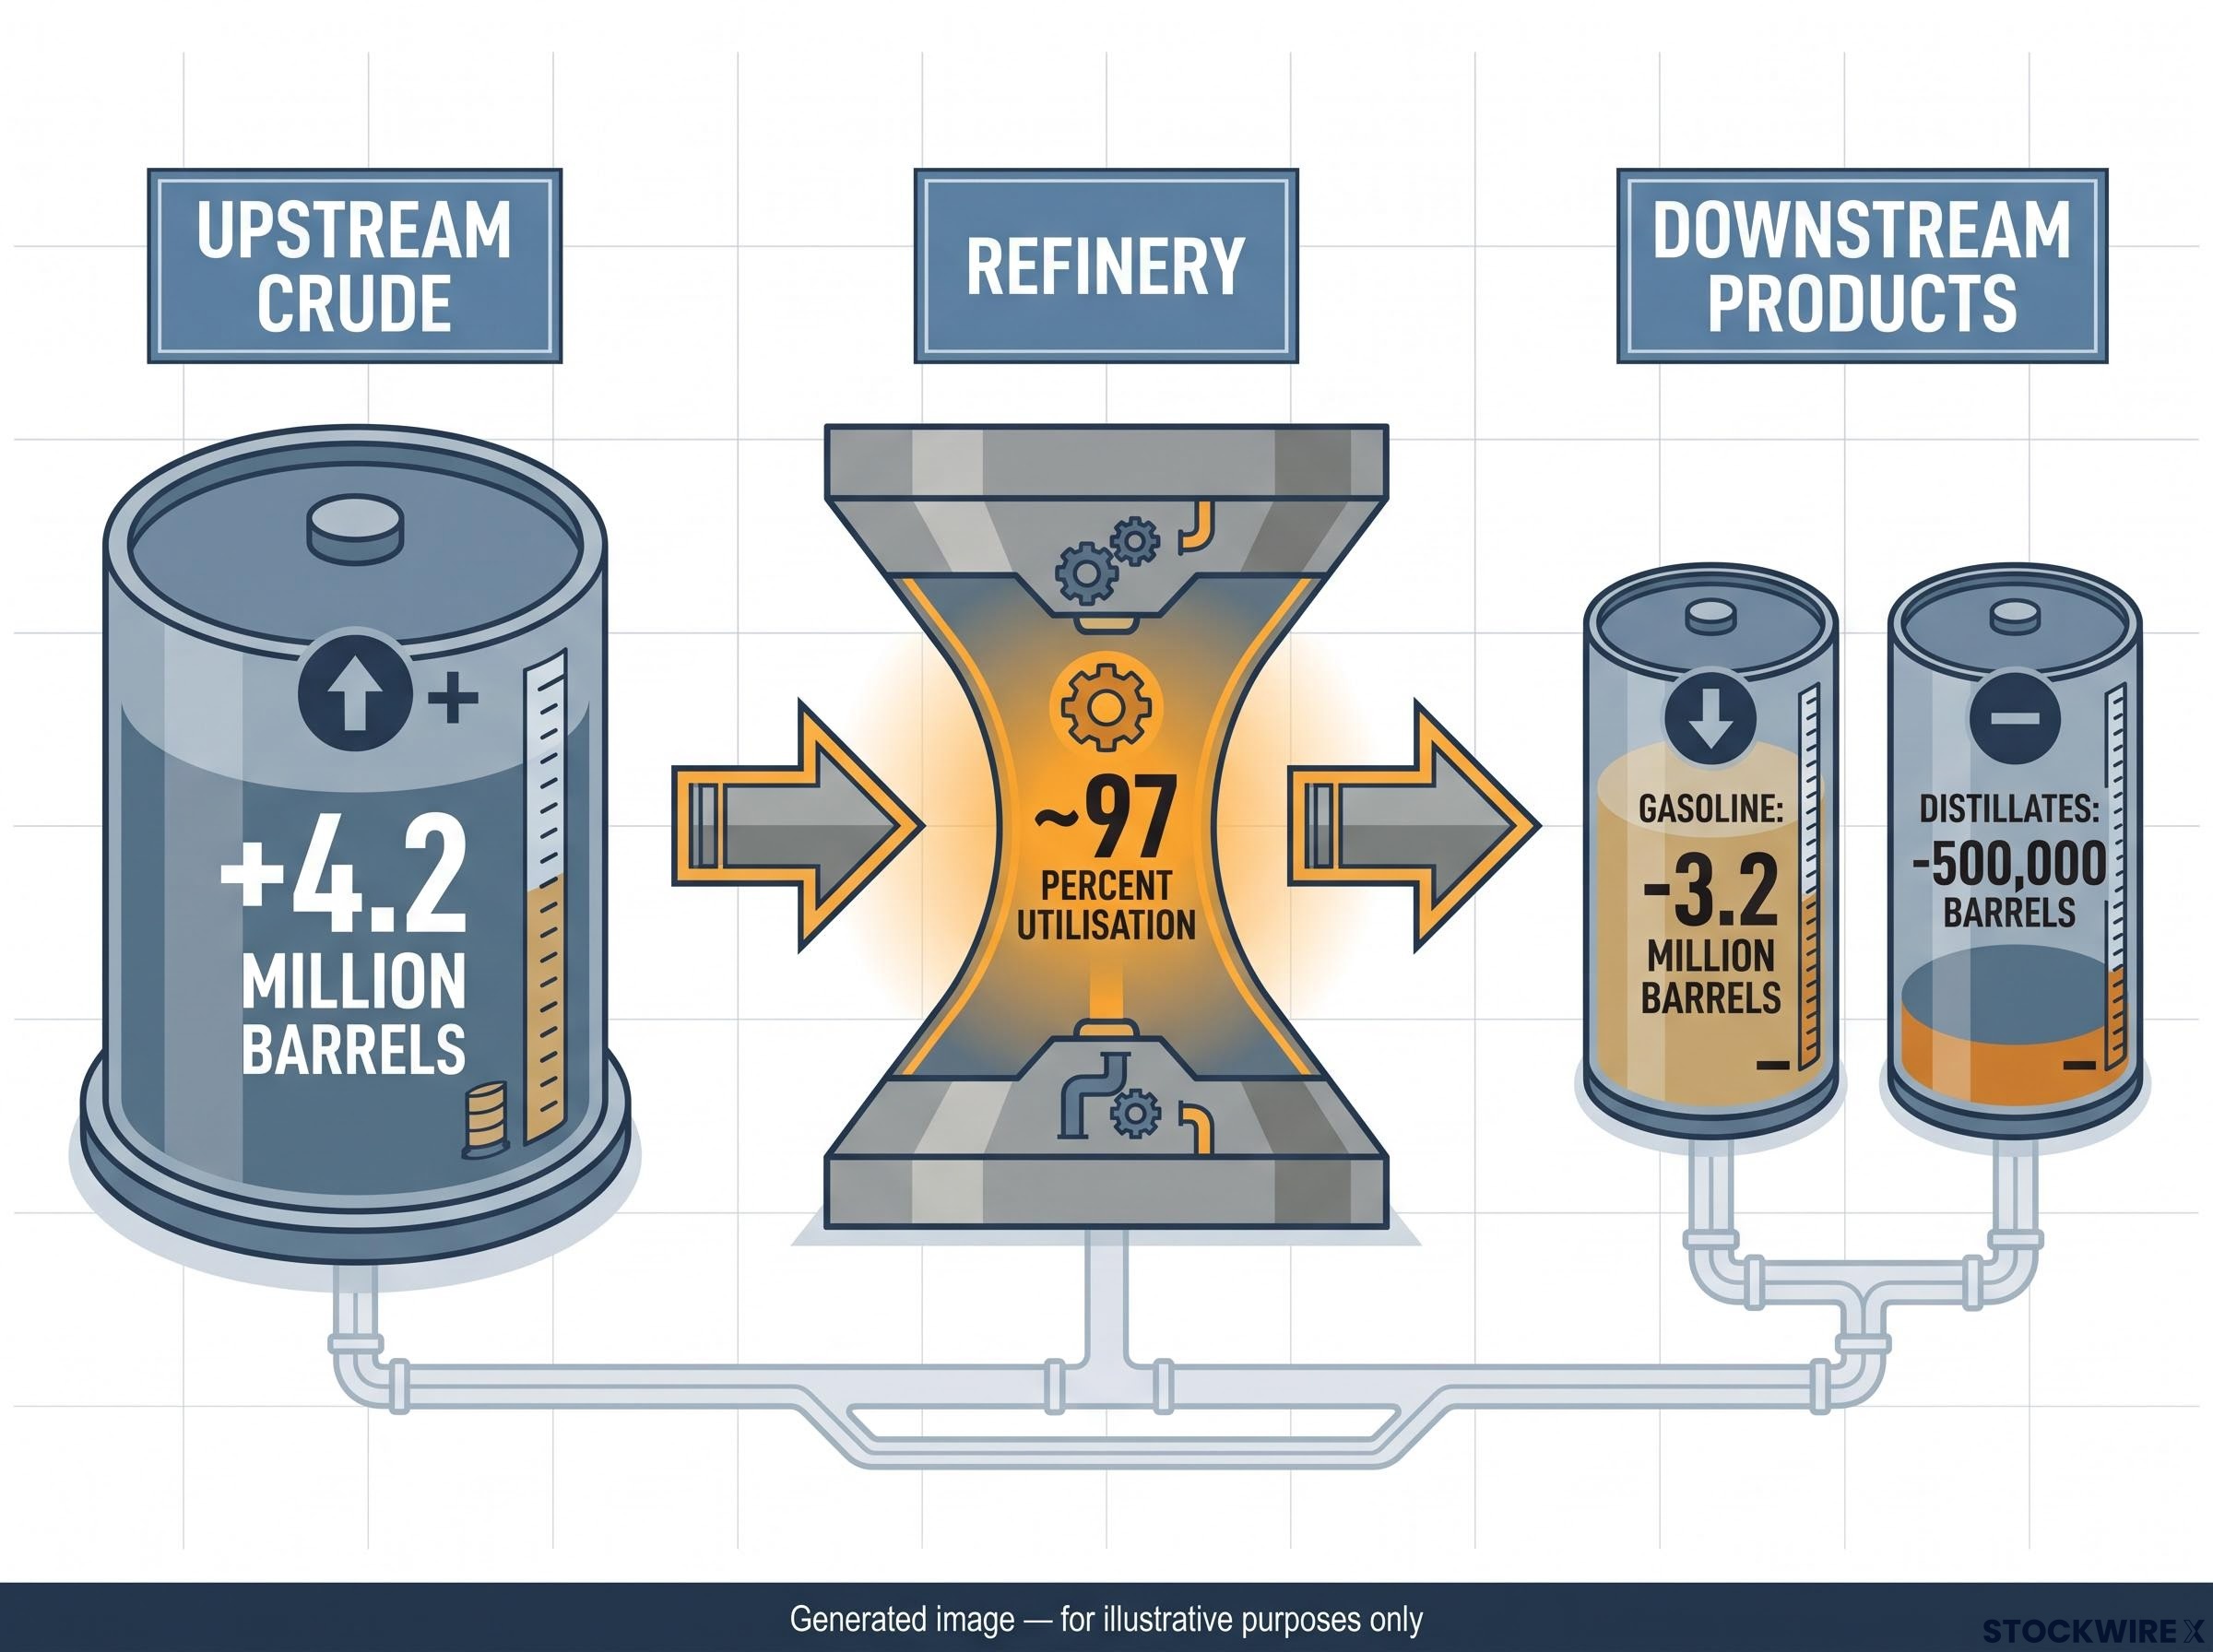
This week’s US oil inventory data told two stories at once, and the one most investors noticed first is probably the less important one. Weekly figures from the American Petroleum Institute (API) for the period ending 21 August 2026 showed crude stocks swelling by 4.2 million barrels, a headline that reads bearish at first glance. What that number obscures is a simultaneous tightening in the products market: petrol inventories drew down by 3.2 million barrels and distillate stocks shed around 500,000 barrels, both against seasonal levels that were already lean.
That split is not a mixed signal. It is a coherent picture of a supply chain under pressure at two different points, and reading only the crude number leads to the wrong conclusion about demand, prices, and refining margins.
The official Energy Information Administration (EIA) confirmation is due today, 26 August 2026. Here is how to read the divergence the way a practitioner does, what it means for crude prices versus product prices versus refining margins, and which signals to watch before making any positioning decision.
A tale of two tanks: what this week’s API data actually shows
4.2 million barrels: the crude inventory build reported by the API for the week ending 21 August 2026, the largest single-week addition in several months.
That figure pushed commercial crude inventories to approximately 428.8 million barrels (excluding the Strategic Petroleum Reserve), roughly in line with the five-year seasonal average. On its own, the number reads as ample supply.
The product side tells a different story. The API data recorded a 3.2-million-barrel draw in gasoline stocks, pulling inventories below their five-year seasonal average. Distillate stocks contracted by roughly 500,000 barrels over the same period, also leaving them short of the five-year seasonal benchmark.
| Commodity | Weekly change (barrels) | Current stock level | vs. five-year average |
|---|---|---|---|
| Crude oil | +4.2 million | ~428.8 million | Roughly in line |
| Gasoline | -3.2 million | Below average | Below five-year seasonal |
| Distillates | -500,000 | Below average | Below five-year seasonal |
The data comes from the API’s weekly report, as cited by ING analysts Warren Patterson and Ewa Manthey. API releases preliminary estimates on Tuesday evenings; the EIA publishes official figures on Wednesdays. Today’s EIA release covers this same reporting period.
The simultaneous crude build and product draw is not an anomaly to average out. It is a snapshot of a supply chain that is loose at one end and tight at the other, and the reader needs to hold both readings as true before the pricing implications make sense.
The mechanics of reading US oil inventory data reward investors who look past the headline crude figure and into the product breakdown, the SPR contribution, and the gap between the API preliminary and EIA official releases, because each component changes the interpretation of what looks like a single number.
When big ASX news breaks, our subscribers know first
Why crude builds and product draws happen at the same time
Crude oil and refined products, gasoline, diesel, jet fuel, sit at different stages of the same supply chain. A weekly inventory report captures a single frame of a process that takes weeks to complete. When the frame catches crude arriving faster than refineries can process it while consumers keep drawing from finished-product storage, both numbers move in opposite directions without any contradiction.
Why crude accumulates upstream
Three forces push crude into storage even when demand for refined fuel remains strong:
- Refinery maintenance or outages: Planned turnarounds or unplanned shutdowns temporarily reduce the rate at which crude is processed, letting barrels accumulate in tank farms.
- Import and production surges: A wave of imports arriving in a single week, or a short-term uptick in domestic output, hits storage before refineries can schedule additional runs.
- Timing lags: Crude delivered to a terminal in a given week can take one to three weeks to move through the refining process and emerge as finished product.
Refinery utilisation was running near 97 percent in recent weeks. That rate tells you refiners are already running hard; the crude build is not a sign of weak demand for refining services. It is a throughput bottleneck, a gap between the pace of crude delivery and the pace of crude processing.
EIA’s weekly refinery utilisation data confirms that US refinery runs have been operating near multi-year highs through mid-2026, which corroborates the throughput-bottleneck reading of this week’s crude build rather than a demand-weakness interpretation.
Why product tanks empty at the same time
End-use demand does not pause while refineries catch up. Petrol stations, freight operators, and distributors continue pulling from product storage to meet consumer and commercial needs regardless of what is happening at the refinery level.
When refinery throughput is temporarily constrained, even slightly, and end-use consumption holds steady, the arithmetic is straightforward: product inventories fall. That drawdown can accelerate when product stocks are already lean relative to historical averages, because there is less buffer to absorb the gap.
The pattern mirrors past episodes where crude stocks rose while product markets tightened. It is structural, not random, and understanding the mechanics is what separates an informed read from a headline reaction.
What the divergence means for crude prices, fuel costs, and refining margins
The supply chain picture established above produces three distinct price signals, and they do not all point in the same direction.
- Crude prices face modest downward pressure. A build of 4.2 million barrels signals that the prompt crude market is well supplied. Futures markets tend to read this as near-term bearish, particularly when the build exceeds consensus expectations. The effect strengthens when commercial inventories sit at or above the five-year seasonal average, as they do now.
- Gasoline and distillate prices find structural support. Product stocks sitting below five-year seasonal averages create a floor. Each additional weekly draw amplifies the price sensitivity because the inventory buffer is thinner. Lean inventories mean even modest drawdowns can push wholesale and retail prices higher than they would in a more comfortably supplied environment.
- Crack spreads widen, favouring refiners. This is the signal most investors miss.
A crack spread is the margin between the cost of crude feedstock and the selling price of refined products. It is the primary measure of refining profitability.
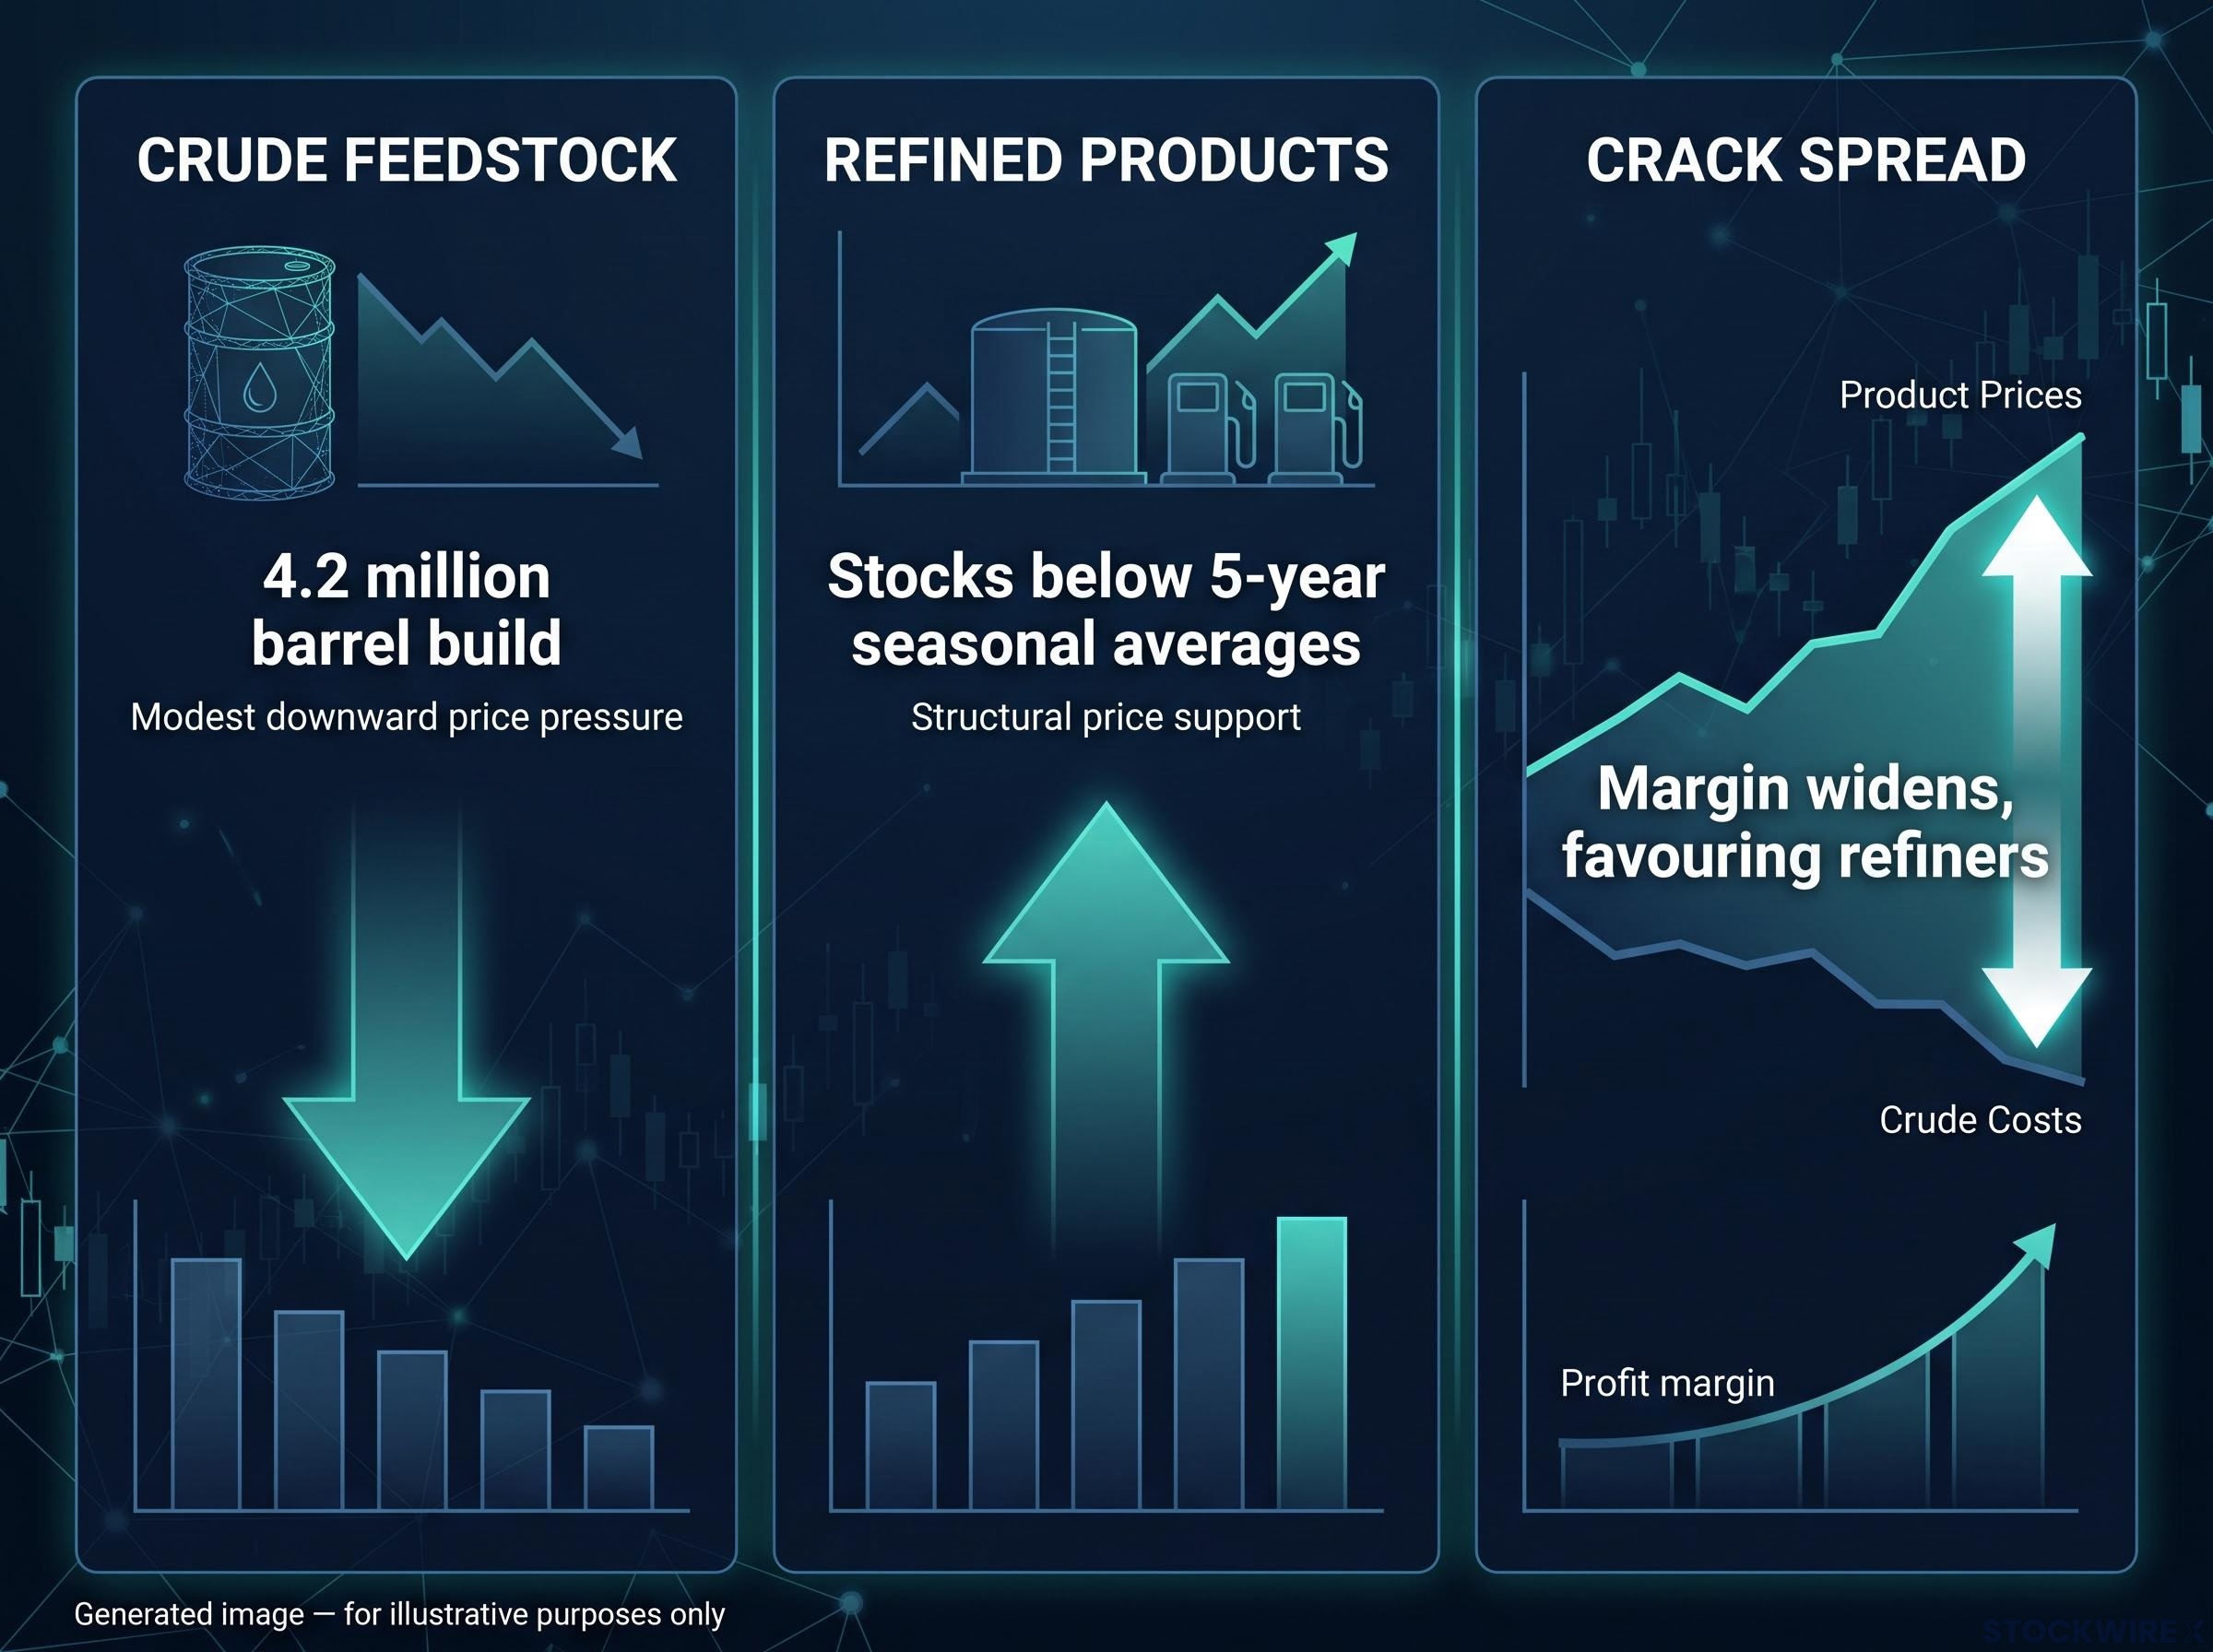
When a crude build pressures input costs at the same time that product tightness supports output prices, the gap between the two widens. That is precisely what this week’s data configuration sets up. Historical episodes where crude inventories rose while gasoline and distillates fell have often coincided with elevated crack spreads, benefiting independent refiners and the refining segments of integrated majors.
Crack spread dynamics can move with exceptional speed when both inputs align: the diesel crack crossed $100 per barrel for the first time on record after a compounding set of supply shocks reduced distillate inventories while crude feedstock costs remained elevated, a configuration that amplifies the margin signal well beyond what seasonal norms would predict.
For a reader with energy exposure, the most consequential takeaway from this week’s data is not the directional read on crude. It is the refining margin setup. The divergence is arguably constructive for refiners in a way the headline crude build entirely obscures. If you are assessing energy sector exposure, the distinction between crude-price-sensitive positions and refining-margin-sensitive positions matters more this week than the direction of crude alone.
How to use inventory data as an ongoing market-reading tool
This week’s numbers are one data point. The framework for reading them is something you can apply every Tuesday and Wednesday through the rest of the year.
The four signposts to track in coming weeks
- Refinery utilisation rates: A rising rate signals that refiners are increasing crude runs in response to strong product demand. That begins pulling down crude stocks and replenishing product inventories. A declining rate does the opposite.
- Crack spreads and product futures curves: Sustained strength in cracks confirms that product tightness is durable rather than a one-week anomaly. Watch for the spread to hold or widen across multiple reporting periods.
- Product stocks versus the five-year range: While gasoline and distillate inventories remain near the low end of their historical range, markets stay sensitive to further draws and product prices find structural support.
- EIA confirmation versus API preliminary: Today’s EIA release is the official cross-check. When the two sources align, the signal strengthens. When they diverge, the single-week reading carries less weight.
Single-week prints versus multi-week trends
API and EIA figures can differ in magnitude, and occasionally in direction, for any given week. A single print that surprises the market can move prices intraday, but it does not establish a trend.
The preferred smoothing tool is the four-week rolling average, which filters out one-off swings from import timing, weather disruptions, or reporting methodology differences. Persistent crude builds alongside repeated product draws across multiple weeks would reinforce the narrative of a temporary refining bottleneck combined with ongoing end-use demand strength. A single week does not do that alone.
The EIA publishes five-year seasonal averages in its Weekly Petroleum Status Report, and these benchmarks are the standard reference for assessing whether any given inventory level is tight or ample relative to historical norms. Building the habit of checking both the crude and product lines of each report, and comparing them to those averages, gives you a repeatable framework for reading energy market conditions before they fully price into futures and equity markets.
Commercial inventory levels oscillate around five-year seasonal averages with sufficient speed that a single major surprise can shift market positioning; the 7.2-million-barrel draw reported in late July 2026 pushed commercial stocks to their lowest level since 2018 and Cushing below operational thresholds, illustrating how quickly the buffer can erode when consecutive weekly draws compound.
Reading the full picture before the next EIA release
The aggregate picture from this week’s API data is clear on the broad strokes. Crude supply is temporarily loose at the upstream level. Product markets are tightening at the downstream level. That combination is mildly bearish for crude, supportive for refined product prices and refining margins, and does not signal broad-based demand weakness.
Today’s EIA release, 26 August 2026, is the confirmation moment. What you are watching for:
- Confirmation scenario: EIA data aligns with or exceeds the API’s 4.2-million-barrel crude build while also showing gasoline and distillate draws. This validates the refining margin thesis and the near-term crude caution.
- Divergence scenario: EIA shows a materially smaller crude build or, less likely, product builds rather than draws. Both the bearish crude signal and the product tightness signal weaken, and the single-week reading loses weight.
Regardless of today’s print, the structural story has durability. Gasoline and distillate inventories sit below their five-year seasonal averages. That leanness does not resolve in a single week. It creates a floor for product prices and keeps refining margins supported until inventory levels meaningfully rebuild.
Structural supply disruptions operating at the scale of the Strait of Hormuz closure add a layer of complexity that weekly inventory data alone cannot capture; the IEA July 2026 report recorded simultaneous deterioration across supply, refinery throughput, and inventories, showing how geopolitical shocks can override the normal supply-chain mechanics that explain a single week of API divergence.
The headline crude build got the attention. The product draws tell you more about where the value sits.
This article is for informational purposes only and should not be considered financial advice. Investors should conduct their own research and consult with financial professionals before making investment decisions. Past performance does not guarantee future results. Financial projections are subject to market conditions and various risk factors.