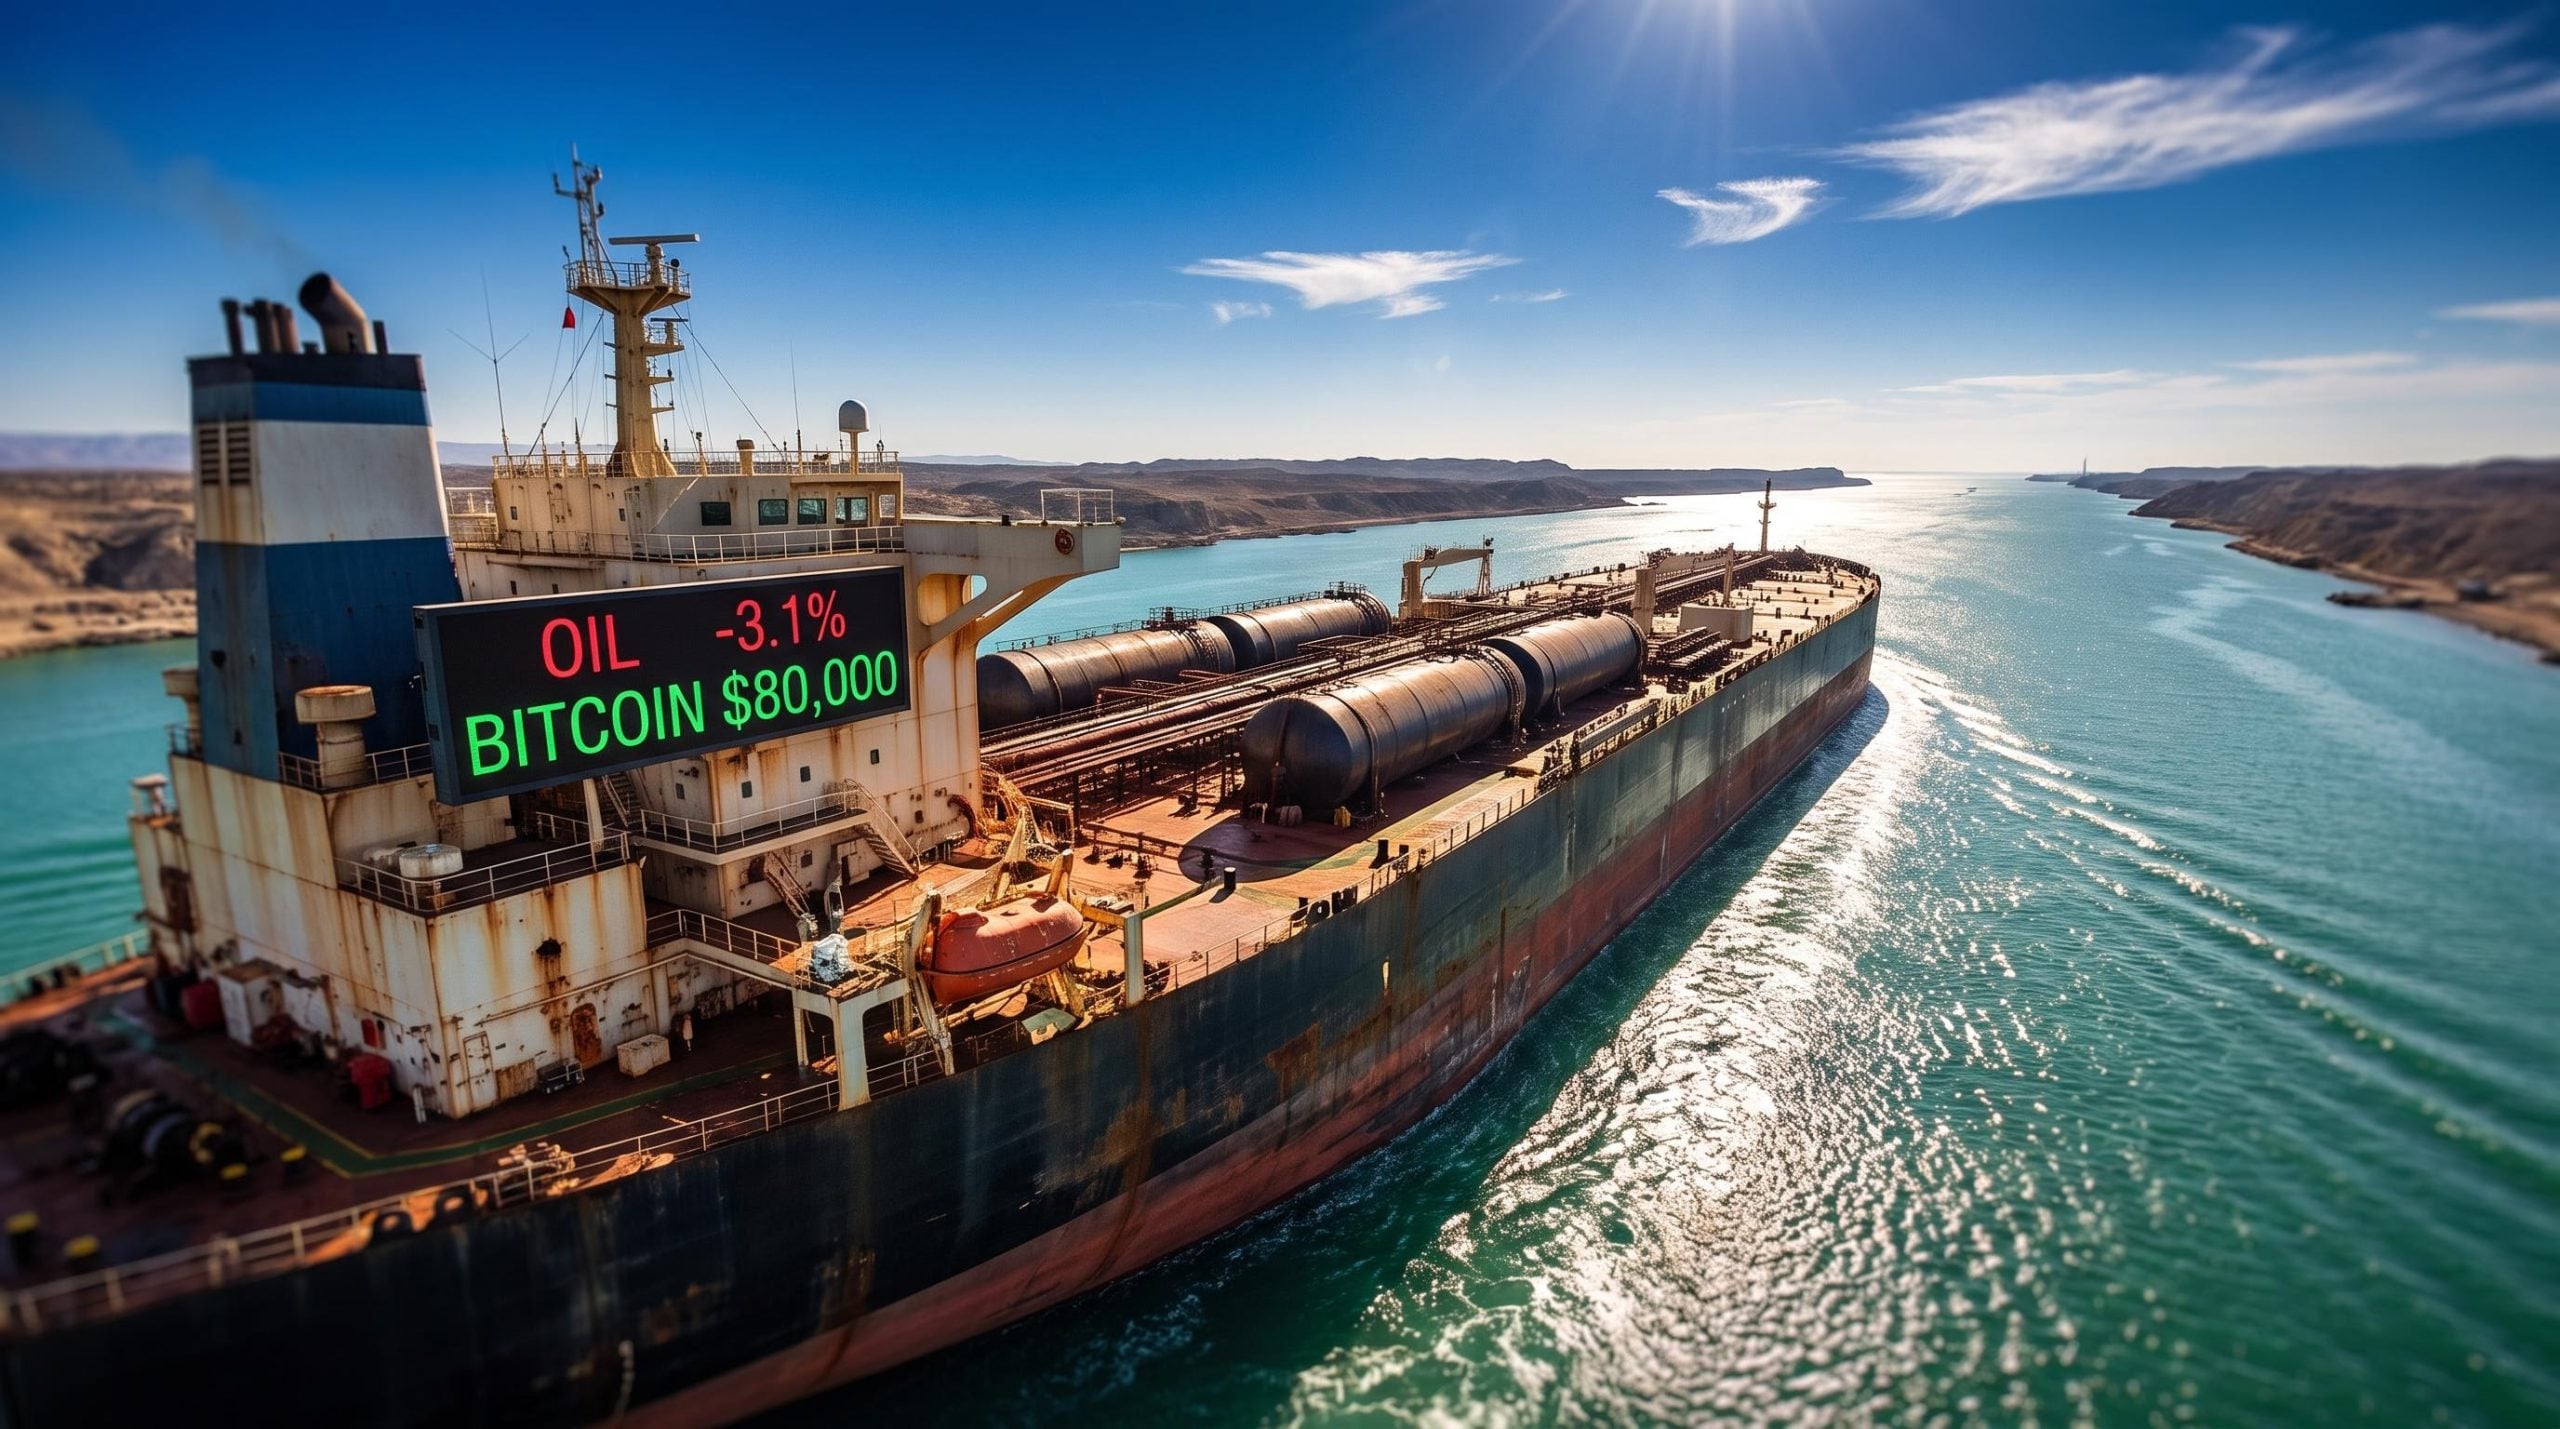
Oil and gold both fell on Wednesday. Bitcoin climbed above $80,000 for the first time in roughly three months, reclaiming a level not seen since May. On the surface, those three moves look like they belong in three different articles.
They don’t. A single geopolitical event, the declaration that the Strait of Hormuz had been cleared of mines, simultaneously unwound a supply-risk premium in crude, drained safe-haven demand from gold, and unlocked the risk appetite that carried crypto higher. One cause produced three asset-class reactions that only look contradictory until you understand the mechanism connecting them.
This piece builds the framework for reading those cross-asset divergence events in real time. Not just what happened in commodity and crypto markets this week, but the analytical map for understanding why the same catalyst sends different assets in opposite directions, and how to position when the next geopolitical pivot arrives.
How a mine-clearance announcement became a market catalyst
The fear had been accumulating since April 2026, when the U.S. military publicly announced mine-clearance operations in the Strait of Hormuz. Navy destroyers transited the passage as part of an effort to neutralise mines laid by Iran’s Revolutionary Guards, and for the first time in years, the world’s most important oil chokepoint carried an active threat designation.
The strait handles roughly one-fifth of global oil supply. That single statistic explains why a credible mine threat does not just reprice regional crude; it reprices energy risk for the entire market.
The Hormuz risk premium that built through May 2026 was not a simple function of supply disruption; VLCC daily hire rates tracking near $110,000 and the near-total withdrawal of commercial war-risk insurance created embedded costs that crude futures alone could not fully capture.
Over the following months, demining and escort operations continued. Analysts estimated dozens of mines had been neutralised. Key shipping lanes were being prepared for safe commercial transit. Then, in mid-to-late August 2026, U.S. officials declared the strait “open and operating,” stating that all water mines had been removed or detonated, and warning Iran that new minelaying would be met with force.
| Period | Event | Market implication |
|---|---|---|
| April 2026 | U.S. military announces mine-clearance operations; Navy destroyers transit the strait | Geopolitical risk premium begins building into crude and safe-haven assets |
| April-August 2026 | Ongoing demining; dozens of mines neutralised; key lanes prepared for safe shipping | Risk premium remains elevated but sophisticated participants begin incremental unwinding |
| Mid-to-late August 2026 | U.S. officials declare strait “open and operating”; all mines reported removed or detonated | Risk premium collapses rapidly; markets reprice across asset classes |
Markets priced the political announcement without waiting for full independent verification from the International Maritime Organisation (IMO), the body that formally certifies navigational safety. That gap between political clearance and operational certification is not a procedural footnote. It tells you why residual risk premiums rarely vanish completely in a single session, and understanding that lag separates a sophisticated read of the price action from a surface-level one.
The IMO survey and certification framework establishes the formal verification standards that underpin navigational safety declarations, which is why the gap between a political all-clear and full operational certification carries measurable market significance.
When big ASX news breaks, our subscribers know first
Oil fell because the fear premium did, and gold followed for the same reason
Traders had been bidding up WTI crude relative to what supply and demand fundamentals would otherwise support. For months, the perceived probability of a catastrophic supply disruption through the Hormuz chokepoint sat embedded in every barrel’s price. Once the mine-clearance narrative solidified, the gap between fear-premium-inflated price and fundamental price closed rapidly.
A geopolitical risk premium embedded in crude does not sit in isolation; Goldman Sachs estimated that a sustained $10-$20 per barrel crude increase adds several tenths of a percentage point to US headline CPI, meaning the same fear premium this article examines in oil also ran through inflation expectations and bond yields across the May 2026 escalation.
The key WTI price reference points from the session tell the story:
- Intraday high: mid-$80s per barrel
- Session close: settling in the vicinity of $82 per barrel, after shedding roughly -3.1% on the day
- August 2026 average: low-to-mid $80s, consistent with crude reverting to fundamental drivers
That -3.1% single-session drop was not a sudden reversal from elevated levels. It extended earlier declines of roughly 1-2% across preceding sessions, an important distinction. Sophisticated market participants had already been unwinding the fear premium incrementally as demining progressed. The final announcement was confirmation, not surprise.
Gold’s retreat followed the same logic but through a different mechanism. Gold functions as a barometer of fear rather than purely an inflation hedge. When worst-case scenarios feel plausible, gold attracts inflows as insurance against tail-risk events. When those scenarios are credibly resolved, demand for a non-yielding insurance asset fades as capital rotates back toward instruments with higher expected returns.
Gold pulled back as Middle East tensions eased, losing the upward momentum that geopolitical anxiety had been providing. The move was also shaped by ongoing macro drivers, including real interest rates, dollar strength, and central-bank buying patterns, but the directional trigger was the same one that hit crude: the fear premium came out.
Why gold moved in the same direction as oil
The instinct is to think of oil and gold as belonging to separate analytical buckets, one a commodity, the other a safe haven. In a geopolitical de-escalation, both carry the same embedded cargo: a premium built on the probability of a worst-case scenario. When that probability drops, both shed it. The difference between a commodity trading on fundamentals and one carrying a geopolitical premium is the practical skill this pattern builds. The same asset can be correctly valued at two very different prices depending on which regime is active.
What Bitcoin above $80,000 tells you about risk sentiment
An asset with no connection to oil supply rose on the same day oil fell. That apparent paradox dissolves once you understand where Bitcoin sits on the risk spectrum.
Bitcoin functions as a risk-on asset, meaning it responds to shifts in investor sentiment and liquidity conditions rather than to commodity supply dynamics directly. A risk-on asset is one that tends to attract capital when investors feel confident about the economic outlook and willing to accept higher volatility in exchange for higher potential returns. When fear recedes from markets, capital flows toward these higher-risk, higher-reward instruments, and Bitcoin is among the most sensitive barometers of that shift.
The three drivers of Bitcoin’s move, ranked by analytical importance:
- Risk sentiment returning. The same psychological shift that removed fear premiums from oil and gold redirected capital toward speculative assets. Bitcoin benefited directly from the swing back toward risk-on positioning.
- Favourable liquidity conditions. Available liquidity in August 2026 amplified price momentum, consistent with how crypto markets typically respond when broader financial conditions ease.
- Technical breakout above the $80,000 level. The psychological importance of reclaiming this threshold, the highest since mid-May, meant that once price pushed through and held, trend-following and momentum strategies added exposure, reinforcing and extending the move.
The breadth of the crypto move confirmed this was a risk-appetite shift, not a Bitcoin-specific event. Ethereum and XRP both recorded solid gains across the same session, pointing to strength across the broader asset class rather than a single-coin event, in line with a generalised improvement in investor sentiment.
The capital flow dynamics of early August 2026 provide useful context for the Bitcoin move: the same week that saw $53.7 billion flow into money market funds also recorded simultaneous inflows into equities and crypto, confirming that the risk-on appetite carrying Bitcoin above $80,000 was operating alongside, not instead of, broad defensive positioning.
Bitcoin’s move above $80,000 is not primarily a crypto story. It is a risk-sentiment signal, and reading it that way gives you a real-time gauge of where institutional appetite sits at any given moment. For anyone who thinks of crypto and commodities as separate universes, this session demonstrated why cross-asset literacy matters: the same macro shift that moved WTI by 3% moved Bitcoin measurably in the opposite direction.
One cause, three market responses: the unified framework
The surface-level divergence resolves into a single coherent pattern once you place each asset on the risk spectrum. Crude oil, gold, and Bitcoin all responded to the same upstream input, a sharp reduction in the perceived probability of a catastrophic supply disruption, but in directions determined by each asset’s portfolio function.
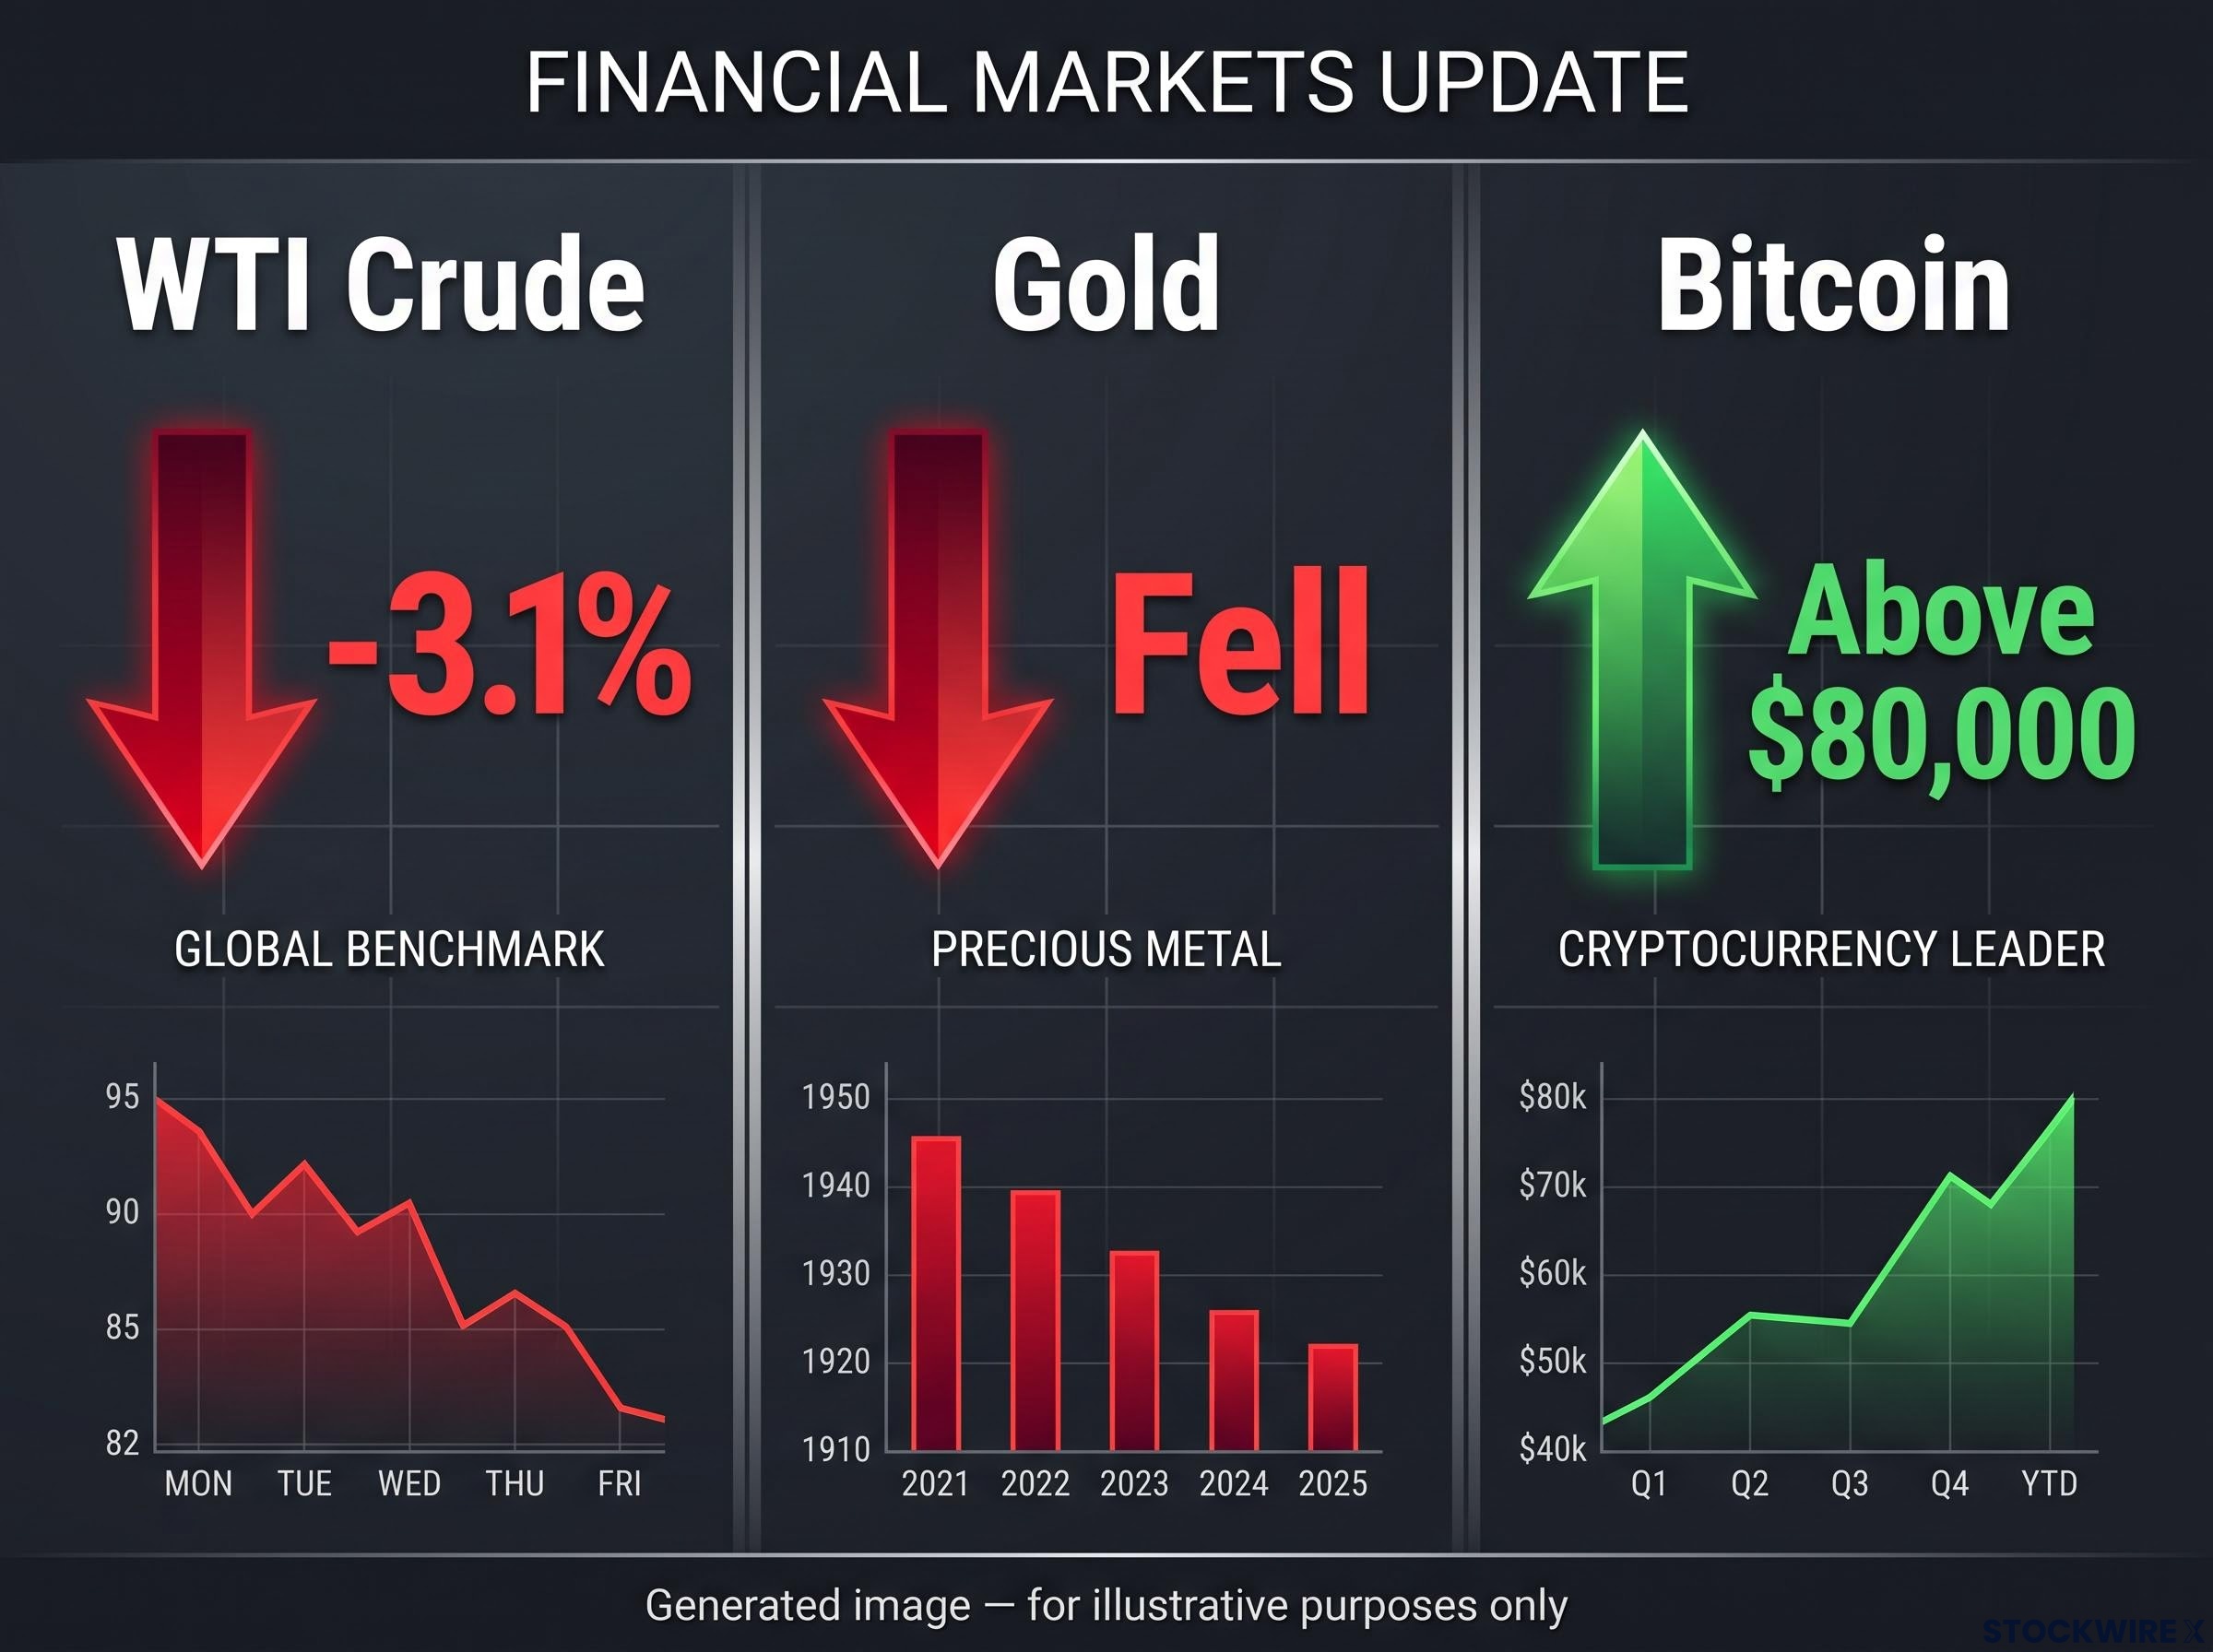
| Asset | Role in portfolio framework | Reaction to fear removal | Key metric |
|---|---|---|---|
| WTI Crude | Supply-risk-sensitive commodity | Fell | -3.1% single session |
| Gold | Safe-haven / tail-risk hedge | Fell | Directional retreat; safe-haven flows reversed |
| Bitcoin | Speculative / risk-on asset | Rose | Above $80,000; highest since mid-May |
Fear premiums came out of the assets that hold them. Risk appetite returned to assets that benefit from it. Liquidity conditions in August 2026 acted as an amplifier rather than an independent cause: when geopolitical relief provided the directional signal, available liquidity determined the speed and magnitude of the repricing.
A rigorous read of this pattern requires three caveats:
- Political versus operational clearance. The U.S. announcement was politically authoritative, but full IMO certification represents an additional step. Markets priced the announcement; they did not wait for certification. This is why some residual risk premium may persist even after an official all-clear.
- Oil’s move as trend extension. The -3.1% session drop accelerated an existing multi-day downtrend, not a sudden reversal from highs. The risk premium had been partially unwinding before the final announcement.
- Bitcoin’s rally as multi-driver. Hormuz-driven risk-on sentiment contributed, but the move was also shaped by technical momentum, liquidity conditions, and broad crypto market dynamics. The geopolitical catalyst was the trigger; these factors determined the magnitude.
The next time a geopolitical risk event resolves, this framework tells you which assets to watch for moves in which direction before the price action unfolds. That anticipatory capacity is where the analytical edge lives.
Positioning for the next geopolitical pivot
The Hormuz resolution has reset the baseline, but it has not eliminated geopolitical risk. Three forward variables will determine whether the current calm persists or the next repricing arrives sooner than markets expect:
- IMO certification. The outstanding procedural step that could reintroduce residual risk premium if delayed, contested, or complicated by new intelligence. Until formal certification is complete, the gap between political announcement and operational verification remains a live variable.
- Iran’s response. Whether Tehran accepts the current status quo or responds with fresh activity in the strait is the binary risk that sits underneath the market’s current pricing. U.S. officials warned that new minelaying would be met with force, but warnings and outcomes are different things.
- OPEC+ policy intersecting with demand fundamentals. With the geopolitical premium removed, oil now trades primarily on supply-demand drivers. OPEC+ production decisions and global inventory levels are what will determine whether WTI holds in the low-to-mid $80s or finds a new range.
Bitcoin’s position above $80,000 functions as a risk-sentiment gauge worth monitoring alongside traditional macro indicators. As long as that level holds, the broad risk-on signal remains intact across asset classes.
The current calm is not a conclusion. It is the condition that will make the next disruption, when it comes, all the more jarring to markets that have priced geopolitical risk out. Cross-asset divergence events like this week’s are not anomalies to be puzzled over; they are recurrent structural patterns. The framework built here is the tool for reading the next one in real time.
For investors wanting to apply this cross-asset framework before the next diplomatic headline rather than after it, our dedicated guide to mapping policy-driven market risk examines how three 2026 geopolitical events produced single-session equity swings that dwarfed any economic data release, and walks through the anticipatory positioning logic.
This article is for informational purposes only and should not be considered financial advice. Investors should conduct their own research and consult with financial professionals before making investment decisions. These statements are speculative and subject to change based on market developments and company performance.