
The Federal Reserve has not cut rates once in 2026, yet 10-year Treasury yields fell 4 basis points in a single session last week. The mechanism responsible is not monetary policy. It is the US Treasury’s own chequing account.
The Treasury General Account (TGA), the federal government’s operating balance held at the Fed, sits near $950 billion, roughly $350-$400 billion above the department’s stated target of $550-$600 billion. Treasury announced on 19 August 2026 that it would expand its long-bond buyback programme by at least doubling the per-operation cap, raising it from $2 billion to a minimum of $4 billion, covering 10- to 30-year nominal coupon securities across a window running from 9 September through 4 November. If those purchases are funded by drawing down the TGA rather than issuing new bills, the effect is reserve injection combined with long-duration supply reduction: a combination that looks, mechanically, like a lighter version of quantitative easing.
Long yields have been acting as a supplementary tightening force, and Treasury is now pressing in the opposite direction through a channel that sits entirely outside the Fed’s authority. Here is how to tell whether this is a technical adjustment or a genuine shift in financial conditions, why the funding source is the variable that determines the answer, and which three indicators to watch as Jackson Hole and the PCE release arrive this week.
Why the Treasury’s chequing account is the mechanism that matters
The TGA is not a special-purpose tool. It is simply where the federal government holds the cash it collects from taxes and past borrowing, maintained as an account at the Federal Reserve. What makes it unusual right now is scale. At roughly $935-$940 billion by late August estimates, with projections suggesting a peak above $1 trillion in late October, the balance is far larger than the $550-$600 billion the Treasury had previously targeted.
The TGA is not a special-purpose tool, and its effect on bond yields is best understood through the mechanics of supply and demand in the secondary market, where any reduction in long-duration paper available to private buyers compresses yields through price, not policy.
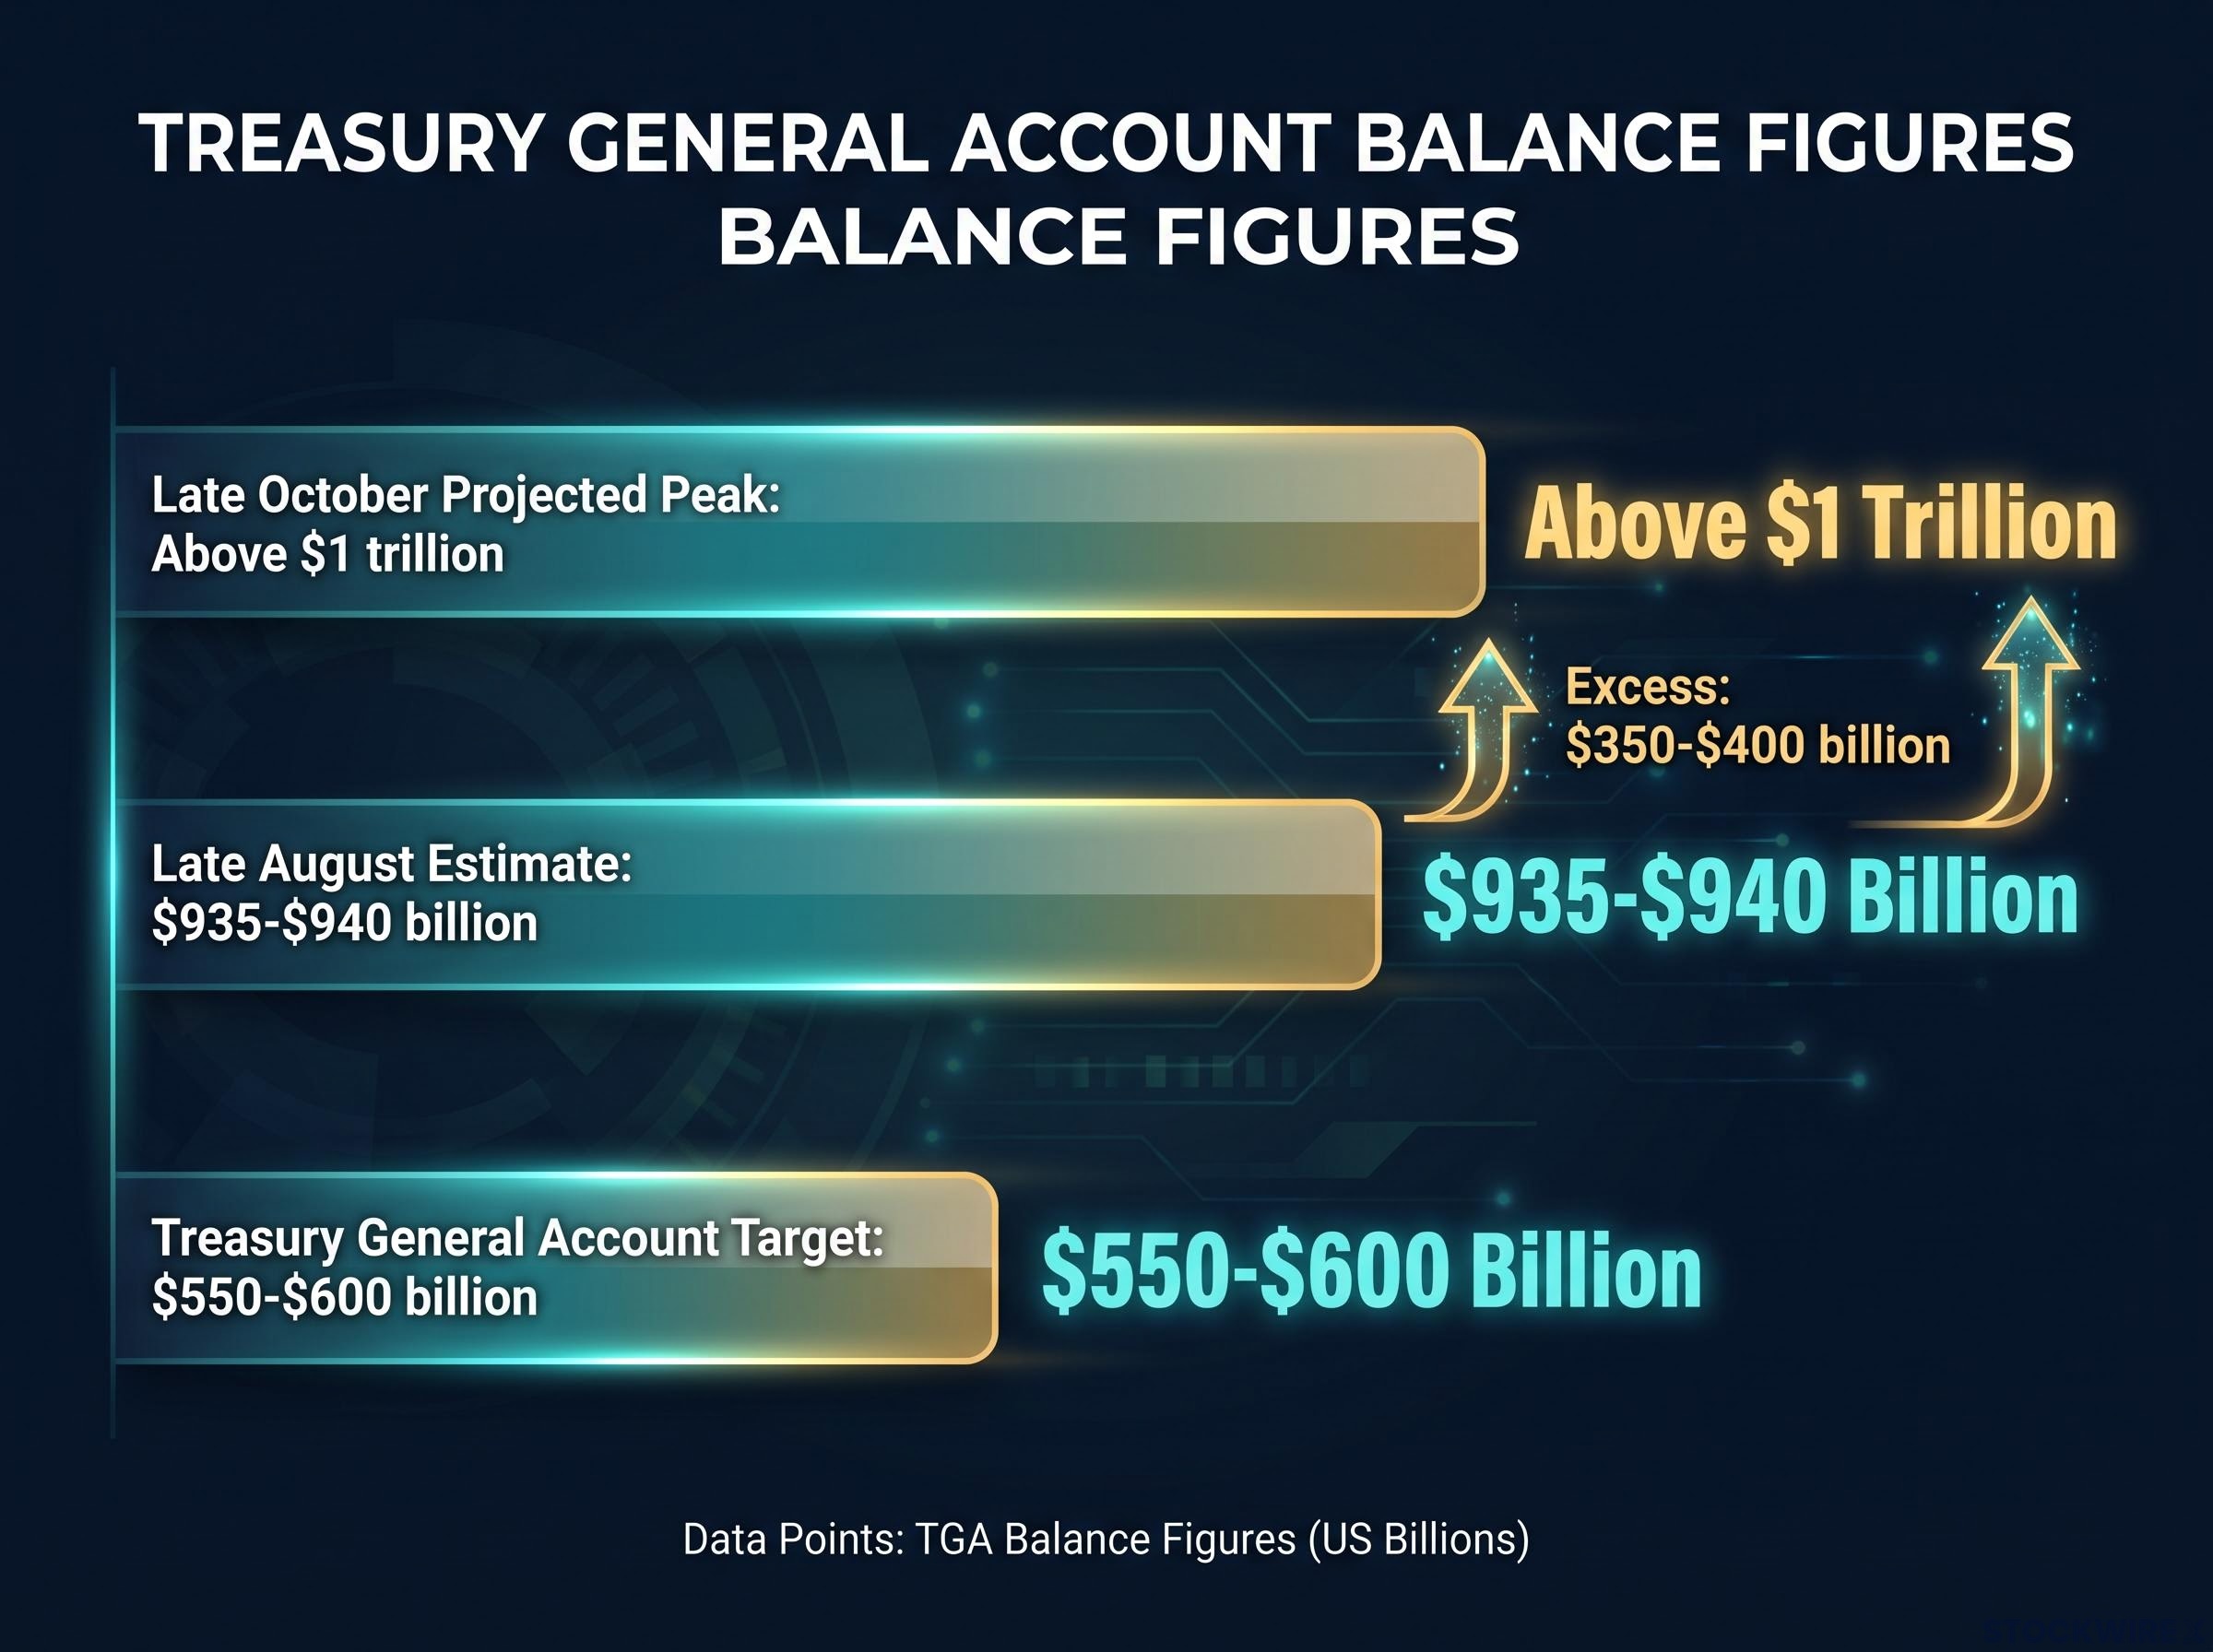
That excess creates optionality. When Treasury uses some of that cash to buy back long-dated bonds, it is spending money already parked at the Fed back into the financial system. Reserves rise. Long-duration supply falls. The combination is what earns the “stealth easing” label, but the label only applies under one specific condition.
Bills versus TGA: the operative variable
The same buyback can produce two entirely different outcomes depending on where the funding comes from.
| Funding Source | Effect on Reserves | Effect on Long-Duration Supply | Fed Tool Analogy |
|---|---|---|---|
| New bill issuance | Broadly unchanged (new debt absorbs cash paid out) | Reduced (long bonds retired) | Duration swap (maturity shortening) |
| TGA drawdown | Increases (previously collected funds re-enter system) | Reduced (long bonds retired) | Lighter-form QE (reserves up, duration down) |
Bill-funded buybacks are a duration swap: they shorten the average maturity of outstanding debt without injecting net cash. TGA-funded buybacks do both at once. Legal authority for these operations comes from statute permitting the use of general funds to buy, redeem, or refund outstanding government securities. No bonds had been purchased under the enlarged programme as of late August, and the next sizing decision arrives at the 4 November Quarterly Refunding.
The gap between the $950 billion actual balance and the $550-$600 billion target tells you that Treasury has accumulated substantial dry powder. How that powder is deployed determines whether this programme is a technical adjustment or something closer to reserve injection, and the announced structure leaves both doors open.
When big ASX news breaks, our subscribers know first
What this does to yields, and what the market has already priced
Markets moved before a single bond was purchased. Following the 19 August announcement, the 10-year yield fell to approximately 4.66%-4.70%, a decline of around 4 basis points, and the 30-year dropped to approximately 5.19%-5.23%. The signalling effect alone repriced the long end.
That tells you the mechanism works at the margin. The question is whether it works at scale.
Even at $4 billion per operation repeated multiple times, the programme is small relative to total long-end supply and the volume of new issuance tied to ongoing deficits. Incremental liquidity support is estimated at a minimum of $14 billion this quarter. Set against the outstanding stock of long-dated Treasuries, the mismatch is stark, and the institutional consensus reflects it.
Operation Twist, the 2011-2012 Maturity Extension Programme capped at $667 billion and operating under the most favourable conditions then available, delivered only approximately 15 basis points of long-end yield reduction, setting a historical ceiling against which the current programme’s bounded scale should be benchmarked.
Deutsche Bank contends that where TGA funds are deployed, any boost to bank reserves will be substantially counteracted, leaving the net effect on money markets modest at best.
The scepticism is broad:
- Deutsche Bank: Reserve gains from TGA-funded buybacks will be largely counteracted, keeping net money-market easing limited
- Goldman Sachs and Wells Fargo: Persistent fiscal deficits and stubborn inflation remain the dominant forces behind elevated long yields; buyback operations at current scale cannot drive a significant repricing
- ING: The choice of funding source is unlikely, on its own, to generate a meaningful or durable reduction in longer-dated yields
The 4-basis-point move on announcement confirms that markets treat this as a real factor. The institutional consensus that structural forces dominate confirms it is not yet large enough to be durable easing in its own right. What you are watching is a margin-level adjustment, not a regime change, and the next inflation print could reverse the move entirely.
How fiscal easing collides with monetary tightening
The reason this matters beyond bond-market mechanics is that higher long-term borrowing costs have been acting as a de facto brake on the economy, reducing the pressure on the Fed to raise its policy rate further in pursuit of the 2% inflation target. Senior Fed officials have pointed to this dynamic publicly, treating elevated market yields as a partial substitute for additional rate increases.
Treasury is now applying pressure in exactly the opposite direction, and the Fed has no formal lever to stop it.
The policy architecture behind sustained TGA-funded buybacks maps closely onto financial repression, the deliberate use of institutional tools to hold sovereign borrowing costs below market-clearing levels, a framework with historical precedent in the 1942-1951 period when the Treasury held yields at artificially low rates to erode the real value of wartime debt.
The Fed’s countermeasure and its limits
The Fed controls short-term rates and its own balance sheet. Treasury controls debt management choices and the TGA. There is no coordination mechanism that gives FOMC members input over TGA drawdown scale.
That leaves one countermeasure: communication. More hawkish guidance on the future path of short-term rates, delivered through speeches, projections, and the Jackson Hole platform, can push short-end yields higher. But it cannot directly counter Treasury’s demand at the long end.
The downstream effects of falling long yields make the stakes concrete:
- Mortgage rates decline, loosening housing-market conditions
- Corporate borrowing costs fall, making it cheaper for firms to finance expansion
- Risk assets receive potential support as the discount rate on future earnings compresses
The market is already adjusting. Market pricing at the time of reporting put the probability of a rate hike at the 16 September meeting at approximately one-third, compared with close to 60% in the wake of the July meeting (these are unverified estimates reflecting market pricing, not confirmed Fed guidance). That probability shift tells you markets are incorporating easing financial conditions into their rate-path expectations before a single bond under the enlarged programme has been purchased.
The question for your positioning is not just what the Fed decides on 16 September, but how aggressively it will lean against the easing that Treasury is already engineering through a separate, legal channel.
Jackson Hole, the PCE release, and what tips the balance
Two events this week determine whether the Fed can reassert a tightening narrative or whether the market’s growing conviction in Treasury-driven easing solidifies.
Arriving on Friday at 14:00 GMT, the Jackson Hole keynote represents the last point at which Fed communication can meaningfully shift market pricing before the 16 September vote. The PCE release, the Fed’s preferred inflation gauge, arrives Wednesday.
The binary is clean. If inflation data stay firm, the Fed has justification to sound hawkish and push back against the market’s easing assumption. If inflation and growth soften, markets will likely embrace lower long yields as consistent with a broader trajectory toward eventual rate cuts.
| Event | Date / Timing | Market Expectation | Implications for Fed-Treasury Dynamic |
|---|---|---|---|
| Core PCE inflation | Wednesday, 12:30 GMT | 0.2% m/m, 3.3% y/y (unverified projections) | Firm: Fed hawkish cover. Soft: validates Treasury easing narrative |
| Q2 GDP second estimate | Wednesday | 1.5% annualised (unverified) | Weak: reinforces growth concerns. Strong: supports Fed tightening case |
| Personal spending | Wednesday | 0.2%, down from 0.3% (unverified) | Weakness supports easing expectations; strength complicates them |
| Jackson Hole keynote | Friday, 14:00 GMT | Hawkish lean expected | Tone sets short-end pricing into September vote |
A preliminary benchmark revision to nonfarm payrolls is also due around the same time as Jackson Hole, though analysts expect it to draw considerably less market attention than the keynote. The PCE number is the real test: a firm reading gives the Fed narrative cover to sound hawkish and counteract the market’s growing conviction that Treasury has already done some of the Fed’s easing work for it.
Three variables to watch beyond this week: 1. The actual size and persistence of long-end buybacks relative to total issuance (next decision: 4 November Quarterly Refunding) 2. The trajectory of inflation and growth data, which determines how aggressively the Fed leans against unintended easing 3. Market expectations for deficits and inflation, the core medium-term yield drivers
What the correction changes, and what it does not
The core asymmetry this analysis has established is real but bounded. Treasury can nudge long yields lower and inject liquidity at the margin through TGA-funded buybacks. It cannot overpower the structural forces of large deficits and sticky inflation that remain the primary determinants of where long rates settle.
The practical read: treat TGA-funded buybacks as a marginal, technical easing until the scale reaches a level where it visibly competes with total long-end issuance. The current programme, at $4 billion per operation between 9 September and 4 November, does not reach that threshold. The net institutional assessment, spanning Deutsche Bank, Goldman Sachs, Wells Fargo, and ING, is that the “stealth easing” framing is directionally sound but the programme is not large enough at current scale to constitute a regime shift.
The real-time indicator to watch is the yield curve’s shape. If short-dated yields stay elevated on Fed guidance while long yields drift lower on Treasury demand, a steepening curve is the market pricing in easier conditions at the long end regardless of what the Fed says. That is the signal that Treasury is winning the short-term tug-of-war, and it should inform how you think about duration exposure and rate sensitivity heading into the 16 September decision.
A steepening curve, where short-dated yields stay elevated on Fed guidance while long yields drift lower on Treasury demand, also loosens credit supply by widening bank net interest margins and making new loan origination more economically attractive, compounding the easing impulse the current article’s three indicators are designed to track.
This article is for informational purposes only and should not be considered financial advice. Investors should conduct their own research and consult with financial professionals before making investment decisions. Forward-looking statements, including data projections and rate-path expectations referenced above, are speculative and subject to change based on market developments and policy decisions.