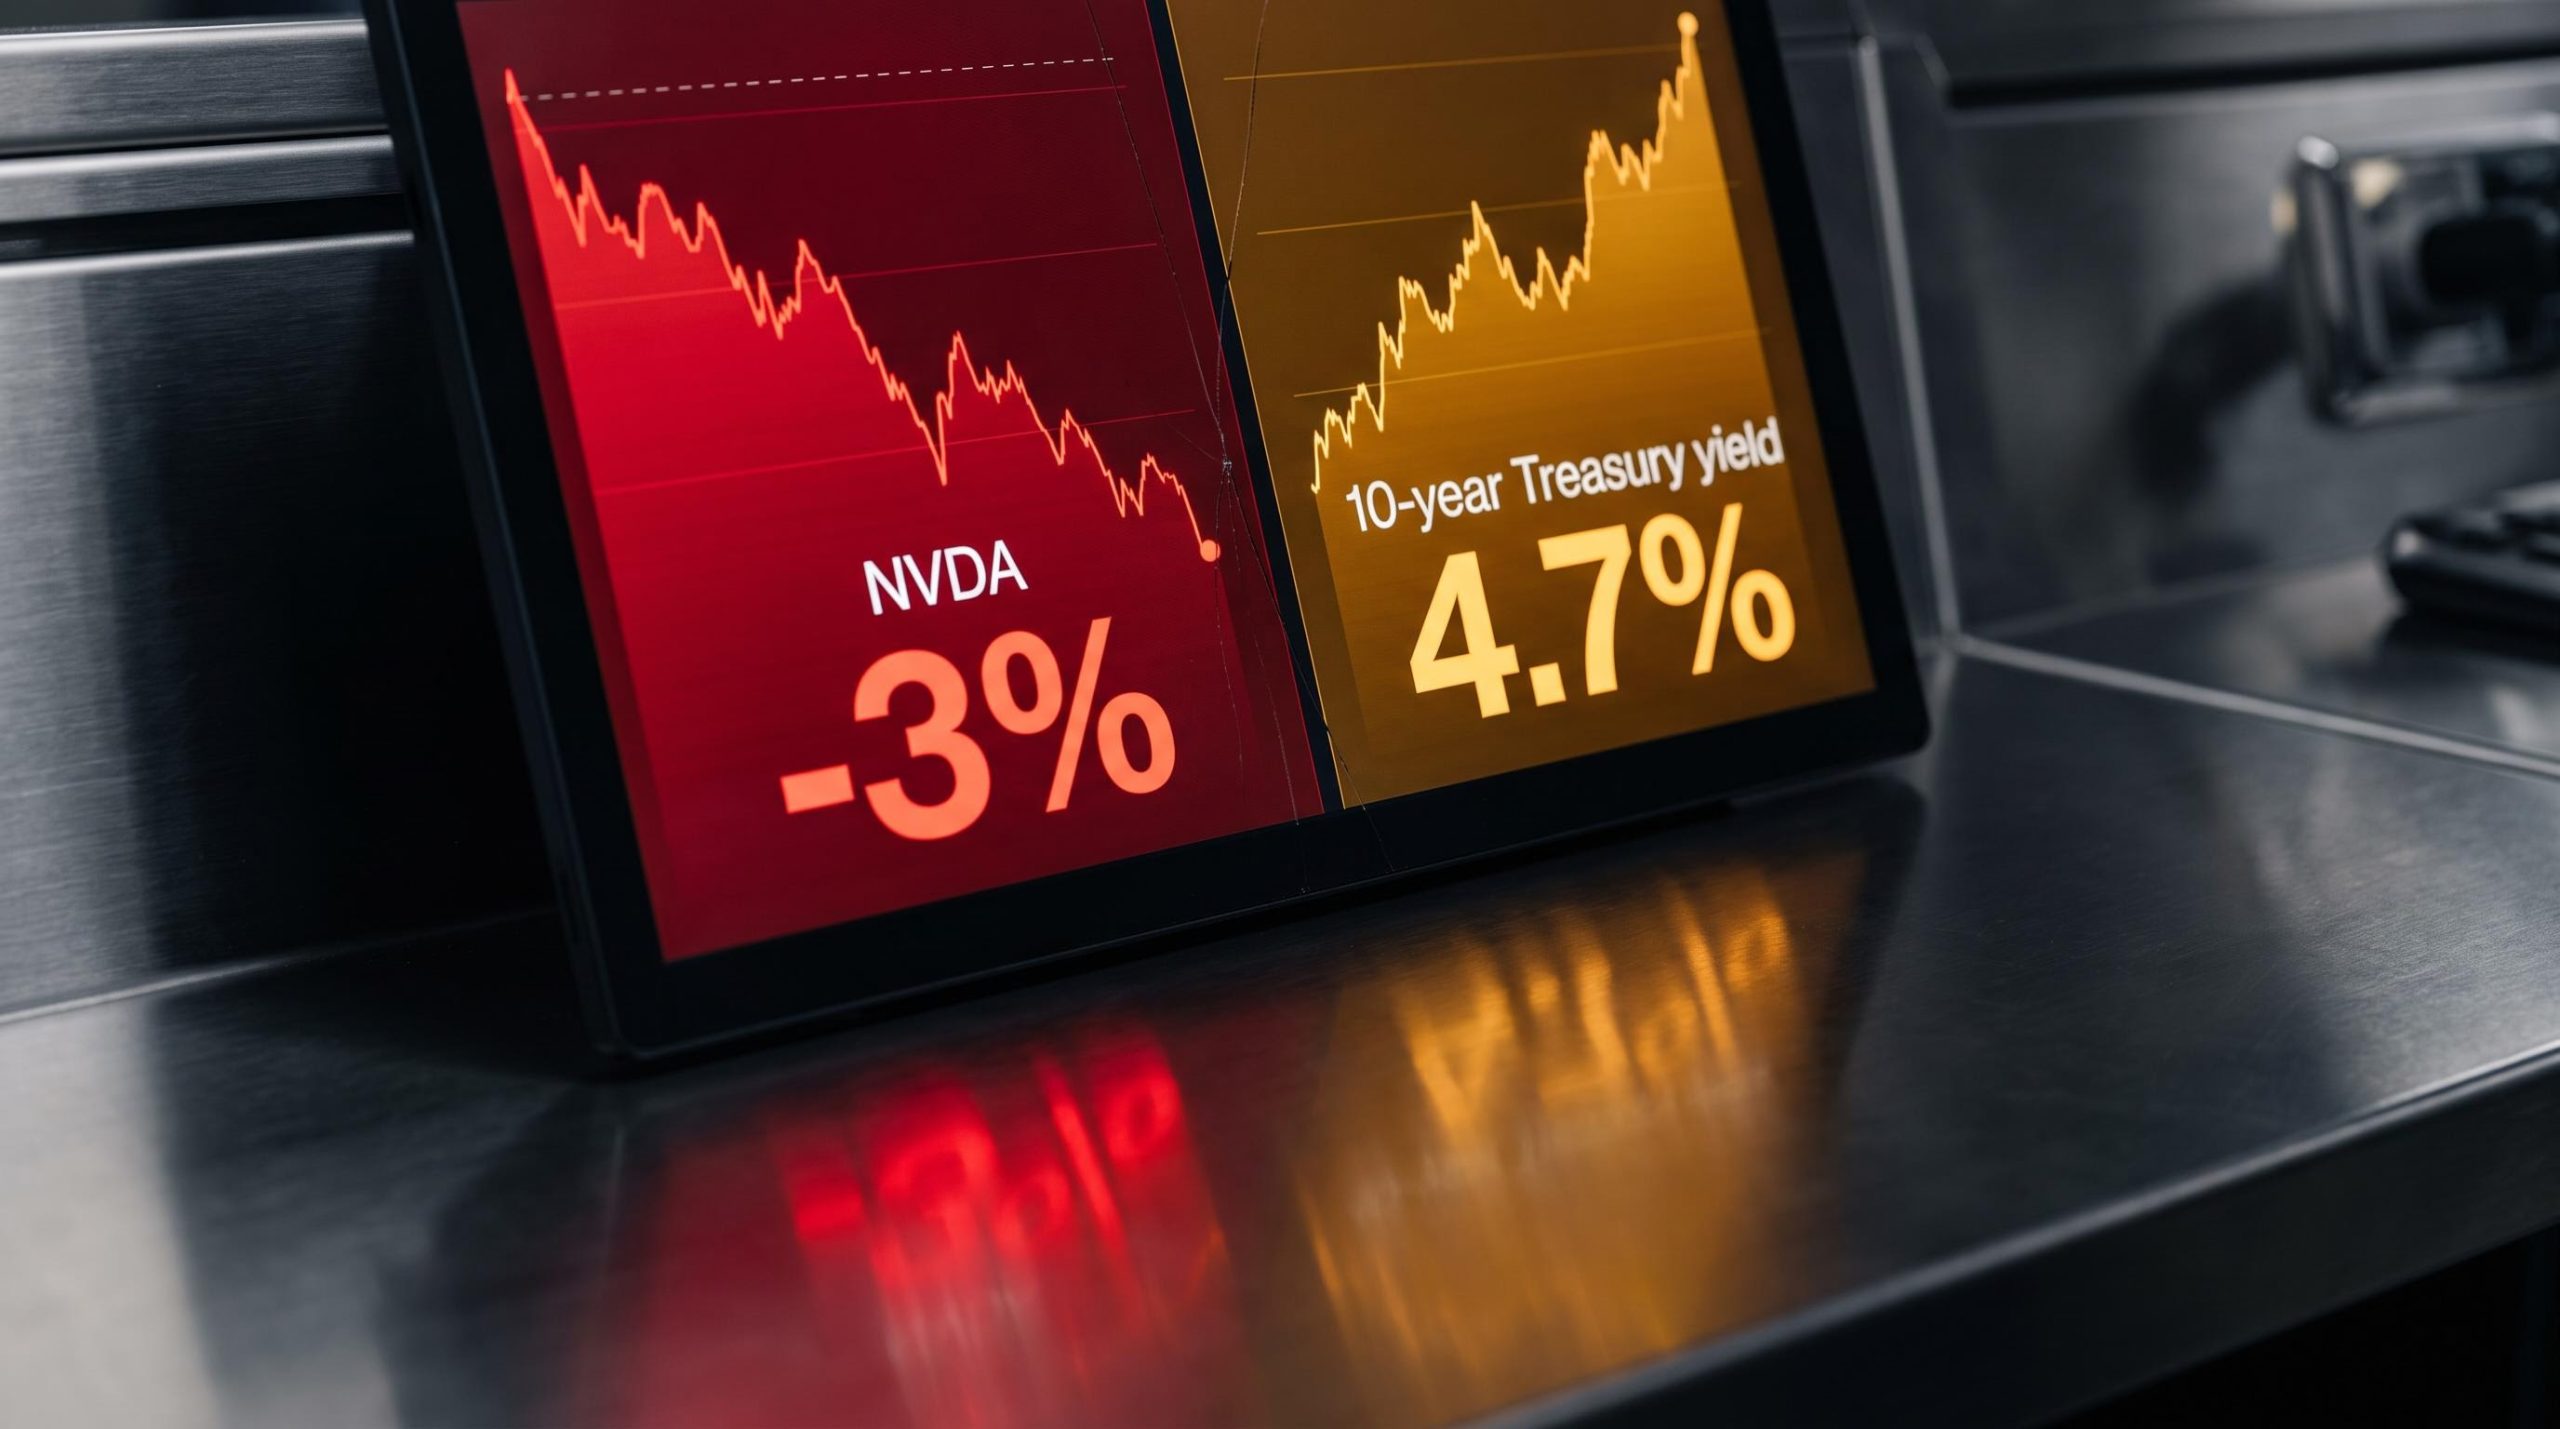
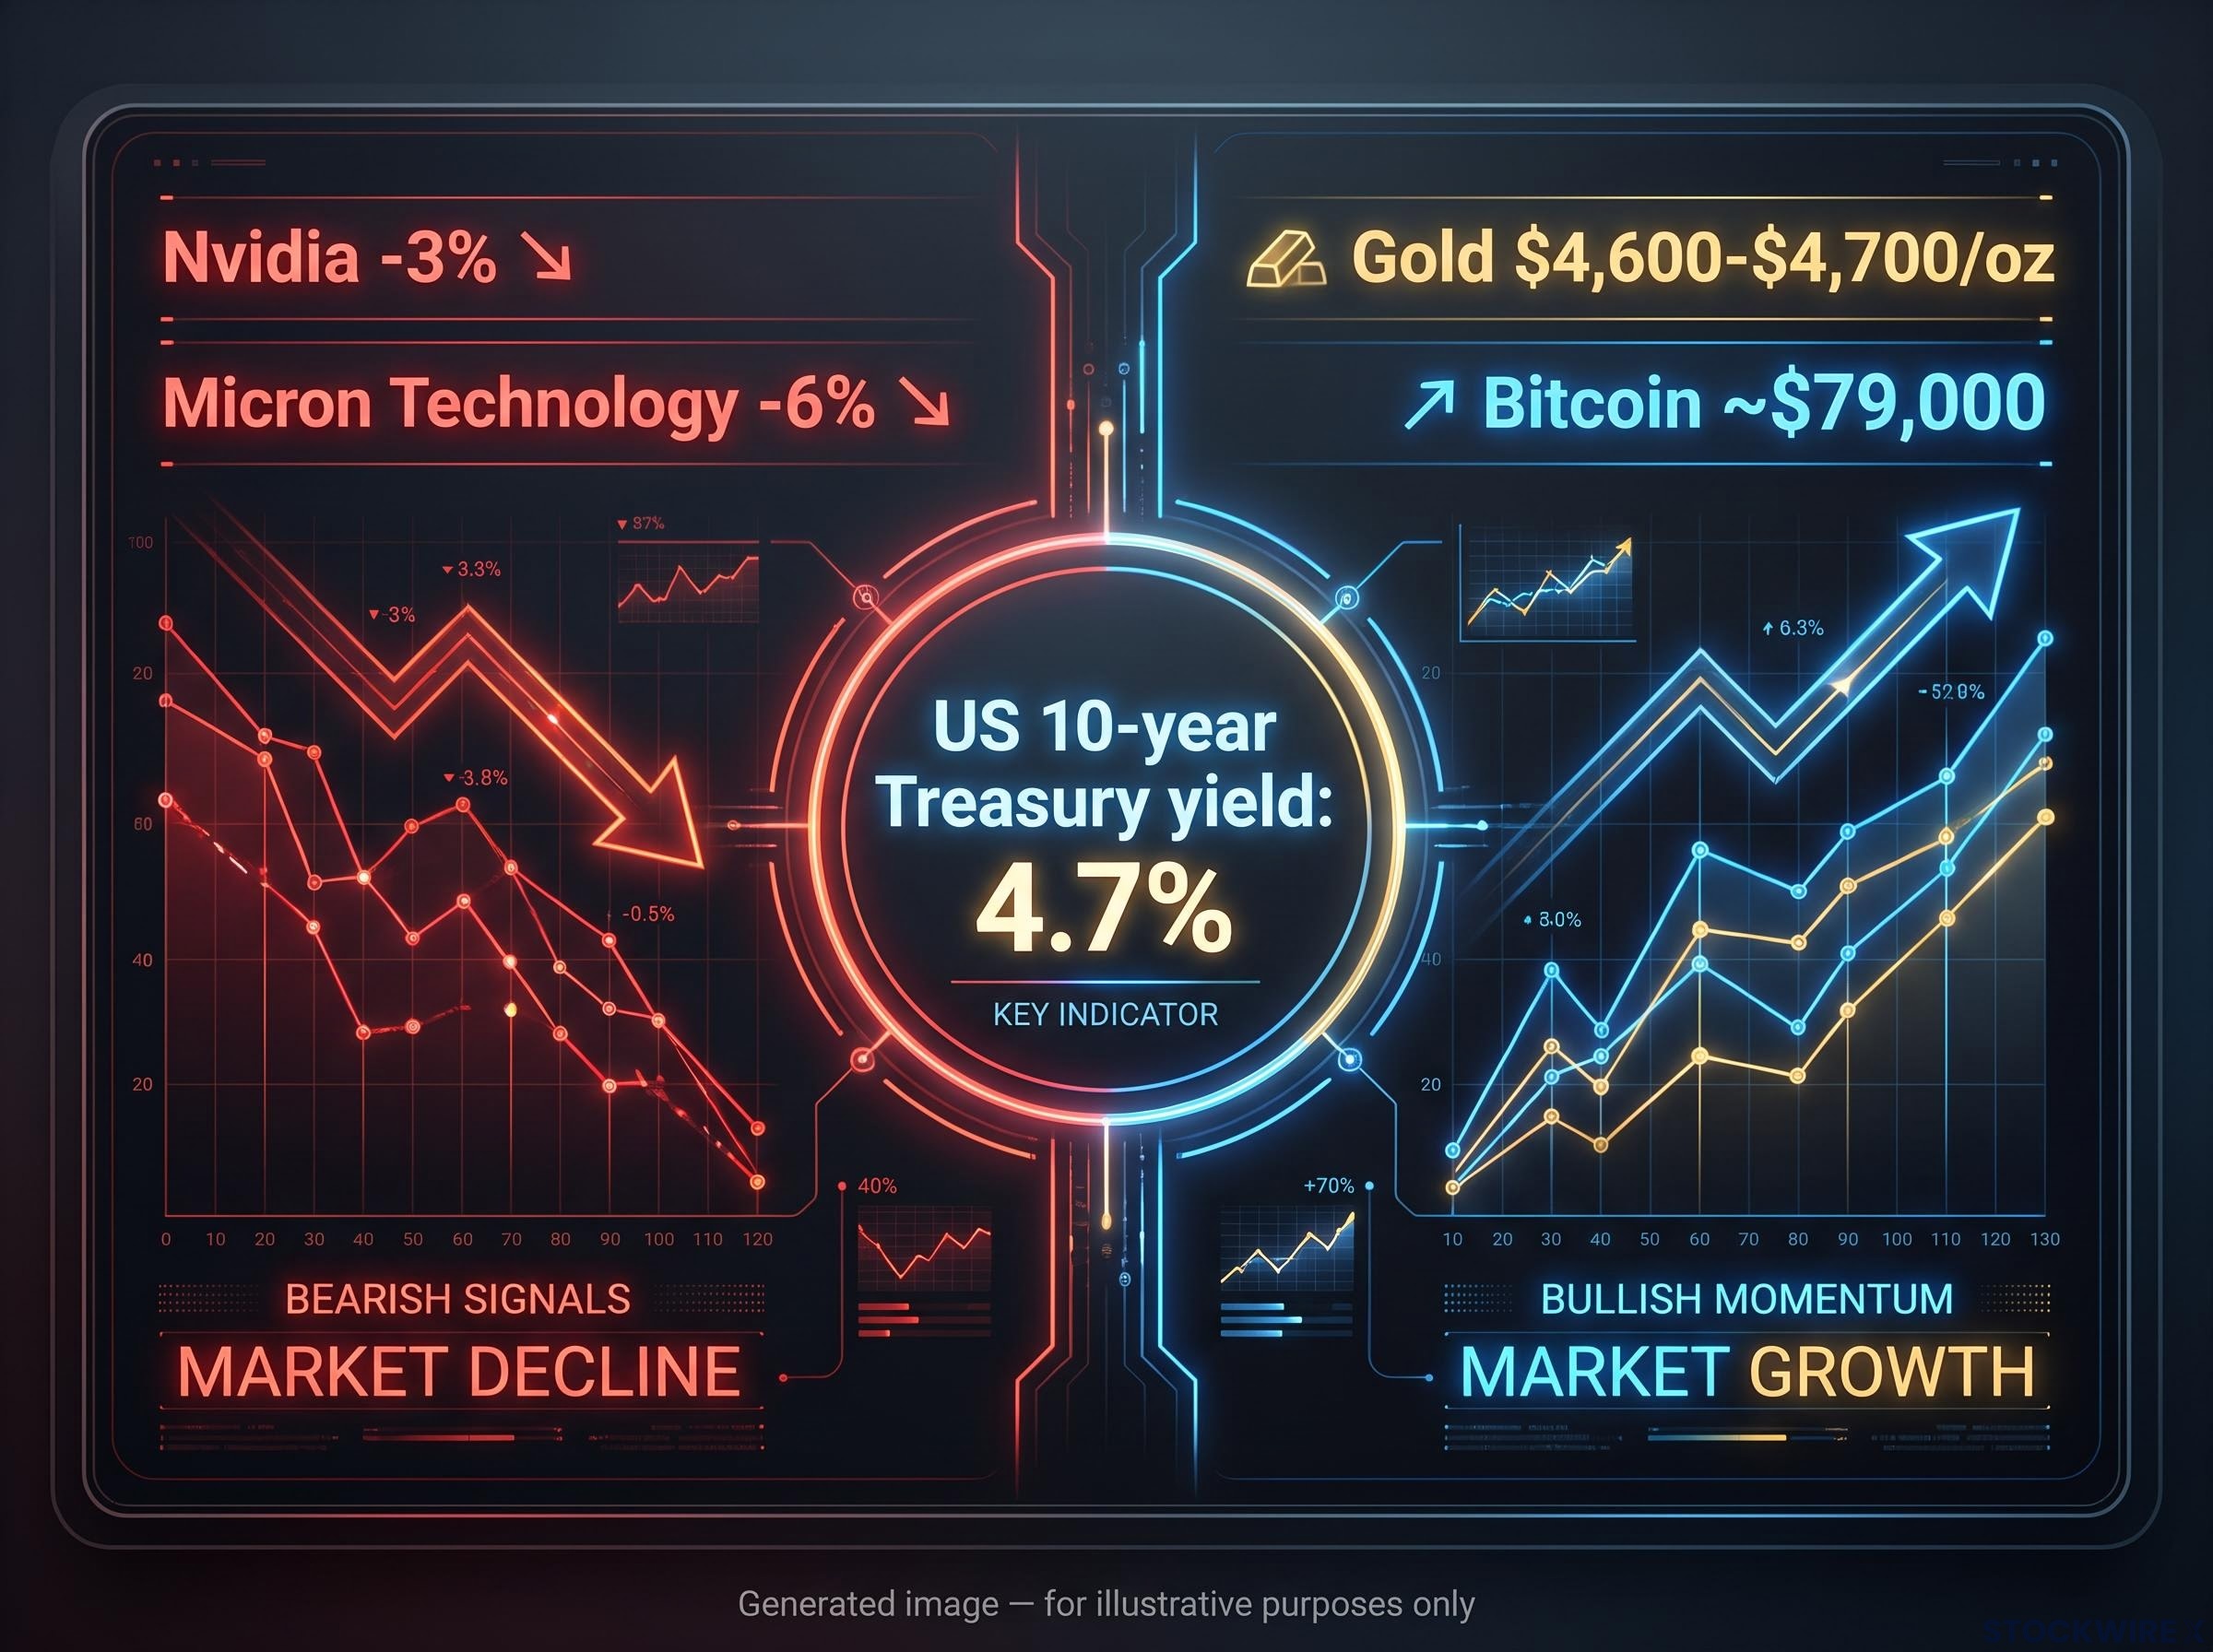
On the same trading day, Nvidia fell roughly 3%, Micron Technology dropped nearly 6%, gold pushed toward record highs, and Bitcoin hovered close to $79,000. Professional investors were selling some of the market’s most celebrated technology names while simultaneously paying premium prices for the two assets most associated with fear and inflation protection.
That combination looks like a contradiction. It is not. The US 10-year Treasury yield sitting at 4.7% is the structural force connecting every one of these moves, and once you see how it links them, the apparent chaos resolves into a coherent macro signal.
Here is a framework for reading what each asset is actually measuring, so the next time four markets appear to send four conflicting messages, you have a diagnostic process rather than a headline-driven reaction.
Why AI and semiconductor stocks are selling off now
The selloff in AI and semiconductor names is a repricing of expectations, not a verdict on AI as a technology. Nvidia’s roughly 3% overnight decline and Micron’s nearly 6% drop during the same session reflect a market that is no longer willing to pay yesterday’s premium for cash flows that may not arrive until the end of the decade.
The mechanics are straightforward. Richly valued growth stocks derive most of their value from earnings projected far into the future. When discount rates rise, the present value of those distant cash flows shrinks. A 4.7% 10-year yield applies a heavier discount to every dollar of projected 2030 or 2032 AI revenue than a 3% yield did, and that compression hits the highest-multiple names hardest.
The discount-rate channel operates mechanically regardless of whether underlying earnings have changed: a 100-basis-point increase in long-term real rates has historically compressed advanced-economy price-to-earnings ratios by 10-15%, meaning a portfolio full of high-multiple AI names carries structural yield sensitivity that earnings beats alone cannot offset.
NBER research on interest rates and equity duration provides the academic foundation for this mechanical relationship, demonstrating that higher discount rates compress present values most sharply for long-duration assets whose cash flows are weighted toward distant years, precisely the profile of high-multiple AI and semiconductor names.
Three overlapping forces are driving the correction:
- Valuation compression via higher discount rates: rising yields mechanically reduce the present value of long-duration cash flows, squeezing the multiples investors are willing to pay for AI leaders
- Capex sustainability questions: hyperscalers have funded enormous data centre build-outs with significant debt loads, and reports of firms exploring monetisation of “excess capacity” suggest infrastructure may be outpacing near-term demand
- Competitive pressure from Chinese chipmakers: rapid progress by Chinese AI firms and semiconductor manufacturers has introduced overcapacity risk at the margin, adding a structural headwind to pricing power
When capex ambition outruns near-term revenue
The hyperscaler capital expenditure cycle is the tension point investors are watching most closely. Major technology firms have committed to data centre infrastructure on a scale that assumes AI demand will grow exponentially and sustainably. The debt loads financing those build-outs are substantial.
When news surfaces that some of these firms are exploring ways to monetise “excess data centre capacity,” equity markets read it as an admission that supply may be running ahead of demand. That is a timing and sustainability question, not a denial that AI demand exists. But for investors who bought semiconductor stocks at peak valuations, the distinction between “demand is real but later than priced” and “demand is real and now” is the difference between a profitable position and a painful drawdown.
The implication is direct: the AI selloff is not a buying or selling signal in isolation. It is a reminder that even genuinely transformative technologies can deliver poor near-term equity returns when entry valuations were too high and the macro backdrop has shifted underneath them.
When big ASX news breaks, our subscribers know first
What gold and Bitcoin are telling you that equities are not
Gold trading in the $4,600-$4,700 per ounce range near record highs is, on its face, an anomaly. Elevated real yields typically weigh on gold because they raise the opportunity cost of holding a non-yielding asset. The fact that gold is strong despite a 4.7% 10-year yield tells you something important.
Hedging demand for inflation, geopolitical risk, and currency concerns is currently powerful enough to override the standard opportunity-cost headwind. That itself is the signal.
Middle East tensions remain unresolved. Brent crude near $92 per barrel feeds directly into inflation expectations. Sticky yields confirm the market’s view that price pressures are not fading. In that environment, gold’s defensive function is attracting capital regardless of what Treasury yields offer as an alternative.
Bitcoin near $79,000, having recovered sharply from below $60,000 in prior months, carries a different but complementary signal. It simultaneously serves two investor types: those who view it as “digital gold,” a scarce asset hedging inflation and currency debasement, and those who treat it as a high-beta speculative vehicle responding to momentum and liquidity expectations. The same macro backdrop supports both readings, which is why Bitcoin can rally alongside gold even as growth equities sell off.
Bitcoin’s inflation-hedge credentials received their most consequential real-world test in 2022, when the asset lost approximately 77% of its value during the highest inflation in four decades while gold remained broadly stable, a divergence that challenges the premise that both assets serve the same defensive function in a portfolio.
| Asset | Recent level | Primary macro driver | Role in portfolio | Key risk |
|---|---|---|---|---|
| Gold | $4,600-$4,700/oz | Inflation persistence, geopolitical uncertainty | Defensive hedge against inflation, currency, and geopolitical shock | Elevated entry price if hedging demand fades |
| Bitcoin | ~$79,000 | Inflation-hedge narrative plus speculative momentum | Dual role: store of value and high-beta speculative allocation | Volatility dominance; drawdowns from $79,000 to below $60,000 occurred within this cycle |
For the US investor holding a standard equity-heavy portfolio, gold and Bitcoin at these levels while tech sells off is a prompt to ask whether your portfolio has any meaningful exposure to assets that benefit from inflation persistence and geopolitical uncertainty. It is not a prompt to chase either asset at current prices.
The 10-year yield at 4.7% is the connective tissue across all of these moves
A 4.7% yield on the US 10-year Treasury is not one data point among many. It is the structural organising force of this entire market configuration, and once you trace its effects across asset classes, the divergence stops looking random and starts looking inevitable.
Three channels connect a 4.7% yield to every asset discussed above:
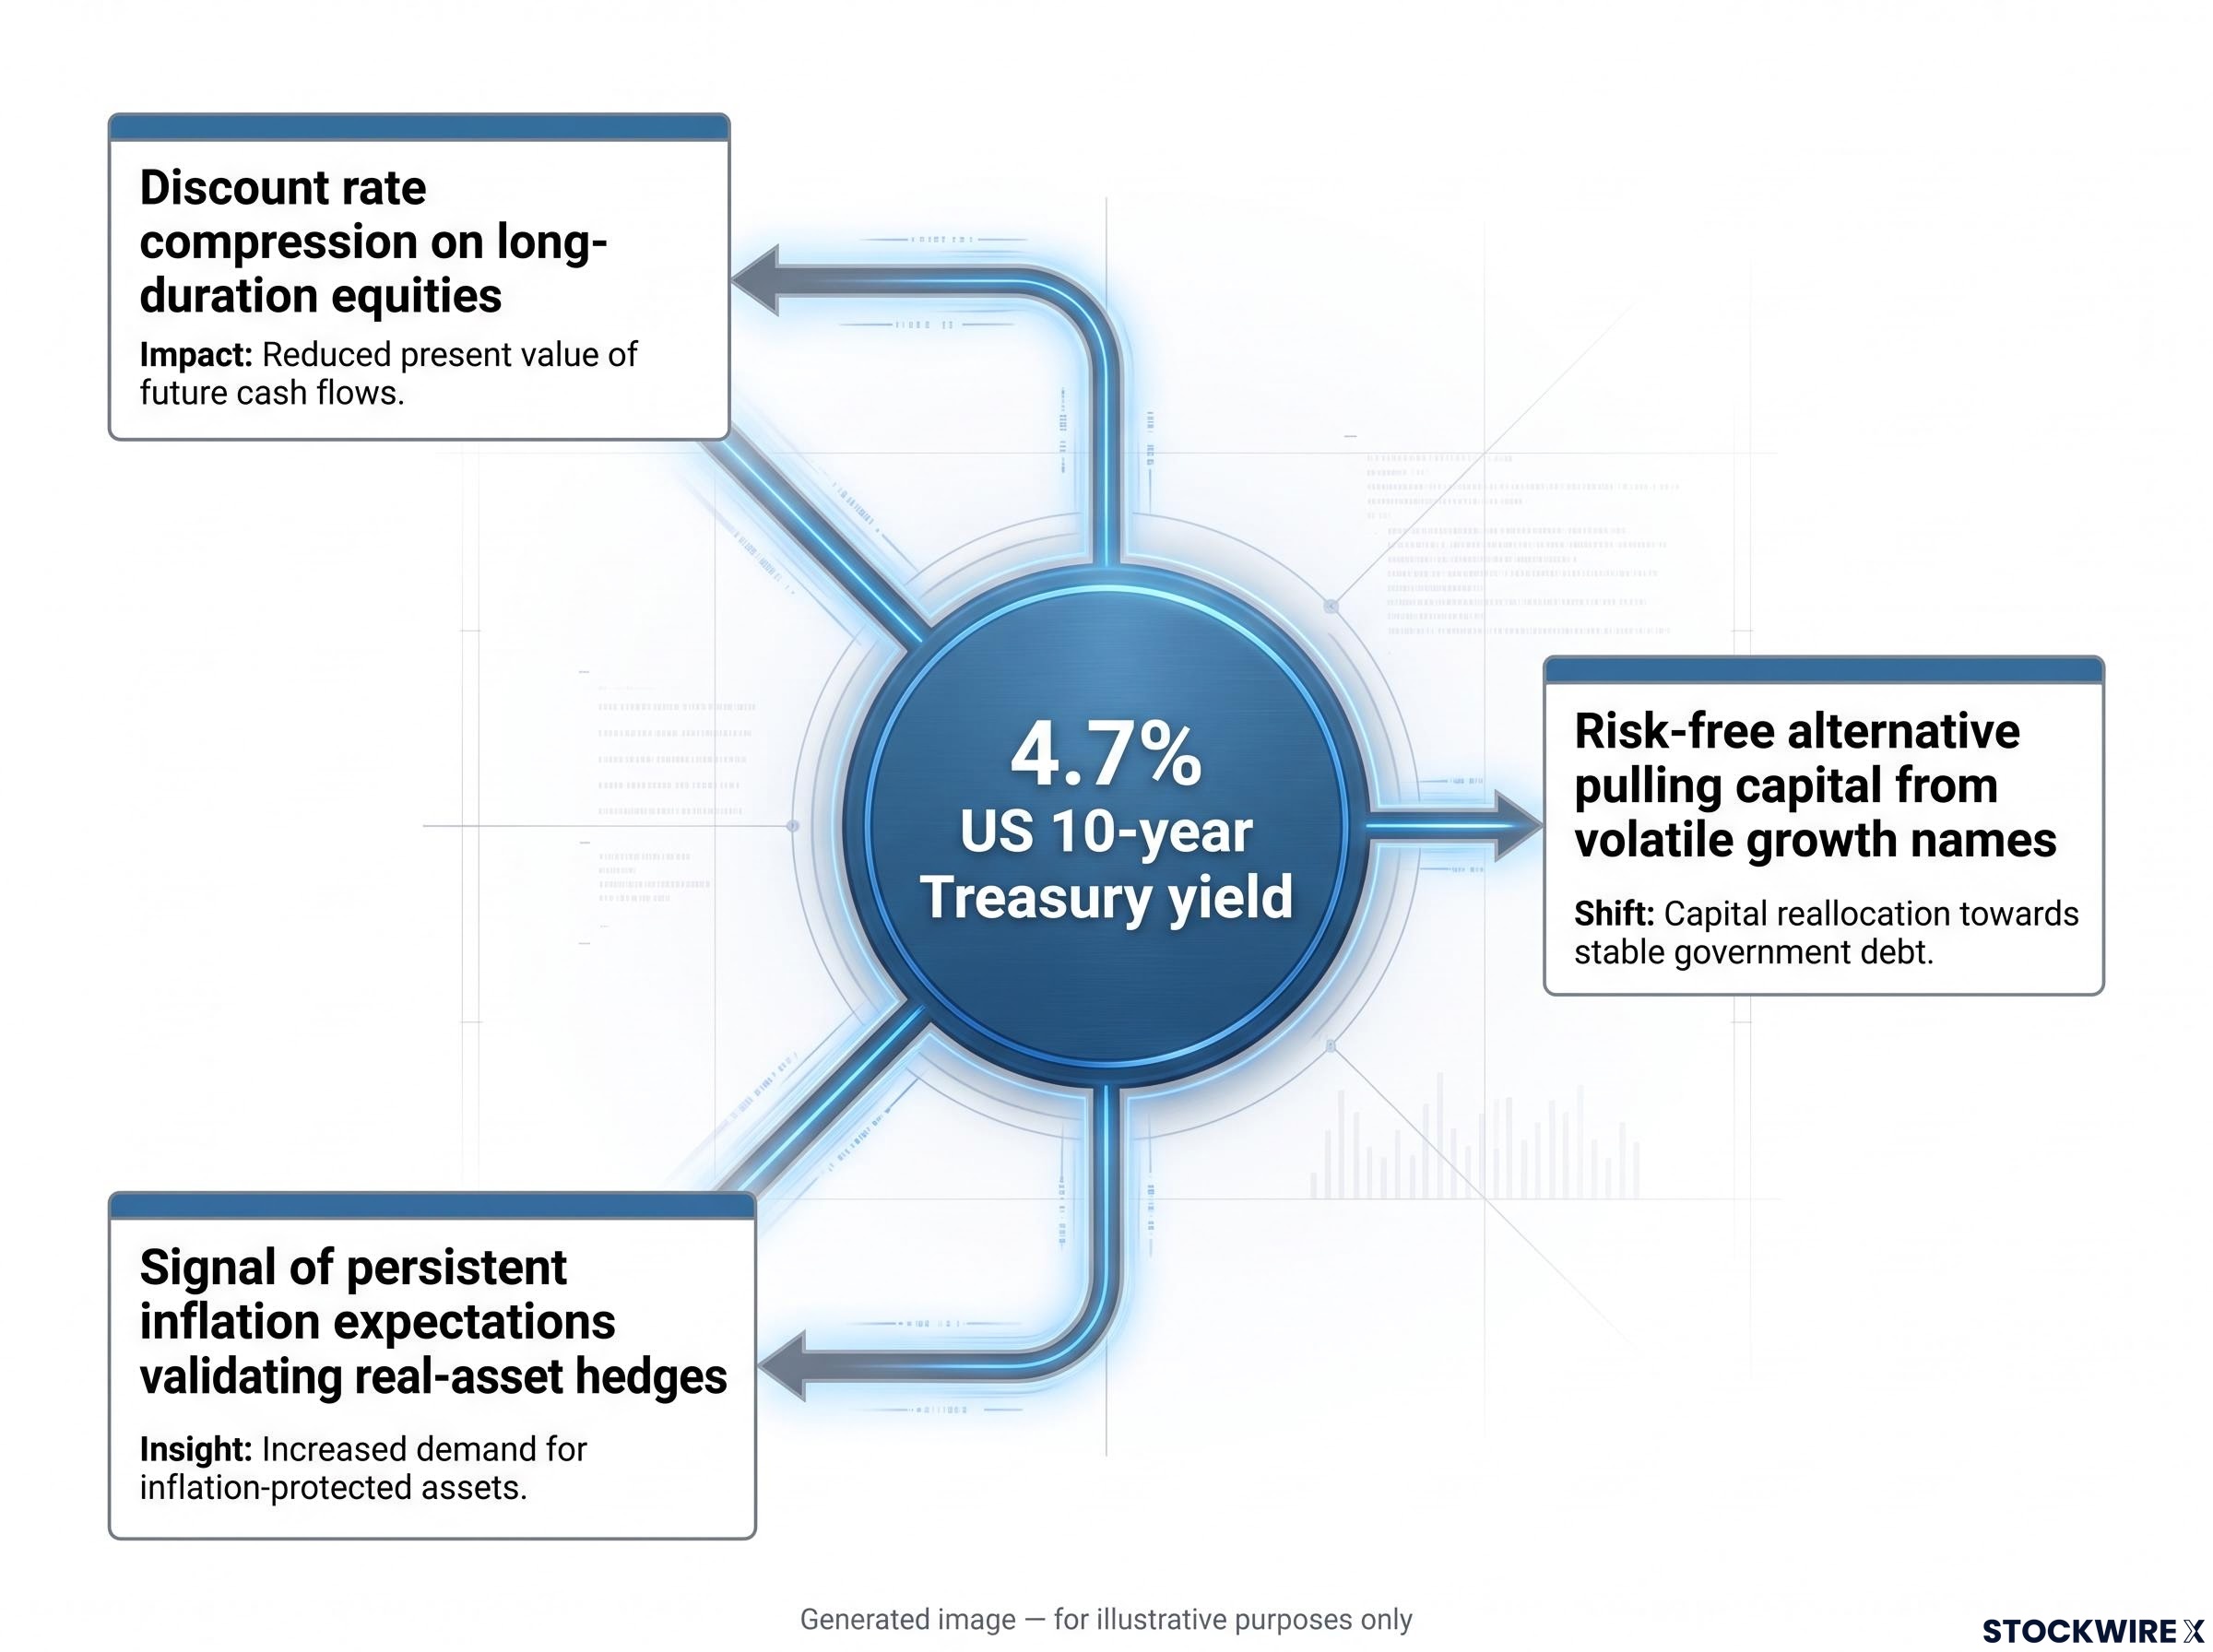
- Discount rate compression on long-duration equities: higher yields reduce the present value of cash flows projected years into the future, hitting high-multiple AI and semiconductor names hardest
- Risk-free alternative pulling capital from volatile growth names: a 4.7% yield on government debt makes high-quality fixed income a genuine competitor to equities for the first time in years, raising the bar for what growth stocks must deliver to justify their risk
- Signal of persistent inflation expectations validating real-asset hedges: a yield this elevated tells the market that inflation, fiscal risk, and growth uncertainty are not temporary, which directly supports demand for gold, Bitcoin, and commodities as stores of value
The oil-inflation-yield feedback loop
The connection between oil, inflation, and yields forms a self-reinforcing chain. Geopolitical risk premiums keep Brent crude near $92 per barrel. Elevated energy prices feed directly into consumer price inflation through transportation, manufacturing, and goods costs. Persistent inflation sustains yield pressure as markets price in fewer rate cuts and longer periods of restrictive policy. Those sustained yields circle back to compress growth stock valuations further.
The oil-inflation-yield transmission operates across bond markets simultaneously: Goldman Sachs estimates a sustained $10-20 per barrel crude increase adds several tenths of a percentage point to US headline CPI over 12 months, and when that feeds into 30-year Treasury yields, it creates a global term-premium repricing that extends well beyond the US market.
That loop is why this is not a risk-on or risk-off environment. It is a simultaneous repricing of interest-rate risk, inflation risk, and geopolitical risk across different asset classes at once. The 4.7% yield is the variable that makes AI stocks falling while gold rises feel not contradictory but logically coherent.
What this means for your portfolio specifically: if you built your equity allocations in a near-zero rate world, a 4.7% 10-year yield changes the decision-making environment in a way that lower-yield periods did not. Holding volatile, richly valued growth stocks now carries a real opportunity cost, measured in a concrete risk-free yield that simply did not exist three years ago.
A practical framework for reading conflicting signals without getting the story wrong
Diagnosing what the market is actually saying requires a repeatable process, not a gut reaction. Here is a three-step framework you can apply to this divergence and to the next one.
- Identify what each asset is specifically measuring. Before drawing any cross-asset conclusions, isolate the macro variable each asset responds to most directly:
- AI and semiconductor stocks: expectations for future demand, capex sustainability, and tolerance for high valuations in a high-rate world
- Treasuries: the market’s view of inflation, growth, and fiscal risk over the next decade
- Oil: geopolitical risk and supply constraints feeding inflation
- Gold and Bitcoin: demand for stores of value and hedges against monetary or geopolitical shocks
- Match the signal to the relevant time horizon. AI and chip volatility reflects fast-moving sentiment about capex headlines and earnings. Elevated yields and high oil prices shape the medium-term inflation and policy path over the next few years. Gold and Bitcoin allocations express multi-year views on inflation, currency, and systemic risk. Matching signal to horizon prevents category errors, like treating a quarter’s semiconductor earnings miss as a reason to restructure a decade-long gold allocation.
- Resist the single risk-on or risk-off narrative. Markets can reprice interest-rate risk, inflation risk, and geopolitical risk simultaneously. Forcing a single label onto a multi-dimensional repricing will misread the environment every time.
“Unusual market configurations are best understood as tests of an investor’s analytical framework, not reasons to abandon it.”
The practical implication is clear: if you can correctly diagnose which risk dimension is being repriced and at what time horizon, you are positioned to make deliberate allocation decisions rather than reactive ones. That skill is durable across different market environments, not just this one.
This framework is educational. Individual portfolio decisions require a qualified financial professional with knowledge of your personal circumstances, goals, and risk tolerance.
What a divergent market configuration means for your portfolio today
The framework above gives you an analytical process. Here is how it translates into specific questions you should be asking about your own allocation right now.
- How sensitive is your growth exposure to rates? If a large share of your portfolio’s value depends on AI and semiconductor cash flows projected years into the future, assess how those positions respond to further yield increases. A 4.7% 10-year yield may not be the ceiling.
- Are you using gold as a hedge or a momentum trade? Gold near record highs can still serve a defensive function against inflation, currency, and geopolitical shocks, but it works best when sized as a specific risk offset rather than treated as a performance-chasing position.
- Does your Bitcoin allocation reflect its true volatility? Even a small portfolio allocation to Bitcoin can dominate overall risk. The recovery from below $60,000 to near $79,000 illustrates both the upside potential and the scale of drawdowns this asset can deliver. Size the position so a large decline does not derail long-term goals.
- Does your portfolio preserve optionality? When signals conflict across asset classes, maintaining a mix of assets with different economic sensitivities, growth and value, equities and bonds, real assets, has more value than trying to perfectly time every rotation.
Why process beats prediction in a multi-signal environment
The temptation in a divergent market is to pick a winner: go all-in on AI if you think the selloff is overdone, or rotate entirely into gold if you think inflation will persist. Both approaches substitute prediction for process, and neither accounts for the possibility that multiple repricing forces can operate simultaneously for an extended period.
A more durable approach is to build or refine a simple, repeatable framework for how rates, inflation, earnings, and valuations feed into your allocation decisions, and to use unusual configurations like this one to stress-test that framework rather than abandon it.
For investors wanting a structured framework for implementing the multi-asset allocation principles this article describes, our dedicated guide to portfolio resilience covers the Bridgewater economic-environment diversification model and a three-tier adaptive portfolio framework built for environments where the stock-bond correlation turns persistently positive.
This article is for informational purposes only and should not be considered financial advice. Investors should conduct their own research and consult with financial professionals before making investment decisions. Past performance does not guarantee future results, and financial projections are subject to market conditions and various risk factors.
The signals are conflicting. The interpretation does not have to be.
AI stocks falling, gold and Bitcoin rising, and the 10-year yield at 4.7% are not random or contradictory signals. They are a coherent market response to the simultaneous repricing of interest-rate risk, inflation risk, and geopolitical risk, each expressed through the asset class most sensitive to that particular dimension.
The right response to a multi-dimensional repricing is a multi-dimensional framework, not a single label. The investor who understands what each asset is measuring, matches signals to the correct time horizon, and maintains a process-driven allocation framework is better positioned than one who reacts to the loudest headline of the day. The signals will keep conflicting. Your interpretation does not have to.