Gold has broken to a three-month high near $4,650 per ounce, and the move is not being explained by safe-haven panic or a single headline. Institutional analysts are reading it as evidence that the dollar debasement trade, the structural bet against the long-term purchasing power of the U.S. dollar, is intensifying.
Spot gold reached approximately $4,602-$4,650/oz during Monday’s European session, with futures logging an intraday range of $4,652-$4,716. The move follows a roughly 5% weekly surge that pushed prices to their highest level since mid-May. Behind the rally sits a convergence of U.S. dollar weakness, questions about Federal Reserve independence, fiscal credibility concerns, and active geopolitical flashpoints including renewed U.S.-Canada trade tensions and potential additional U.S. sanctions on Iran. TD Securities’ Bart Melek has placed a $5,350/oz gold price prediction on the metal, framed as a medium-term average target contingent on a specific set of macro shifts.
Here is what is actually driving gold higher right now, what TD’s $5,350 target means and when it could realistically be reached, and where the genuine risks to the bullish case sit, so you can assess gold’s place in your own portfolio with a clear framework rather than a headline number.
Gold posts its strongest weekly surge in months, reaching a three-month high
Gold’s move to three-month highs is not a single-source print. It is confirmed across spot markets, futures, and multiple independent data providers simultaneously.
The verified price data tells the story:
- Kitco spot price: approximately $4,602/oz as of 23 August 2026
- LiveGoldPrice spot: approximately $4,604/oz, confirming post-surge consolidation
- Investing.com XAU/USD: approximately $4,650/oz, the highest level since mid-May
- Gold futures intraday range on Monday: $4,652-$4,716
Gold futures traded between $4,652 and $4,716 on Monday’s session, the widest intraday range in weeks and the sharpest single-session confirmation that the 5% weekly surge carried genuine institutional participation.
The three-month window matters. Gold had not traded at these levels since mid-May, and the breakout above $4,600 came not on a single session’s momentum but on the back of a full week of accumulation. That distinction is worth pausing on.
When a commodity prints a multi-month high confirmed across spot, futures, and multiple data providers at the same time, it signals that the move has structural support rather than purely technical momentum. For investors assessing whether gold exposure is entering at a genuine inflection or chasing noise, the breadth of this price confirmation is the first and most important input.
When big ASX news breaks, our subscribers know first
What is actually driving gold higher: dollar weakness, fiscal anxiety, and geopolitics in combination
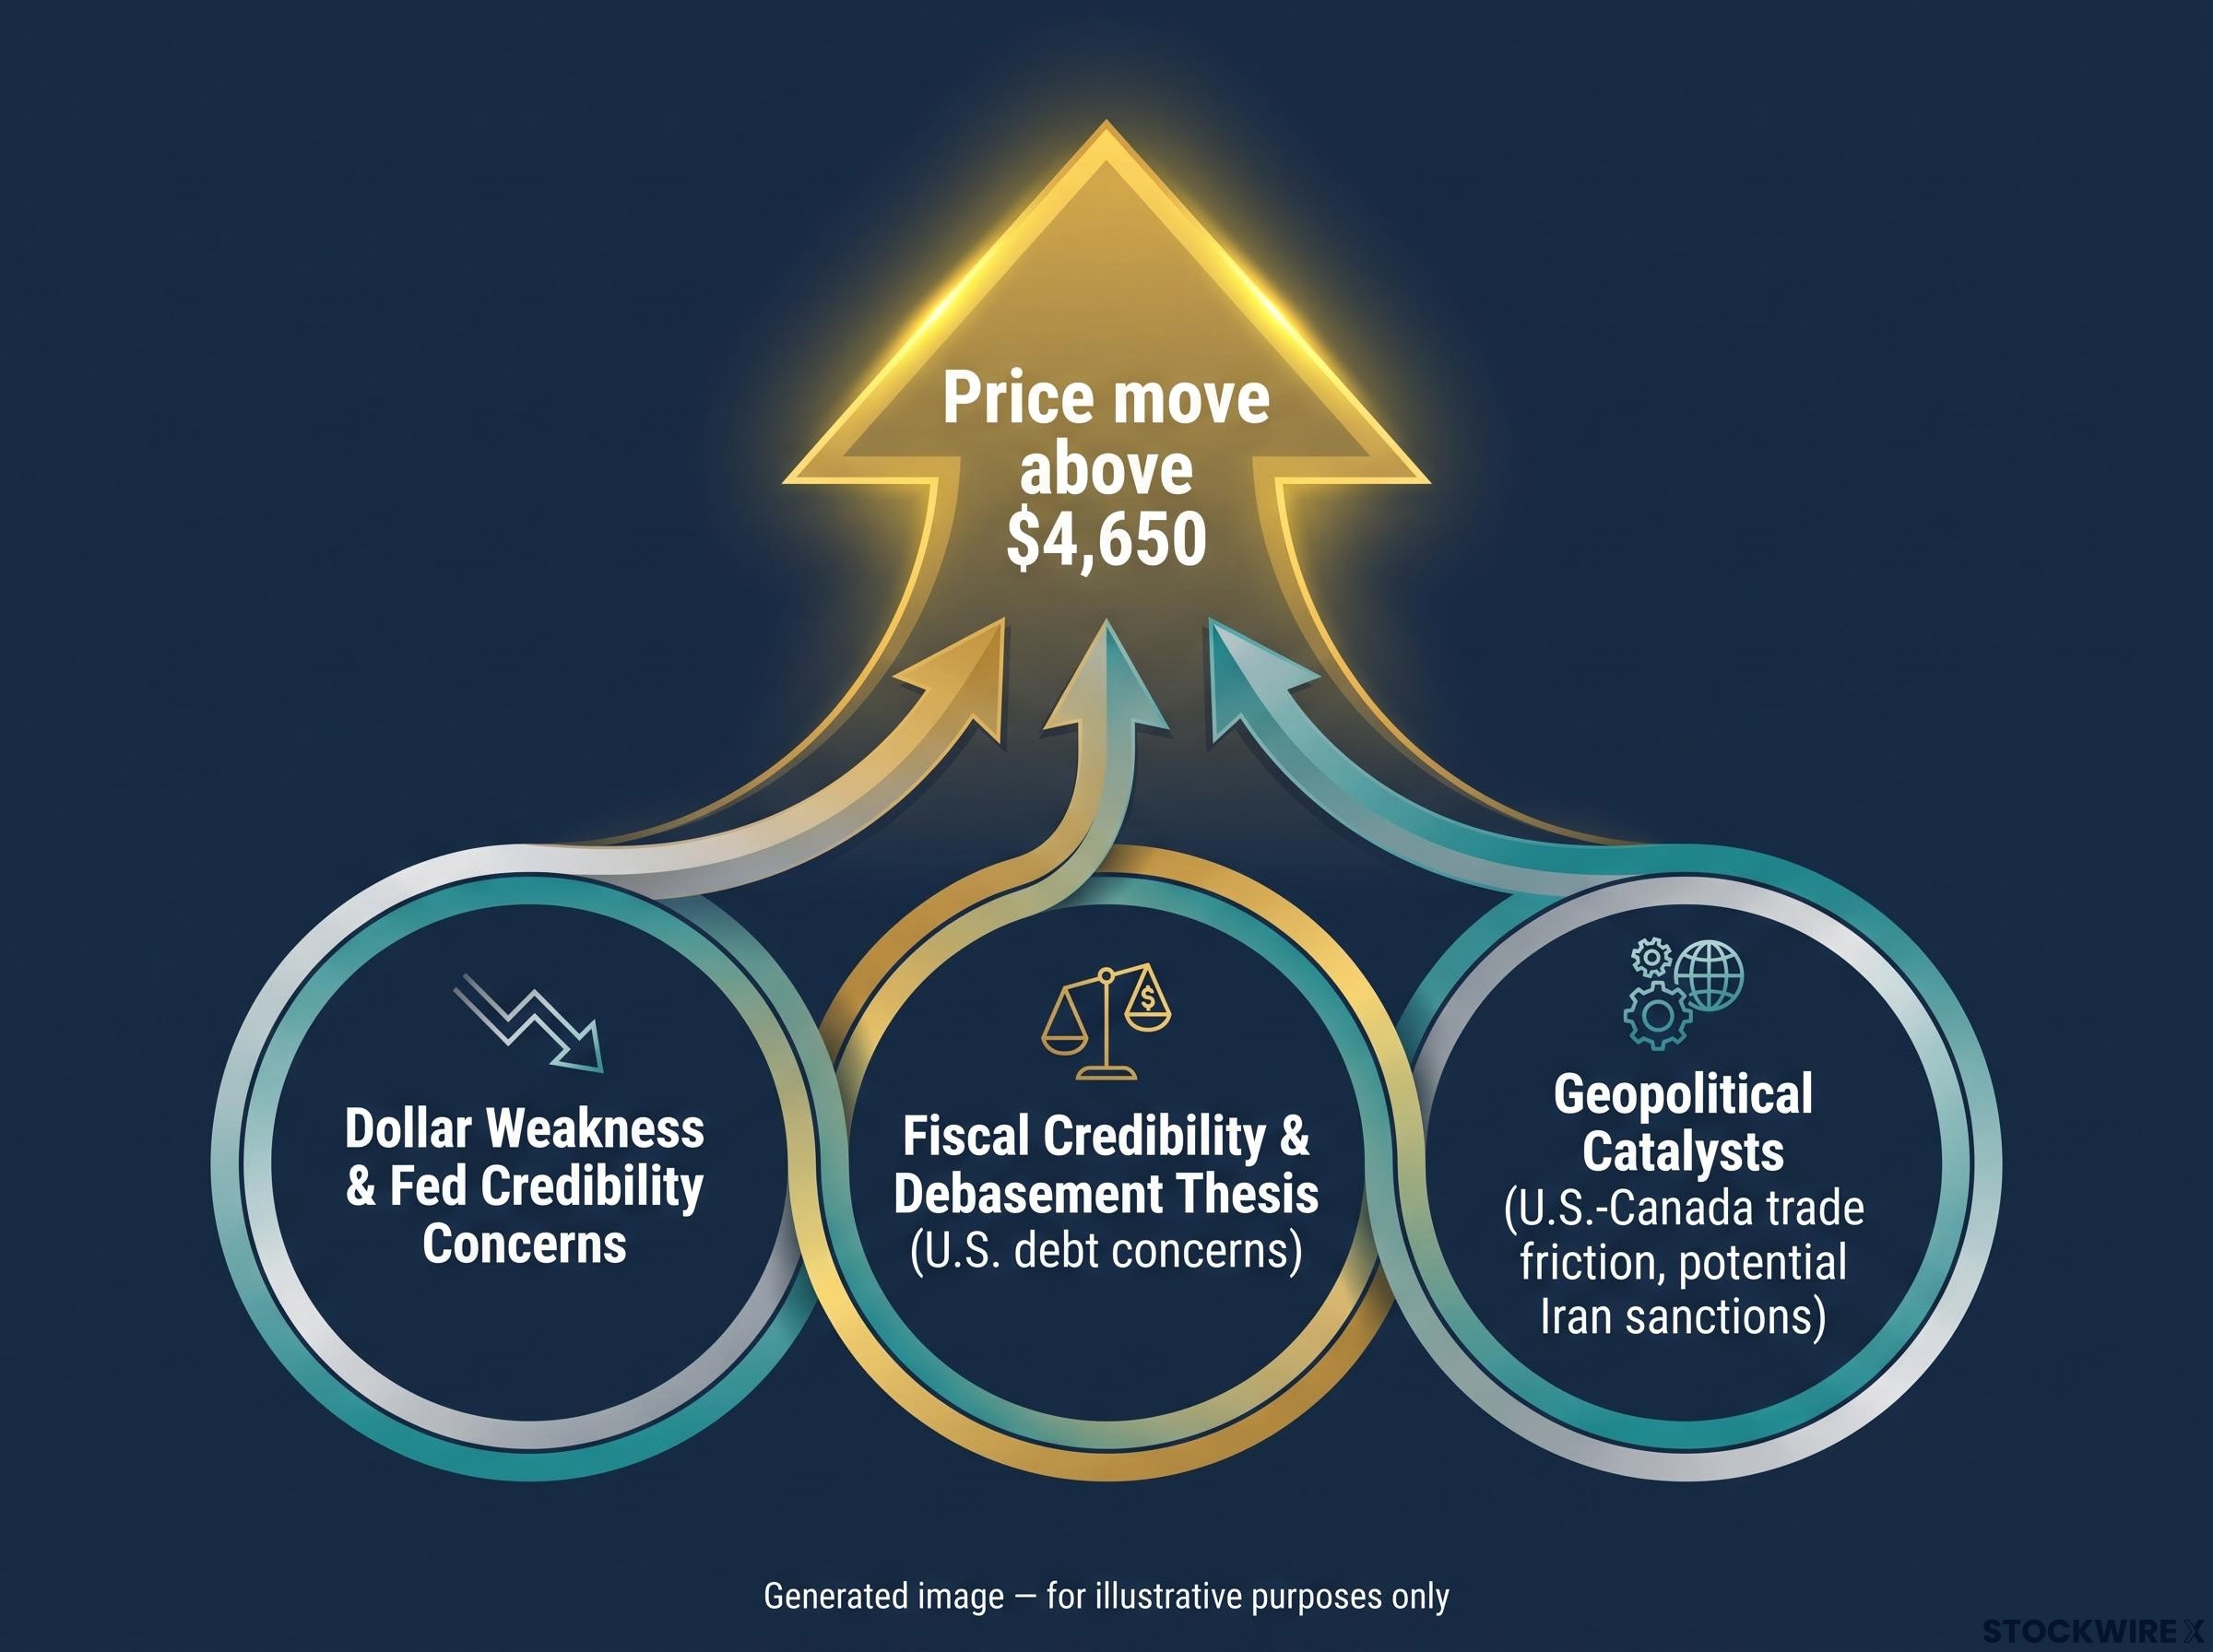
Three distinct driver categories are behind the rally, and the important part is that they are amplifying one another rather than pulling in separate directions:
- Dollar weakness and Fed credibility concerns: The primary proximate driver, with a softening U.S. dollar lowering gold’s opportunity cost for buyers outside the dollar zone, while broader anxieties about central bank autonomy add structural weight
- Fiscal credibility and the debasement thesis: Mounting deficit pressures, an appetite for elevated inflation, and diminishing confidence in the dollar’s long-term store-of-value role are together creating a durable bid for gold as an asset outside the fiat system
- Geopolitical catalysts: Fresh U.S.-Canada trade friction and the market’s close watch on potential Iran sanctions contributing an additional layer of safe-haven demand
XAU/USD market commentary has explicitly tied the move above $4,650 to U.S. debt concerns and the currency outlook. TD’s “Debasement and Demand” research frames debasement and financial repression as the structural themes underpinning the rally, while the U.S. Treasury buyback plan has contributed further to bullish sentiment.
Fed credibility and the real-rate mechanism
The transmission mechanism here is straightforward. Political pressure on the Fed, or tolerance for higher inflation, keeps real interest rates suppressed. Real interest rates are what you earn on bonds after subtracting inflation. When real rates are low or negative, the opportunity cost of holding gold (which pays no yield) shrinks, making bullion more attractive relative to interest-bearing assets.
According to TD’s research, the longer-term bull case rests on a sequence that includes an eventual Fed policy turn, a subsequent decline in yields, and a fresh wave of institutional buying. Within that framework, the firm views Fed credibility not as something that shifts with individual rate decisions but as a foundational variable shaped by whether the central bank is seen to prioritise inflation control over fiscal and employment accommodation over time. That framing matters because it means the bullish case does not depend on a single rate decision; it depends on the market’s ongoing assessment of whether the Fed will prioritise price stability or accommodate fiscal and employment priorities.
The Fed credibility gap is already priced into the yield curve in a measurable way: long-term Treasury yields rose while short-term yields fell after the July 29 FOMC meeting, a steepening that signals investors are demanding a premium for long-run inflation uncertainty rather than trusting the central bank’s resolve.
Geopolitical flashpoints adding a safe-haven premium
U.S.-Canada trade tensions represent the most recent geopolitical support layer for gold. Market participants are also actively monitoring U.S.-Iran sanctions developments as a potential directional catalyst. Prior diplomatic manoeuvring sustained gold in the $4,650-$4,850 range, and any escalation on the sanctions front could push prices toward the upper end of that band.
When dollar weakness, fiscal credibility concerns, and geopolitical risk all point in the same direction simultaneously, gold’s upward momentum becomes self-reinforcing. That convergence is why the current rally should be treated as structurally grounded rather than speculative.
Unpacking the $5,350 gold price objective: what it means and how to get there
Bart Melek at TD Securities has placed a $5,350/oz price objective on gold. That is the headline number, and it carries weight. But the figure deserves more than a glance.
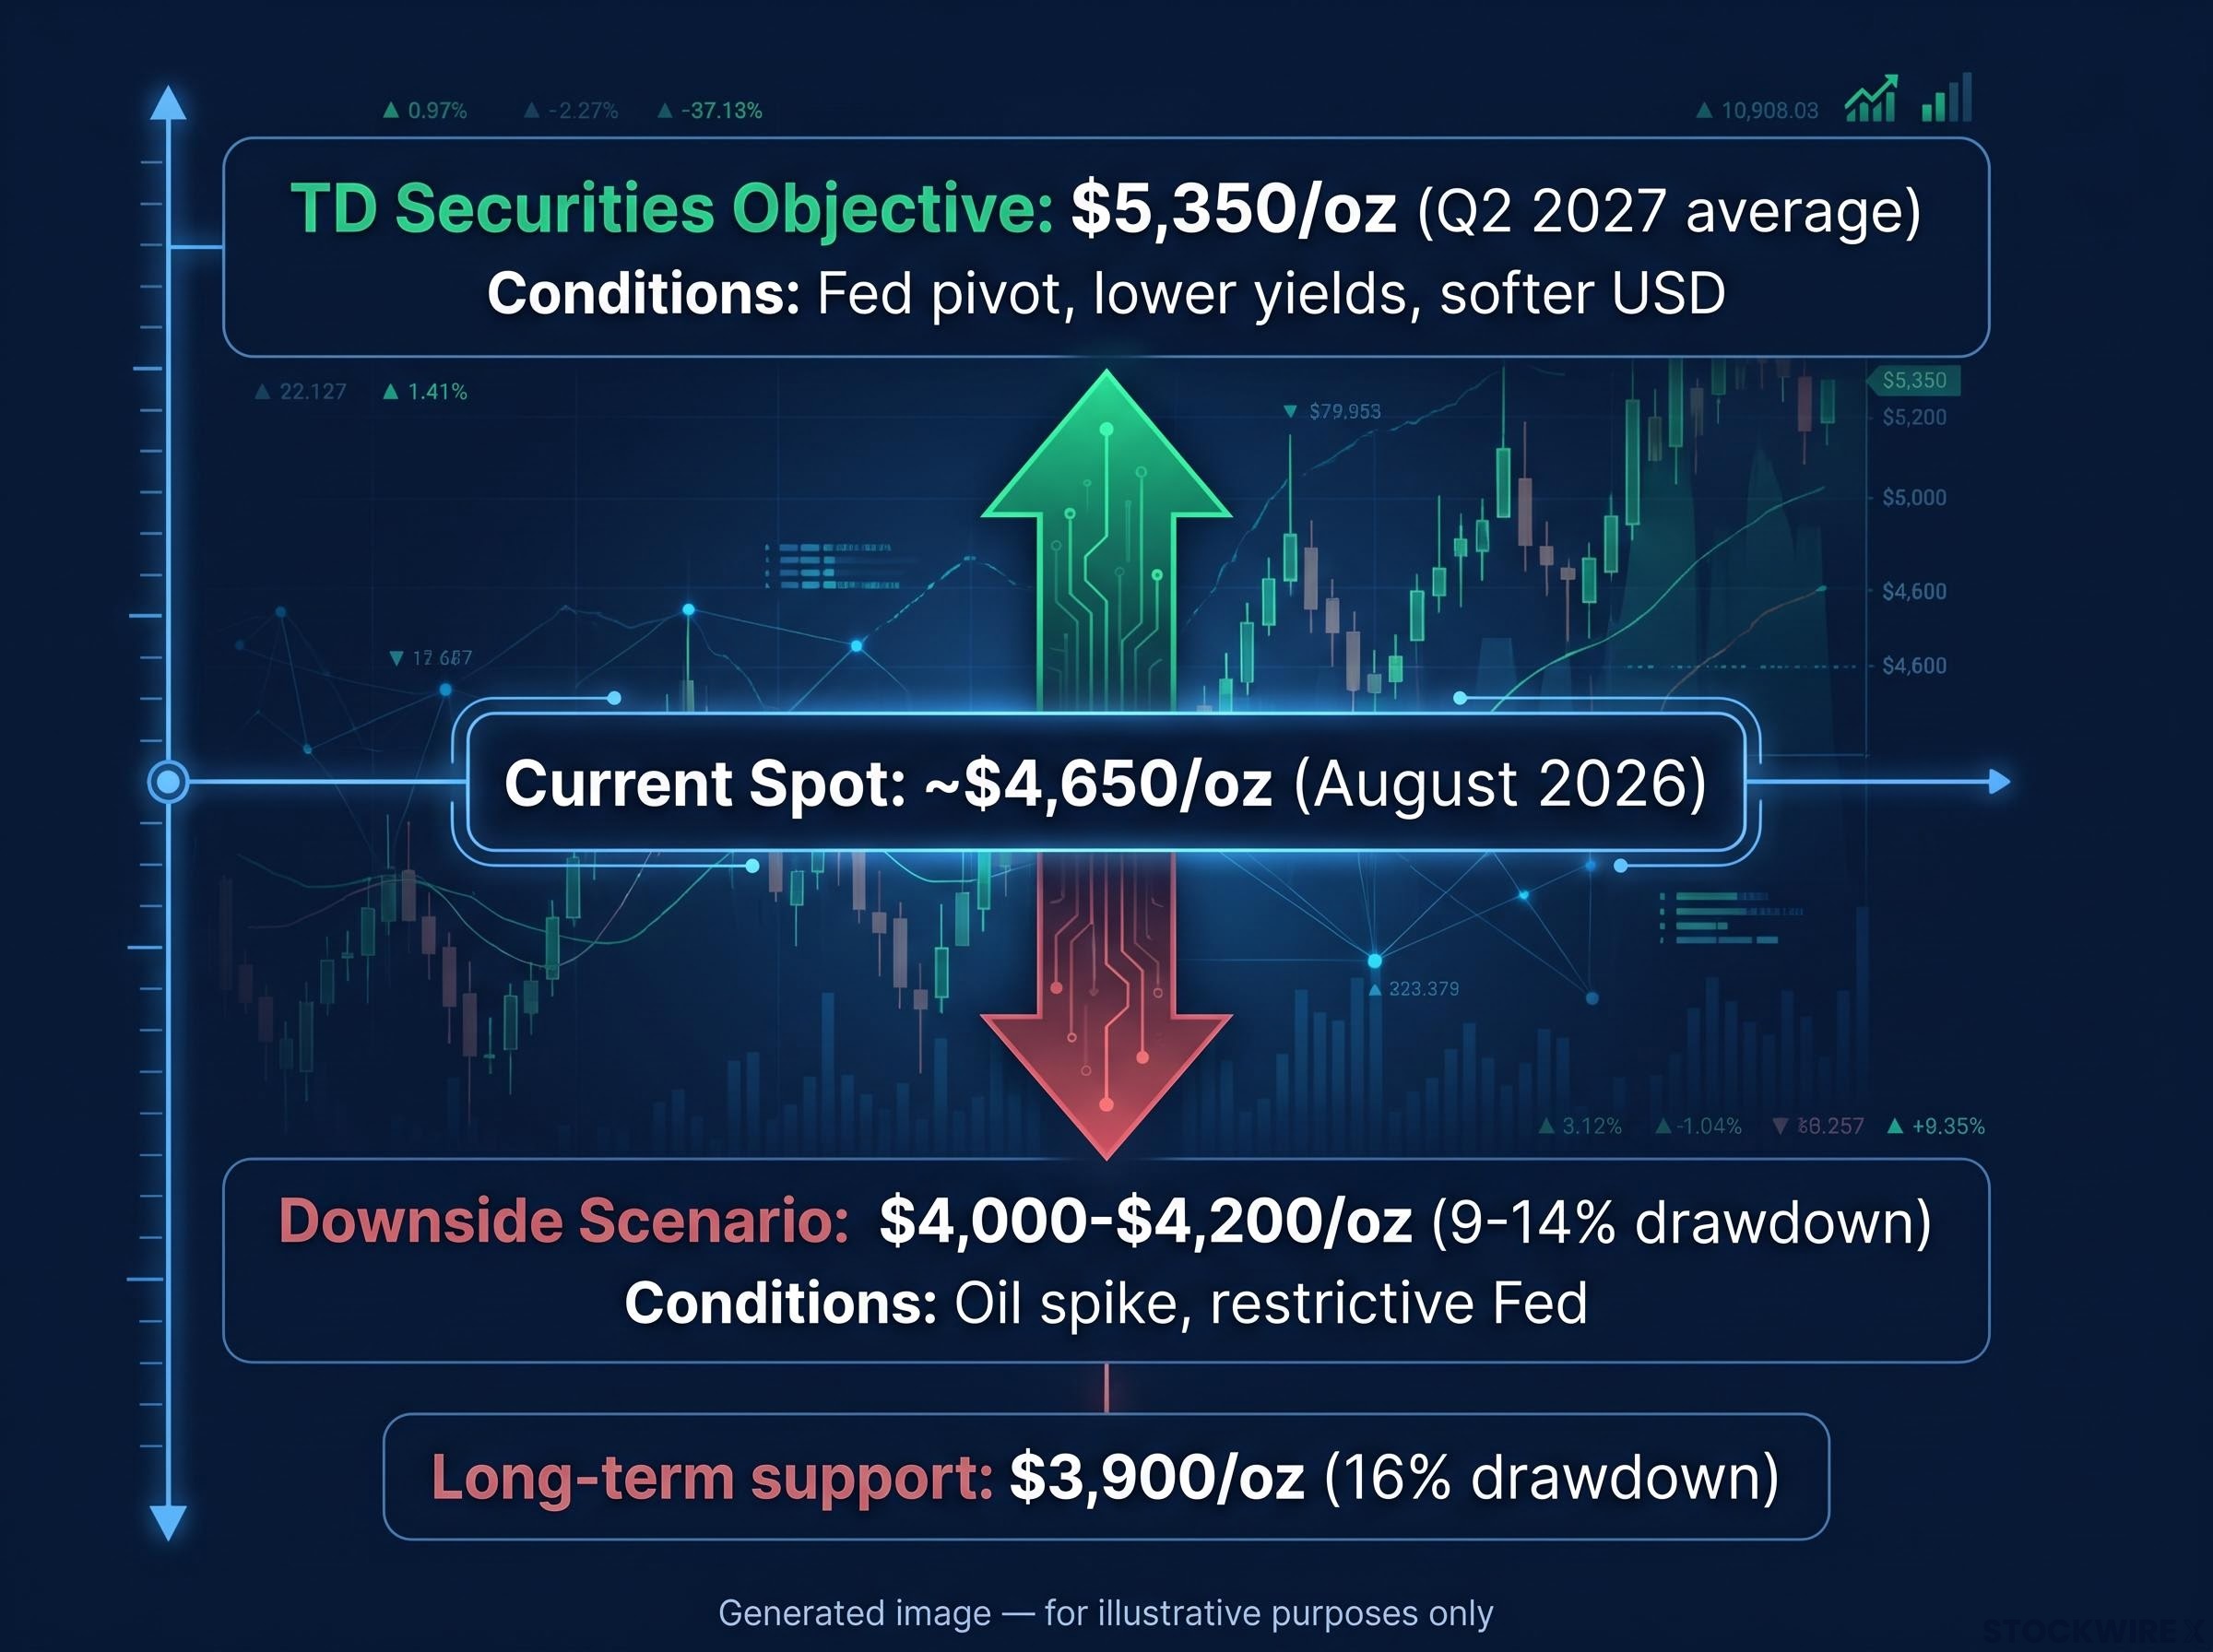
According to Bart Melek at TD Securities, the path to $5,350+ is contingent on conflict and oil-driven inflation pressures fading, a later Fed pivot, lower yields, and a softer U.S. dollar, framing this as a recovery toward new record highs above approximately $5,300 rather than an immediate move from current levels.
TD frames the $5,350 figure as a medium-term average-price scenario target, not a near-term directional forecast from where gold sits today. The distinction is everything. Analysts at TD explicitly consider this level unlikely to be reached in the near term. The target represents the average price TD expects around Q2 2027, contingent on a specific sequence of macro shifts that may take quarters to unfold.
| Metric | TD Securities Position | Timeframe | Key Preconditions | Status |
|---|---|---|---|---|
| Price Objective | $5,350/oz | Q2 2027 average | Fed pivot + lower yields + softer USD | Verified |
| Current Spot | ~$4,650/oz | August 2026 | Confirmed across multiple sources | Verified |
| Downside Scenario | $4,000-$4,200/oz | Near-term risk | Oil spike + restrictive Fed | Verified |
The $5,350 target is best read as a conviction signal about the structural direction of travel rather than a trading trigger. Institutional price targets carry significant weight in retail investor sentiment, but misreading their timeframe or conditionality is one of the most common errors in commodity positioning. Investors who understand this distinction will avoid the mistake of treating an average-price scenario as a short-term entry signal.
Where the bull case can break down: the scenarios investors should not ignore
TD has published a specific downside scenario, and it is worth confronting directly.
A surge in crude oil prices combined with a restrictive, higher-for-longer Fed stance could pull gold toward the $4,000-$4,200/oz range, with long-term support near $3,900/oz potentially tested. That is not a theoretical floor. From current levels near $4,650, the downside range represents a drawdown of approximately 9-14%.
The oil-to-gold transmission mechanism is the critical complication in the current macro picture: higher crude prices feed into inflation data, delay rate cuts, and lift real yields, all of which increase the opportunity cost of holding a non-yielding asset and can actively suppress the metal even as geopolitical tensions push energy prices higher.
The trigger conditions and price outcomes separate clearly:
- Triggers: A crude oil price spike that reignites inflation, forcing the Fed to maintain or tighten its restrictive stance
- Mechanism: Oil-shock inflation that keeps the Fed tight compresses the bullish drivers by holding real yields elevated, reducing the near-term force of the debasement thesis
- Price outcomes: Gold pulled toward $4,000-$4,200/oz, with a possible test of long-term support near $3,900/oz
A test of $3,900/oz support would represent a drawdown of roughly 16% from current levels, a figure that belongs in any position-sizing conversation about gold at these prices.
The structural bull case and the short-term risk are simultaneously true. Gold can be a sound long-term position while also being capable of significant drawdowns along the way. Investors sizing a gold position today should factor the $4,000-$4,200 range into their risk assessment rather than anchoring purely on the $5,350 upside case.
This article is for informational purposes only and should not be considered financial advice. Investors should conduct their own research and consult with financial professionals before making investment decisions. Past performance does not guarantee future results. Financial projections are subject to market conditions and various risk factors.
Where the debasement trade goes from here, and what to watch
Which way gold resolves its bull-versus-bear tension will come down to three specific variables over the coming months, and they are worth ranking:
- U.S. dollar trajectory: The current rally is underpinned by dollar softness. A sustained reversal in the greenback would weigh on spot prices irrespective of the longer-term structural argument.
- Fed rate posture and real yield direction: When the Fed eventually pivots is the single most consequential medium-term input for the $5,350 thesis. TD’s target is built on a sequence in which that pivot arrives, yields move lower, and institutional positioning follows.
- Geopolitical catalysts, specifically Iran sanctions and U.S. trade policy: These are the swing factors that can accelerate or stall the rally at key technical levels. Market participants are already monitoring both actively.
Gold is currently consolidating in the $4,600-$4,650 zone following the 5% weekly surge. That consolidation level already prices in meaningful optimism about dollar weakness continuing. For TD’s $5,350 scenario to materialise, the conditions it depends on, chiefly an easing of conflict-related and oil-price inflation, still need to develop rather than simply being assumed.
The structural demand floor beneath gold has shifted permanently since 2022, with central bank net purchases exceeding 1,000 tonnes annually and Asian-listed gold ETFs reaching roughly 30% of global gold ETF market capitalisation, a buyer-base transformation that absorbs speculative selling and distinguishes the current cycle from prior corrections.
Investors who monitor these three variables actively will be better positioned to distinguish between a rally extending on structural grounds and one running ahead of the macro conditions required to justify it.
Matching your gold exposure vehicle to your time horizon
Not all gold exposure is the same, and the distinction matters at three-month highs.
Physical gold offers the lowest volatility relative to equity-linked vehicles and provides direct commodity exposure without corporate or operational risk. Gold ETFs are liquid, accessible, and track spot prices closely, making them the most practical vehicle for most retail investors. Mining equities offer leveraged exposure to the gold price but carry additional operational and corporate risk, including management execution, cost inflation, and jurisdiction-specific factors.
Entry near a three-month high warrants position-sizing discipline regardless of which vehicle you choose and regardless of how strong the long-term thesis appears. The structural case for gold has rarely been better supported by institutional research. The path to new highs will not be smooth, and sizing accordingly is how you stay positioned to benefit from it.
For investors wanting a structured framework for sizing gold alongside other safe-haven and defence allocations, our dedicated guide to geopolitical investing strategy covers the BlackRock and Vanguard rebalancing models and a five-component resilience checklist designed to function before, during, and after geopolitical shocks.