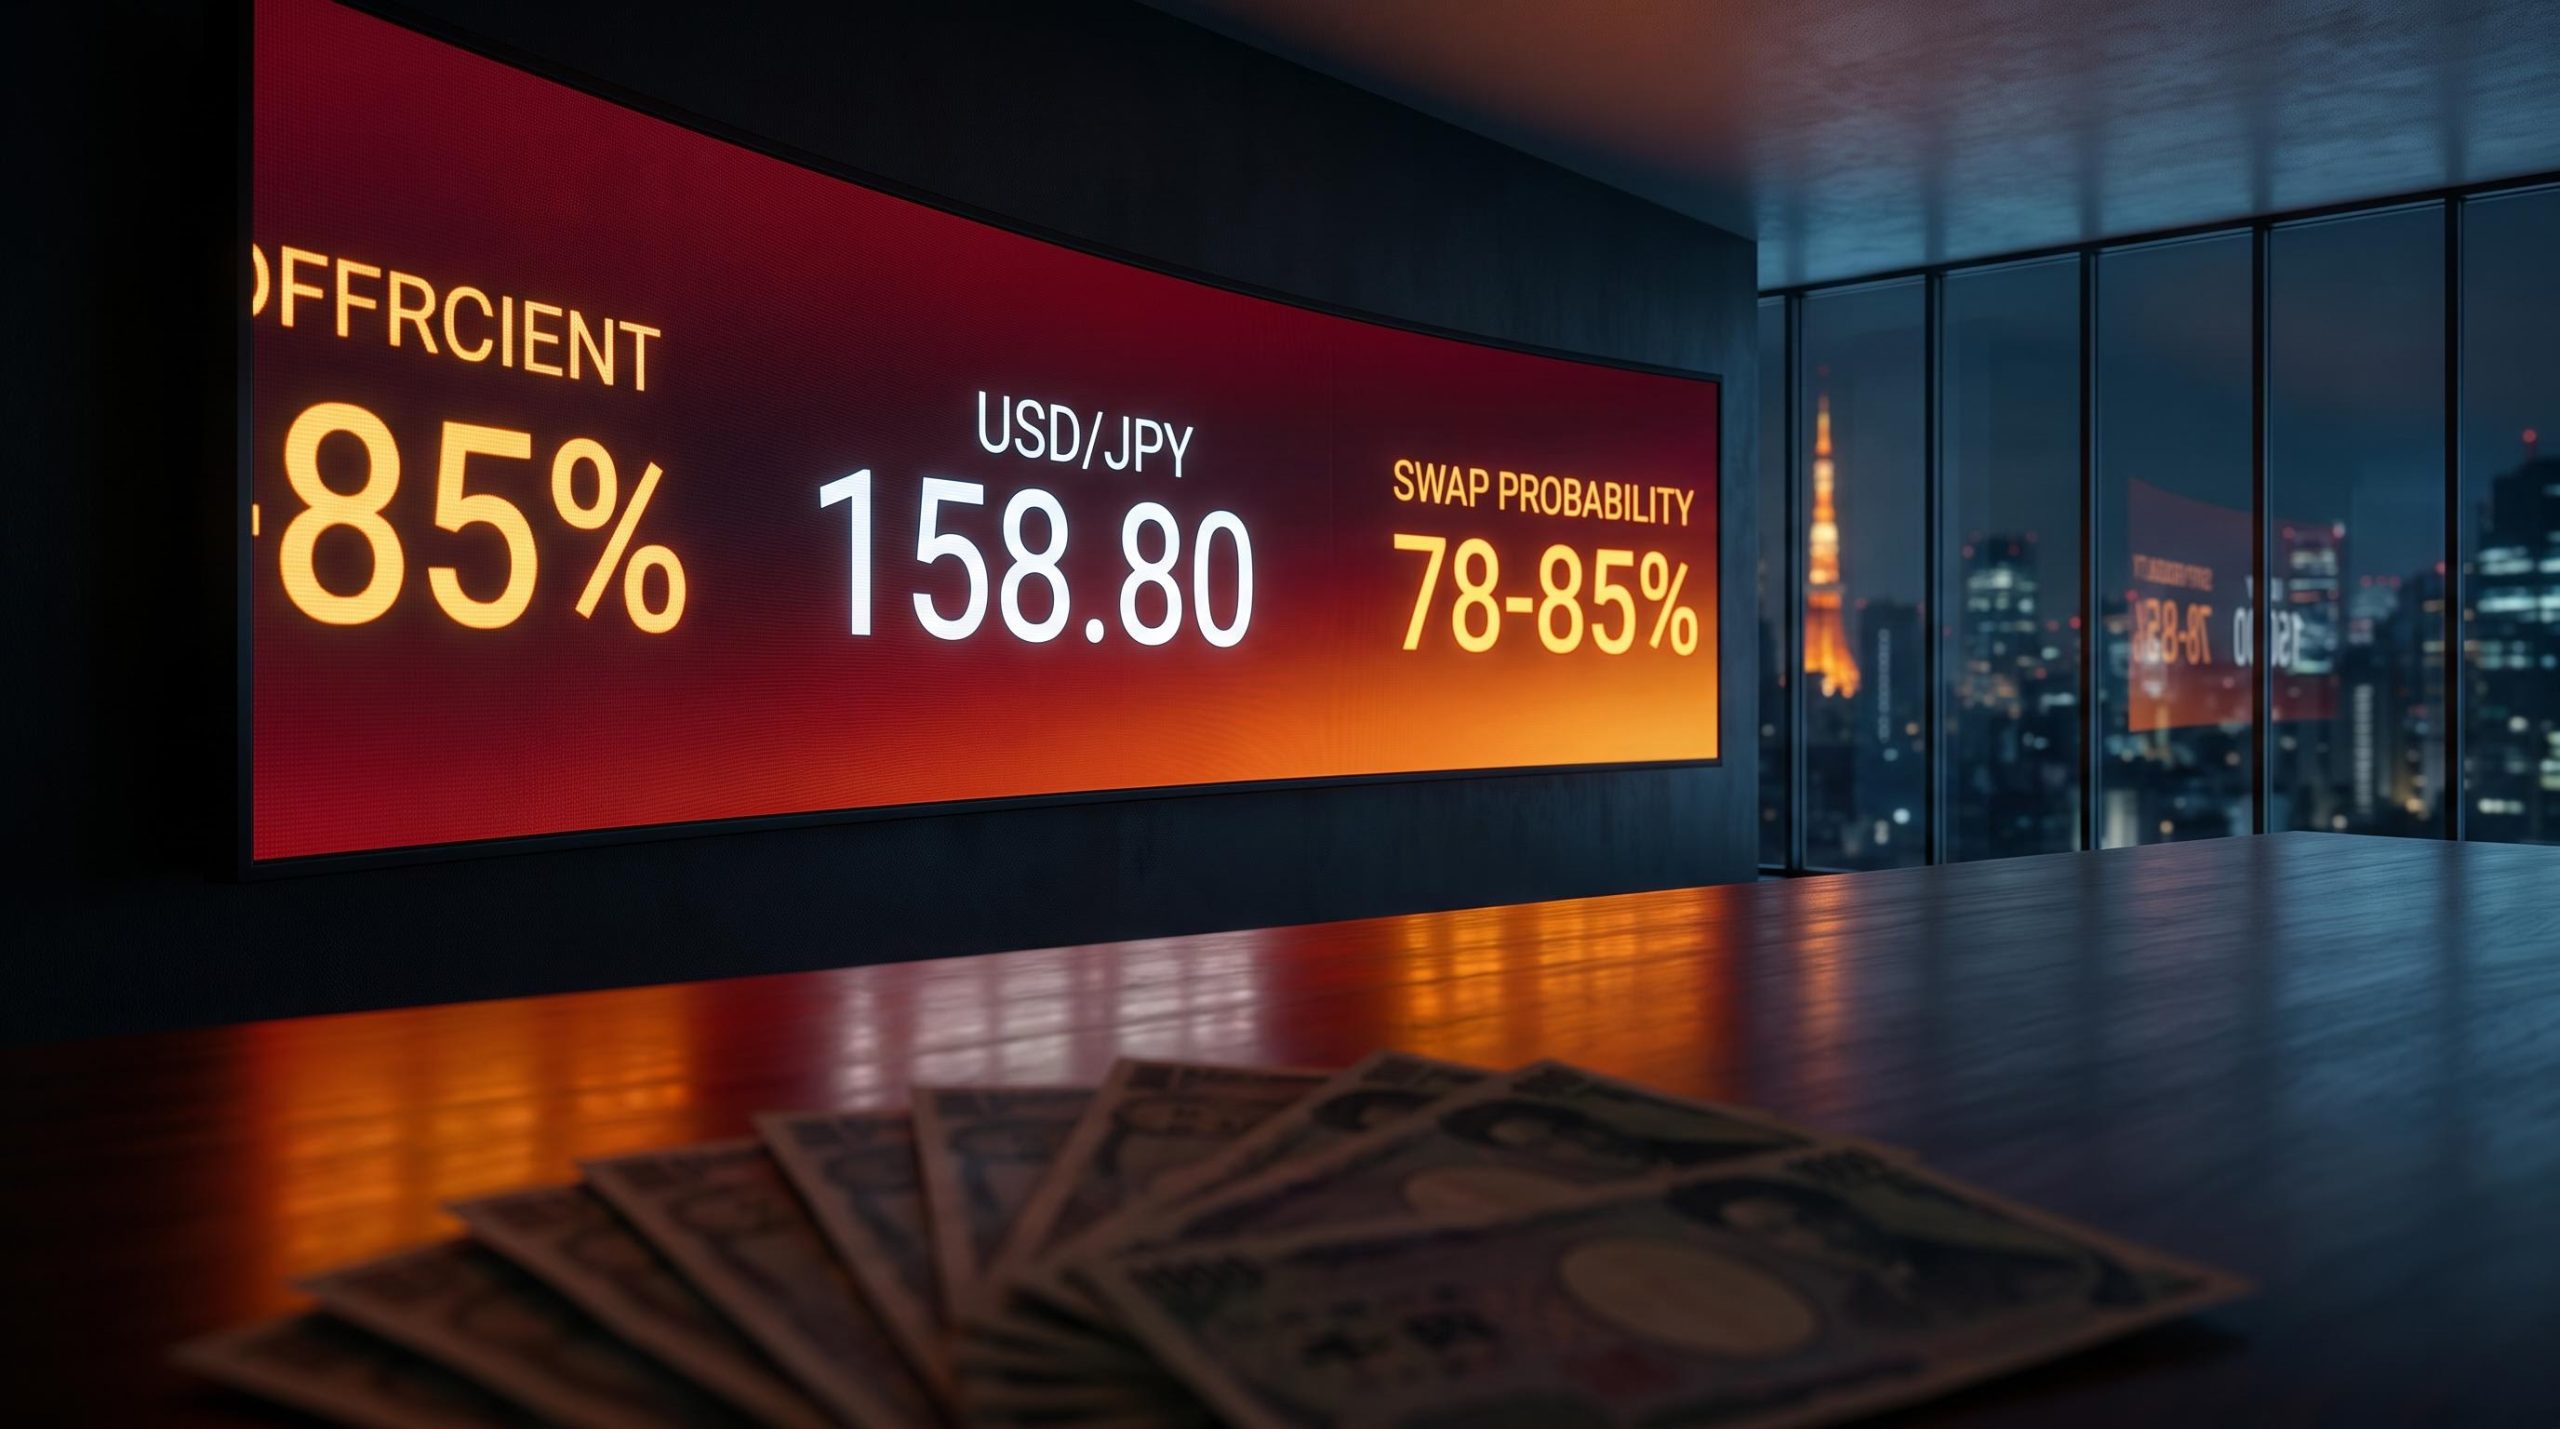
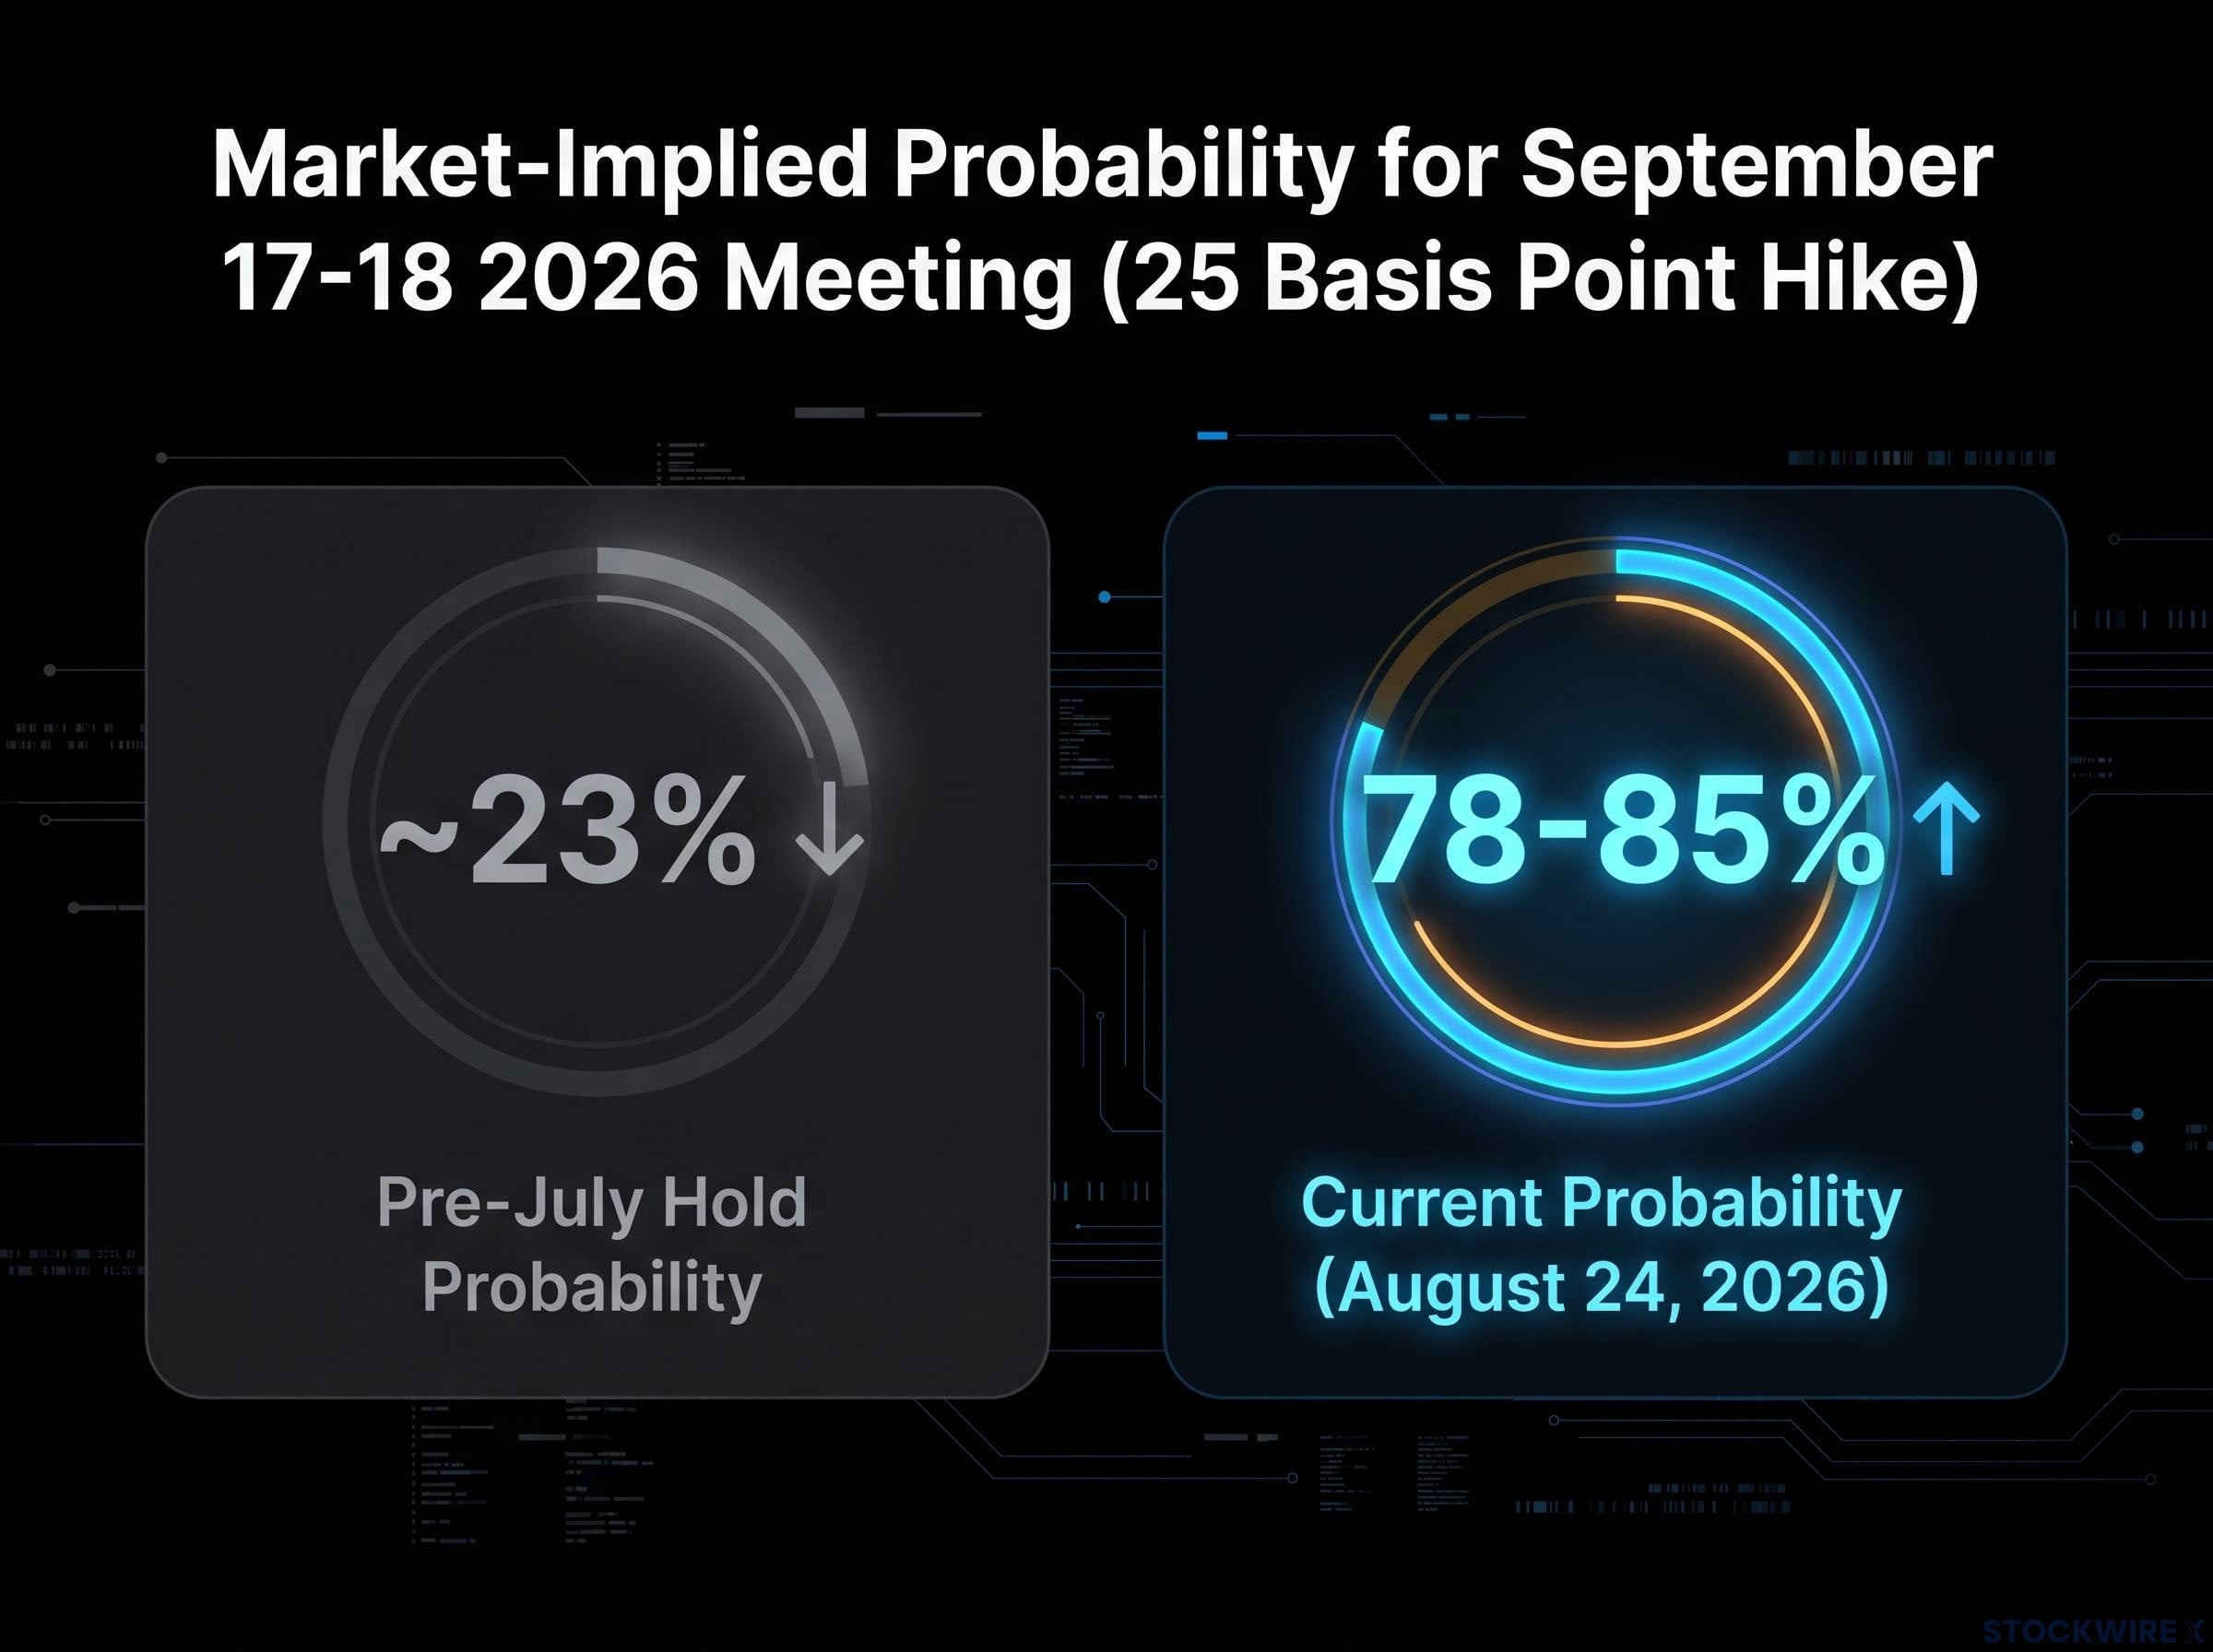
Japanese inflation surprised to the upside for a second consecutive month, and markets are not waiting for the Bank of Japan to catch up. Overnight-indexed swaps, contracts that reflect where traders expect interest rates to land, are now pricing a 78-85% probability of a 25 basis point rate hike at the September 17-18 meeting. That is up from roughly 23% before the July decision.
The Yen rose approximately 0.4% on Monday, pushing USD/JPY down to around 158.80 during Asian trading. That move follows the BoJ’s June 2026 decision to lift the policy rate to 1.0%, the highest since 1995, and a hold at the July 30-31 meeting. With inflation re-accelerating and BoJ officials leaning openly hawkish ahead of scheduled speeches from Deputy Governor Ryozo Himino (August 27) and others, the September decision is now one of the most closely watched macro events of the quarter.
Here is what the inflation data actually showed, how far market expectations have shifted, what the yield differential compression means for where USD/JPY trades from here, and what both a hike and a hold would mean for Yen positioning in the weeks ahead.
Japan’s inflation re-acceleration is the catalyst markets have been waiting for
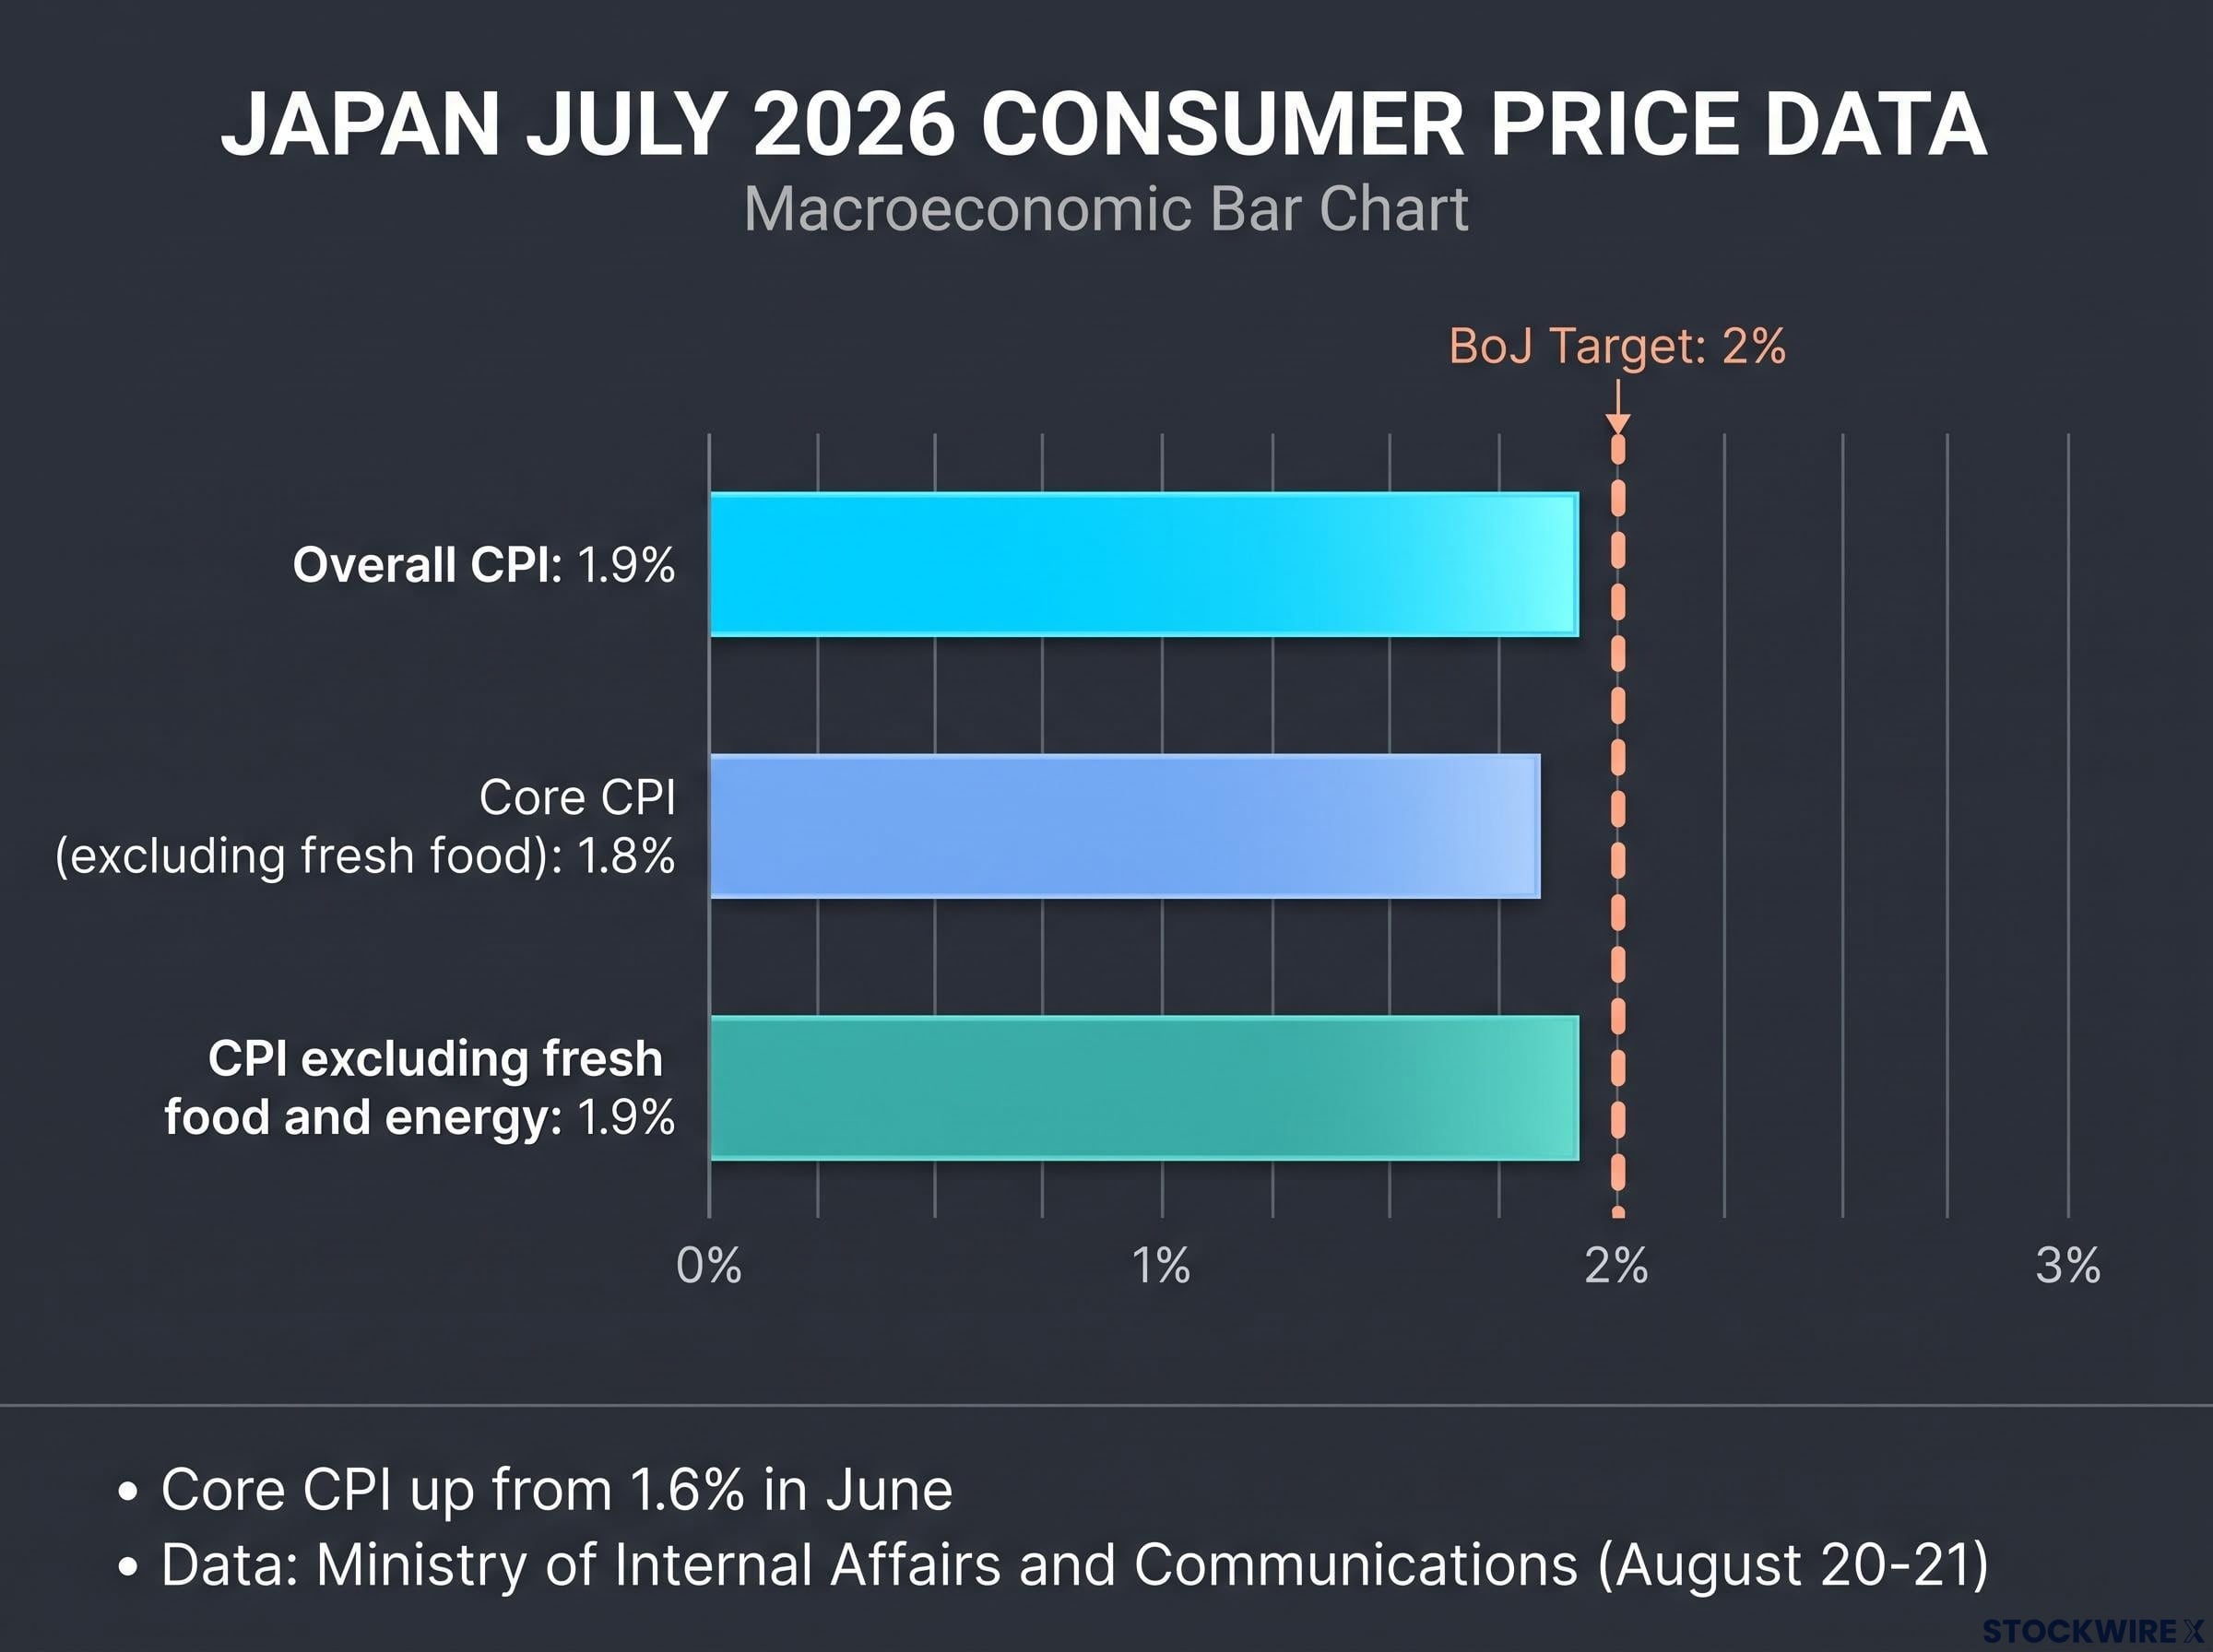
Japan’s July 2026 consumer price data, released by the Ministry of Internal Affairs and Communications on August 20-21, came in above expectations across all three headline measures:
- Overall CPI: approximately 1.9% year-on-year
- Core CPI (excluding fresh food): 1.8% year-on-year, up from 1.6% in June
- CPI excluding fresh food and energy: 1.9% year-on-year
That is two consecutive months of acceleration after a period of slowing earlier in 2026. One upside surprise can be noise. Two in a row re-establishes a trend, and it is exactly the trend the BoJ has said would justify continued policy normalisation.
The official CPI release from the Statistics Bureau of Japan confirmed the all-items index trajectory that underpins the BoJ’s current policy calculus, providing the primary data series markets and policymakers are using to assess whether price pressures are durable.
The BoJ itself has acknowledged the direction of travel. Its recent communications have explicitly flagged upside inflation risks, citing Yen weakness, energy prices, and global demand as drivers that could push prices durably above the 2% target.
The Bank of Japan has stated that underlying inflation risks are now skewed to the upside, and that prices could run above the 2% target on a persistent basis.
These consecutive upside surprises do not merely validate the BoJ’s framework. They shift the timing calculus. If you are watching the September meeting, the inflation data tells you to treat this as a live and near-certain event, not a speculative one.
When big ASX news breaks, our subscribers know first
How far the rate-hike odds have moved, and why September is the live window
The distance the market has travelled in a matter of weeks tells the story. Before the July 30-31 hold, swap markets implied roughly a 23% chance of a hike at the next meeting. That number now sits at 78-85% for a 25 basis point move on September 17-18.
The July hold decision was far from a unanimous or complacent pause: board member Hajime Takata voted explicitly for an immediate hike to 1.25%, and government energy subsidies were simultaneously masking the true scale of underlying price pressure, making the 8-1 vote outcome more consequential than the headline number suggested.
| Event/Timepoint | Policy Rate | Market-Implied Probability (Next Hike) | Notes |
|---|---|---|---|
| June 16 2026 hike | 1.0% | N/A (hike delivered) | Highest rate since 1995 |
| July 30-31 2026 hold | 1.0% | ~23% pre-meeting | Hold widely expected |
| Current (August 24 2026) | 1.0% | 78-85% | Post-inflation repricing |
| September 17-18 2026 meeting | 1.25% (if hiked) | 78-85% | Primary catalyst window |
The calendar logic reinforces the probability. The BoJ already delivered the June hike and held in July, making September the natural next decision point. Discussion has also emerged around an accelerated cadence, potentially moving from approximately twice per year to once per quarter, which would represent a meaningful shift in how the BoJ communicates its tightening path. Scotiabank strategists characterised the swap market positioning as “sending a clear signal” that a near-term move is live.
Scotiabank analysts noted that interest rate swap markets are “sending a clear signal” of a near-term BoJ rate move.
Beyond September, forecasts from Mizuho and Bloomberg sources see the policy rate reaching 1.25-1.50% by year-end 2026. A market pricing 78-85% is not expressing uncertainty; it is expressing near-consensus. The burden of proof has shifted from “why would the BoJ hike?” to “what would stop them?”
For Yen traders, the probability level matters because it determines how much of the September hike is already embedded in the current USD/JPY level, and therefore how large the reaction would be if the BoJ either confirms or disappoints.
The yield differential is compressing from both sides, and that is the structural story for the Yen
The September meeting is one decision. The structural story underneath it is longer and arguably more important. The US-Japan yield spread is narrowing, and it is narrowing from both sides simultaneously.
The mechanism works in three stages:
- The BoJ exits ultra-loose policy, lifting Japanese Government Bond (JGB) yields. Between 2013 and 2024, the BoJ held its policy rate in negative territory and operated a yield curve control programme that placed a ceiling on how far government bond yields could climb. The resulting policy divergence weighed heavily on the Yen across that entire period. Since early 2024, the BoJ has been unwinding those settings, and the pace has accelerated through 2026.
- US yield pressure eases as the Federal Reserve holds or cuts. US Treasury yields are no longer climbing at the pace seen in 2022-2023, and other major central banks have already moved into rate-cutting cycles.
- The spread compresses, removing the structural tailwind that drove USD/JPY above 160. When US yields were rising sharply and Japanese yields were pinned near zero, capital flowed toward dollars. That trade is reversing.
USD/JPY has traded in the 158-162 range recently, below prior peaks above 160 during peak divergence. The Yen’s safe-haven status, where demand increases during episodes of global risk aversion, compounds directional moves driven by rate differentials.
Japan’s yen intervention record, spanning over $215 billion deployed since 2022, contextualises why the BoJ’s policy rate path carries more structural weight for USD/JPY than any intervention operation: BNY iFlow data from the July 2026 episode showed traders treating the bounce as a broad exit opportunity rather than a reversal signal.
Why the compression still has room to run
Real interest rates in Japan remain negative. With inflation running at 1.6-1.9% and the policy rate at 1.0%, the BoJ is still operating in accommodative territory, not yet at neutral, and well short of restrictive.
If further hikes toward 1.25-1.50% by year-end materialise, the spread would continue to tighten from the Japanese side regardless of US policy direction. For anyone wondering whether the Yen’s move is already over, the negative real rate context tells you the BoJ is still early in the normalisation cycle. The structural case for Yen appreciation relative to peak divergence levels has not yet played out fully.
What a hike delivers versus what a hold would cost, heading into September
September 17-18 presents a genuine fork. The two scenarios are not symmetrical, and the asymmetry matters.
Scenario one: the BoJ hikes and signals more to come. A 25 basis point increase to 1.25%, paired with language reinforcing data-dependent tightening, would validate the current swap-market pricing and further compress the yield differential. That path is Yen-positive and likely sustains or extends recent strength.
Scenario two: the BoJ holds or delivers a dovish hike. If the BoJ hikes but immediately softens its forward guidance, or delays action despite the inflation data, a portion of the approximately 80% probability now priced could unwind. That would support USD/JPY and represent a tactical setback for Yen bulls.
Intervention risk signals, including official rhetoric escalation, AUD/USD divergence, and broad cross-JPY weakness, remain relevant to USD/JPY positioning even as the rate differential narrative dominates: at prior peaks above 160, Japan deployed approximately $73 billion in a single episode, and that threshold continues to cap how far USD/JPY rebounds if the September hike disappoints.
| Scenario | BoJ Action/Signal | Likely USD/JPY Direction |
|---|---|---|
| Hike plus hawkish guidance | 25bp hike to 1.25%; signals ongoing data-dependent tightening | Lower (Yen strengthens) |
| Hold or dovish hike | Hold at 1.0% or hike with softened forward guidance | Higher (Yen weakens as priced tightening unwinds) |
Technical indicators reinforce the current directional skew:
- Spot price: 158.80
- 9-period EMA (immediate resistance): 159.03
- 50-period EMA (secondary resistance): 160.13
- 14-day RSI: 42.67, below the 50 neutral line, indicating subdued bullish momentum
Both key exponential moving averages (EMAs) sit above current price, functioning as overhead resistance zones, while the Relative Strength Index (RSI), a momentum gauge that measures the speed and magnitude of recent price changes, remains under the neutral midline. Taken together, those readings confirm that near-term price momentum is already pointing in the direction the hike narrative implies. Should the BoJ confirm a September increase, the technical backdrop suggests the path lower for USD/JPY faces relatively little overhead friction.
Federal Reserve communications and US data releases add a secondary variable. They can move the spread from the US side, making this a two-variable story heading into September.
The dollar’s reserve currency mechanics, grounded in its 57% share of global official reserves and its presence on one side of 89% of all FX trades, explain why Fed rate expectations transmit into USD/JPY through capital flow reallocations that are far larger than the bilateral trade relationship between the US and Japan would suggest.
This article is for informational purposes only and should not be considered financial advice. Investors should conduct their own research and consult with financial professionals before making investment decisions.
Where this leaves the Yen before the most consequential BoJ meeting in months
Three layers now point in the same direction. The inflation data provided the immediate trigger. The swap market’s 78-85% probability represents the current market verdict. And the yield differential compression, driven from both sides of the spread, is the structural force that persists beyond any single meeting.
The next informational events arrive before the decision itself:
- August 27: Deputy Governor Ryozo Himino speech
- September 2: Additional BoJ official remarks
- September 10: Final pre-blackout communication window
These speeches are the next opportunities for BoJ officials to either reinforce or begin to chip away at the current probability. At 78-85%, incremental dovish language carries more price impact than incremental hawkish language. The hike is largely priced; what is not fully priced is the tone of guidance that accompanies it.
Market forecasts from Mizuho and Bloomberg sources point to a policy rate of 1.25-1.50% by year-end 2026 if the BoJ confirms its accelerated normalisation cadence.
A 78-85% probability is high, but it is not certainty. The rate decision itself matters less now than the guidance tone. If you understand that distinction, you are better positioned to interpret BoJ communications in real time rather than waiting for the September 18 outcome and reacting after the move.
Past performance does not guarantee future results. Forward-looking statements regarding BoJ policy direction are subject to change based on incoming economic data and market developments.