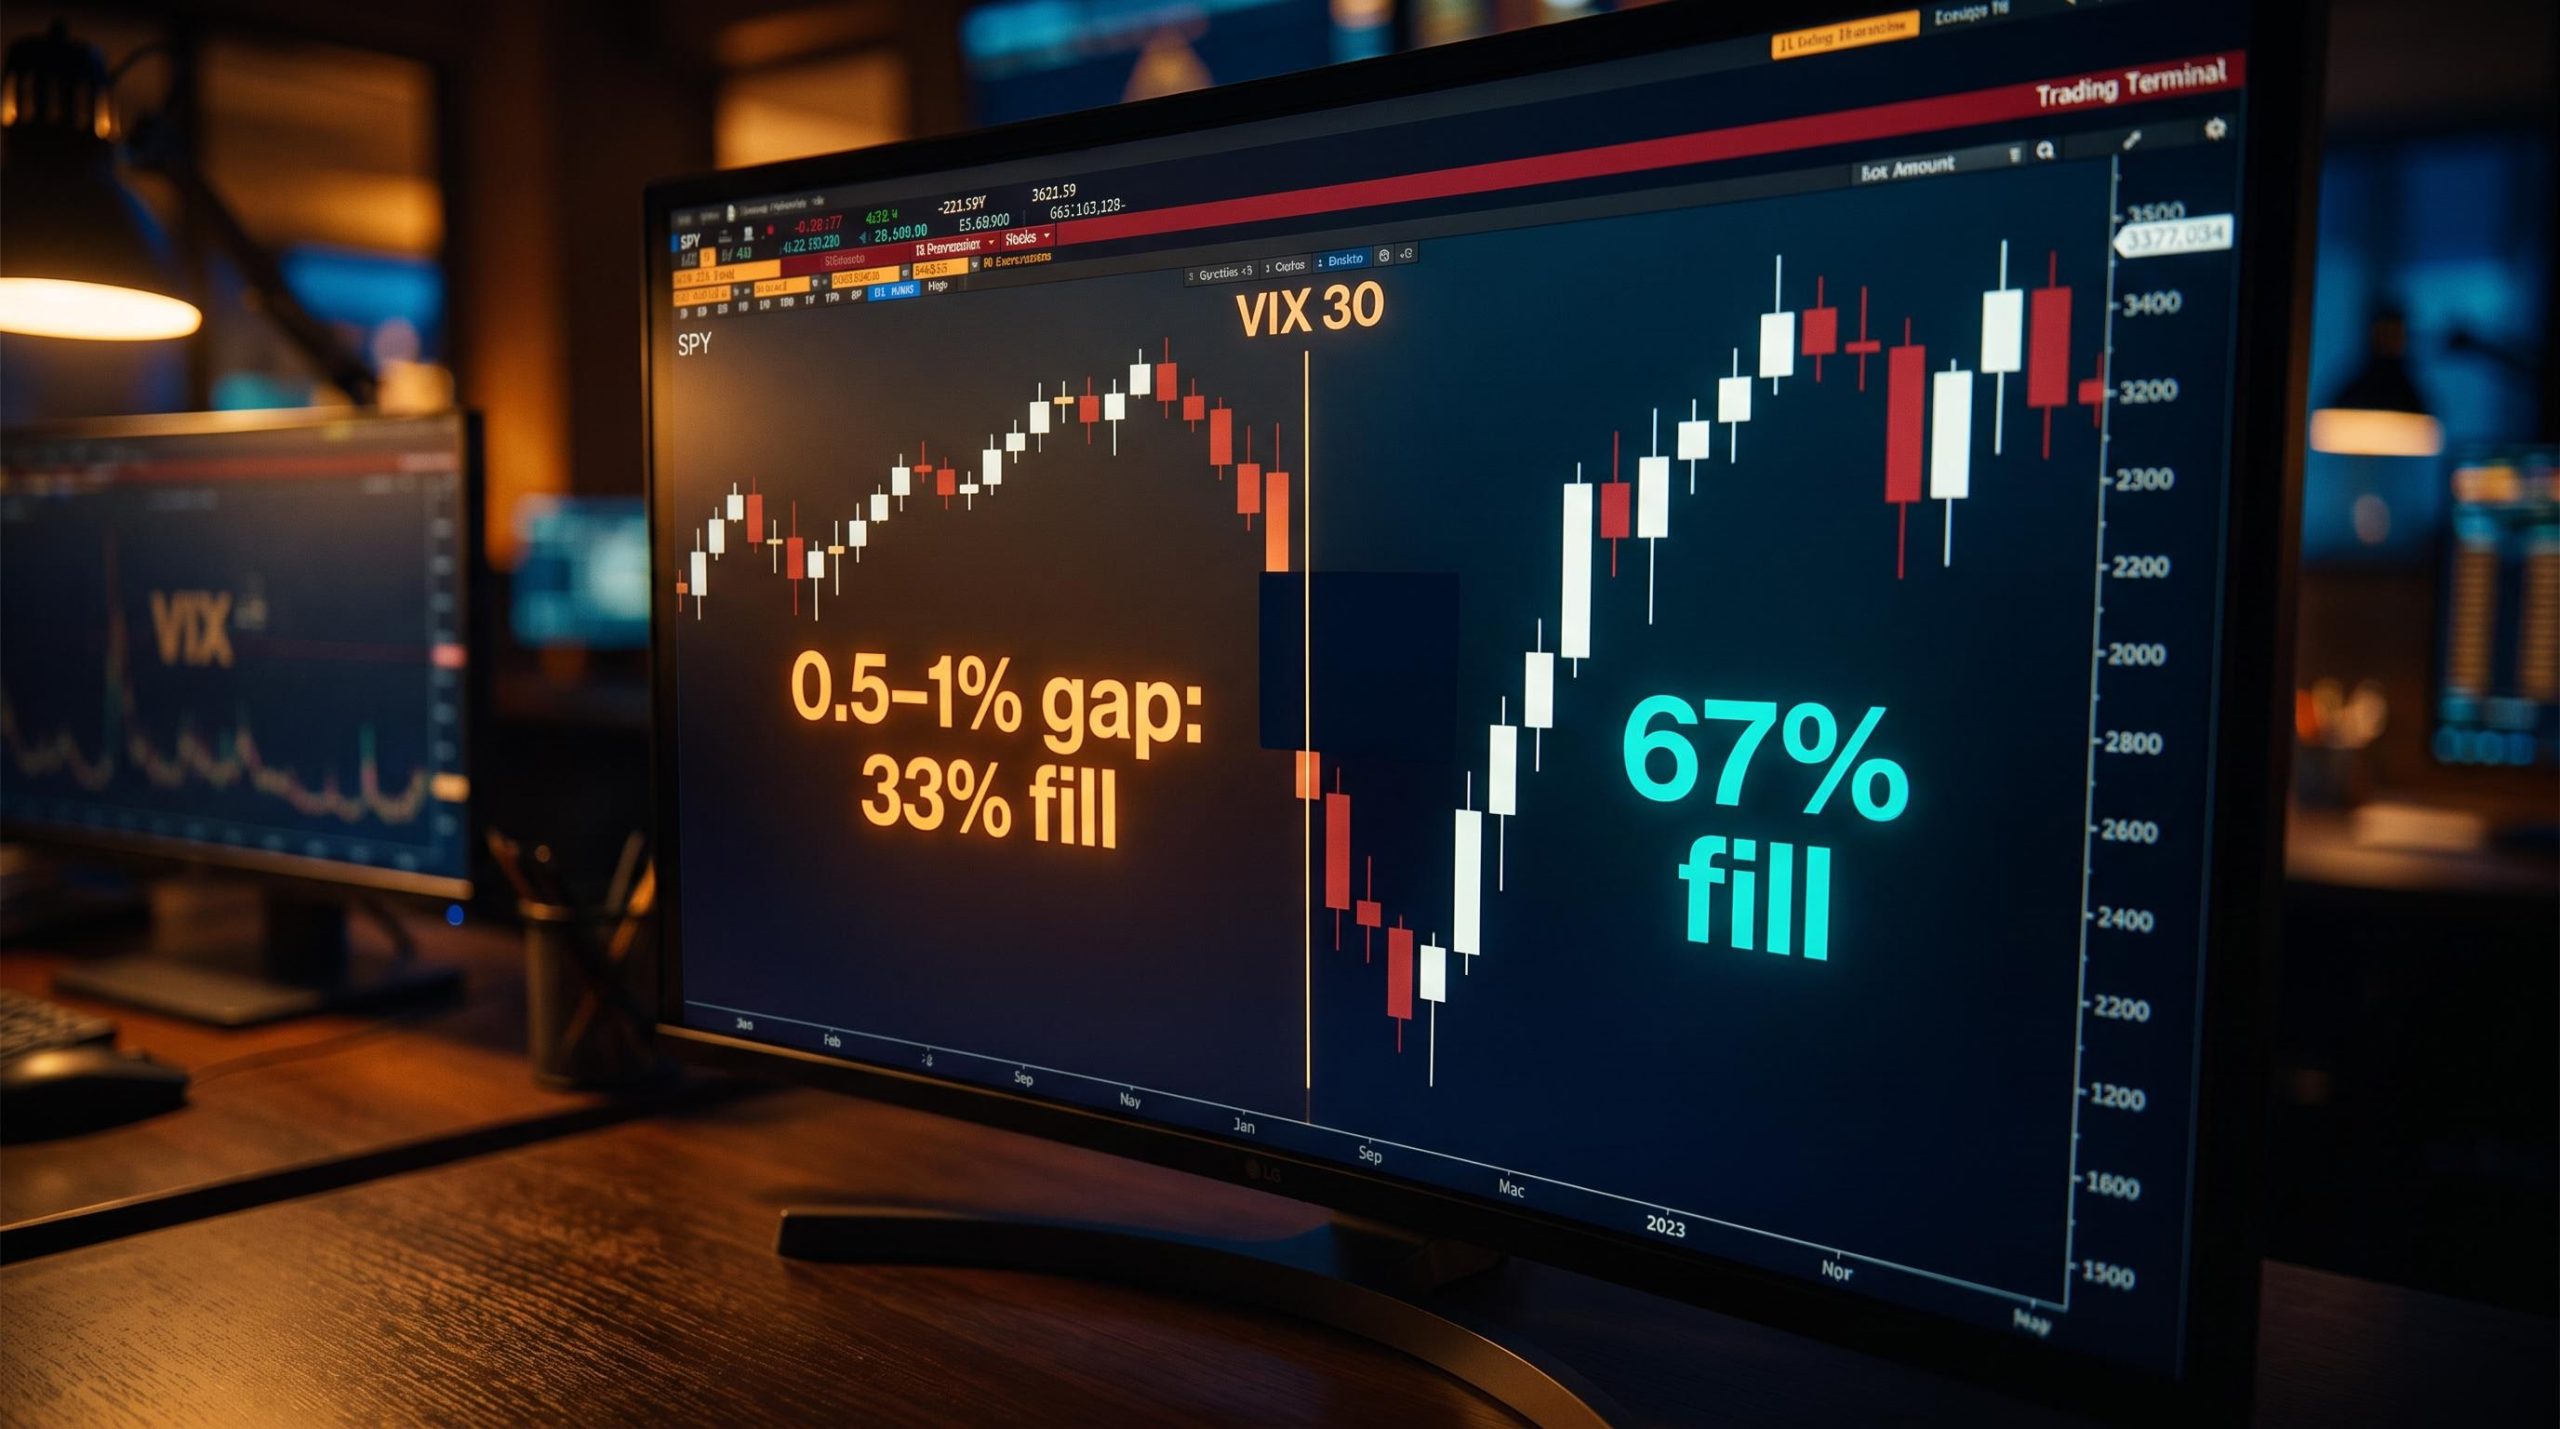
“SPY gaps always fill.” It is one of those market truisms that sounds bulletproof until you test it. Across roughly 2,400 trading sessions from 2017 through 2026, the aggregate same-day fill rate lands somewhere around 60-70%. That sounds convincing. Then you split the data by gap size and the number fractures into readings that range from 85% down to a coin flip.
The dataset spans nearly a decade of trading, capturing low-volatility grind periods, the 2020 pandemic dislocation, the 2022 rate-shock drawdown, and several geopolitical episodes that sent overnight futures gapping in both directions. That breadth matters. A single-regime sample would tell you what gaps do in one environment. This one tells you what they do across several.
Here is the framework that turns the folklore into something testable. After this, you will be able to assess any overnight SPY gap by running it through two filters, gap size and implied volatility regime, rather than defaulting to the assumption that the gap will simply close itself by the bell.
The overnight gap landscape: what 2,400 sessions actually look like
The first thing the distribution data makes clear is how small most overnight gaps actually are. Nearly half of all sessions produced a gap that barely registered.
The 2017-2026 sample shows that roughly 44% of all overnight gaps were contained within a narrow band stretching from -0.25% to +0.25%. The gap-fill debate is overwhelmingly a debate about this bucket.
The data shows that the vast majority of overnight gaps, close to 90%, were contained within the -1% to +1% range. Sessions where the gap stretched beyond plus or minus 1% accounted for only about one in every ten trading days. Readings that pushed past plus or minus 1.5% were genuinely rare, averaging roughly nine such sessions across an entire calendar year and sitting well out in the distribution’s tail.
SPY’s average absolute overnight gap sits in the 0.4-0.5% range. Compare that with SPY’s daily return standard deviation of approximately 1.2-1.3%, and the scale difference becomes obvious. Overnight moves are materially smaller than full-session swings, which means even a 0.5% gap is significant relative to typical overnight noise, even though it looks modest next to an average intraday move.
| Gap size bucket | Approximate frequency | Character |
|---|---|---|
| Under ±0.25% | ~44% of sessions | Noise-level; near-automatic fill |
| ±0.25% to ±0.5% | ~25-30% of sessions | Moderate; still favourable for fill |
| ±0.5% to ±1.0% | ~15-20% of sessions | Regime-sensitive; fill rate varies sharply |
| Above ±1.0% | ~10% of sessions | Repricing event; continuation as likely as reversion |
That concentration at the small end of the spectrum is the single most important feature of the distribution. It means the aggregate 60-70% fill-rate statistic is dominated by a bucket where fills happen almost automatically, pulling the headline number up and masking how unreliable the fill thesis becomes for larger gaps.
When big ASX news breaks, our subscribers know first
How gap size determines fill probability
The fill rate is not a single number. It is a gradient, and the slope is steep.
Across the 2017-2026 sample, gaps smaller than 0.25% resolved back through the prior close within the same session at a rate of roughly 80-85%. This is the only bucket where the gap-fill folklore has strong empirical backing.
These tiny gaps are small enough relative to even the calmest session’s trading range that the market nearly always trades through the prior close at some point during the day. If you hear someone cite SPY’s gap-fill tendency as evidence of a durable pattern, this bucket is doing most of the heavy lifting behind their statistic.
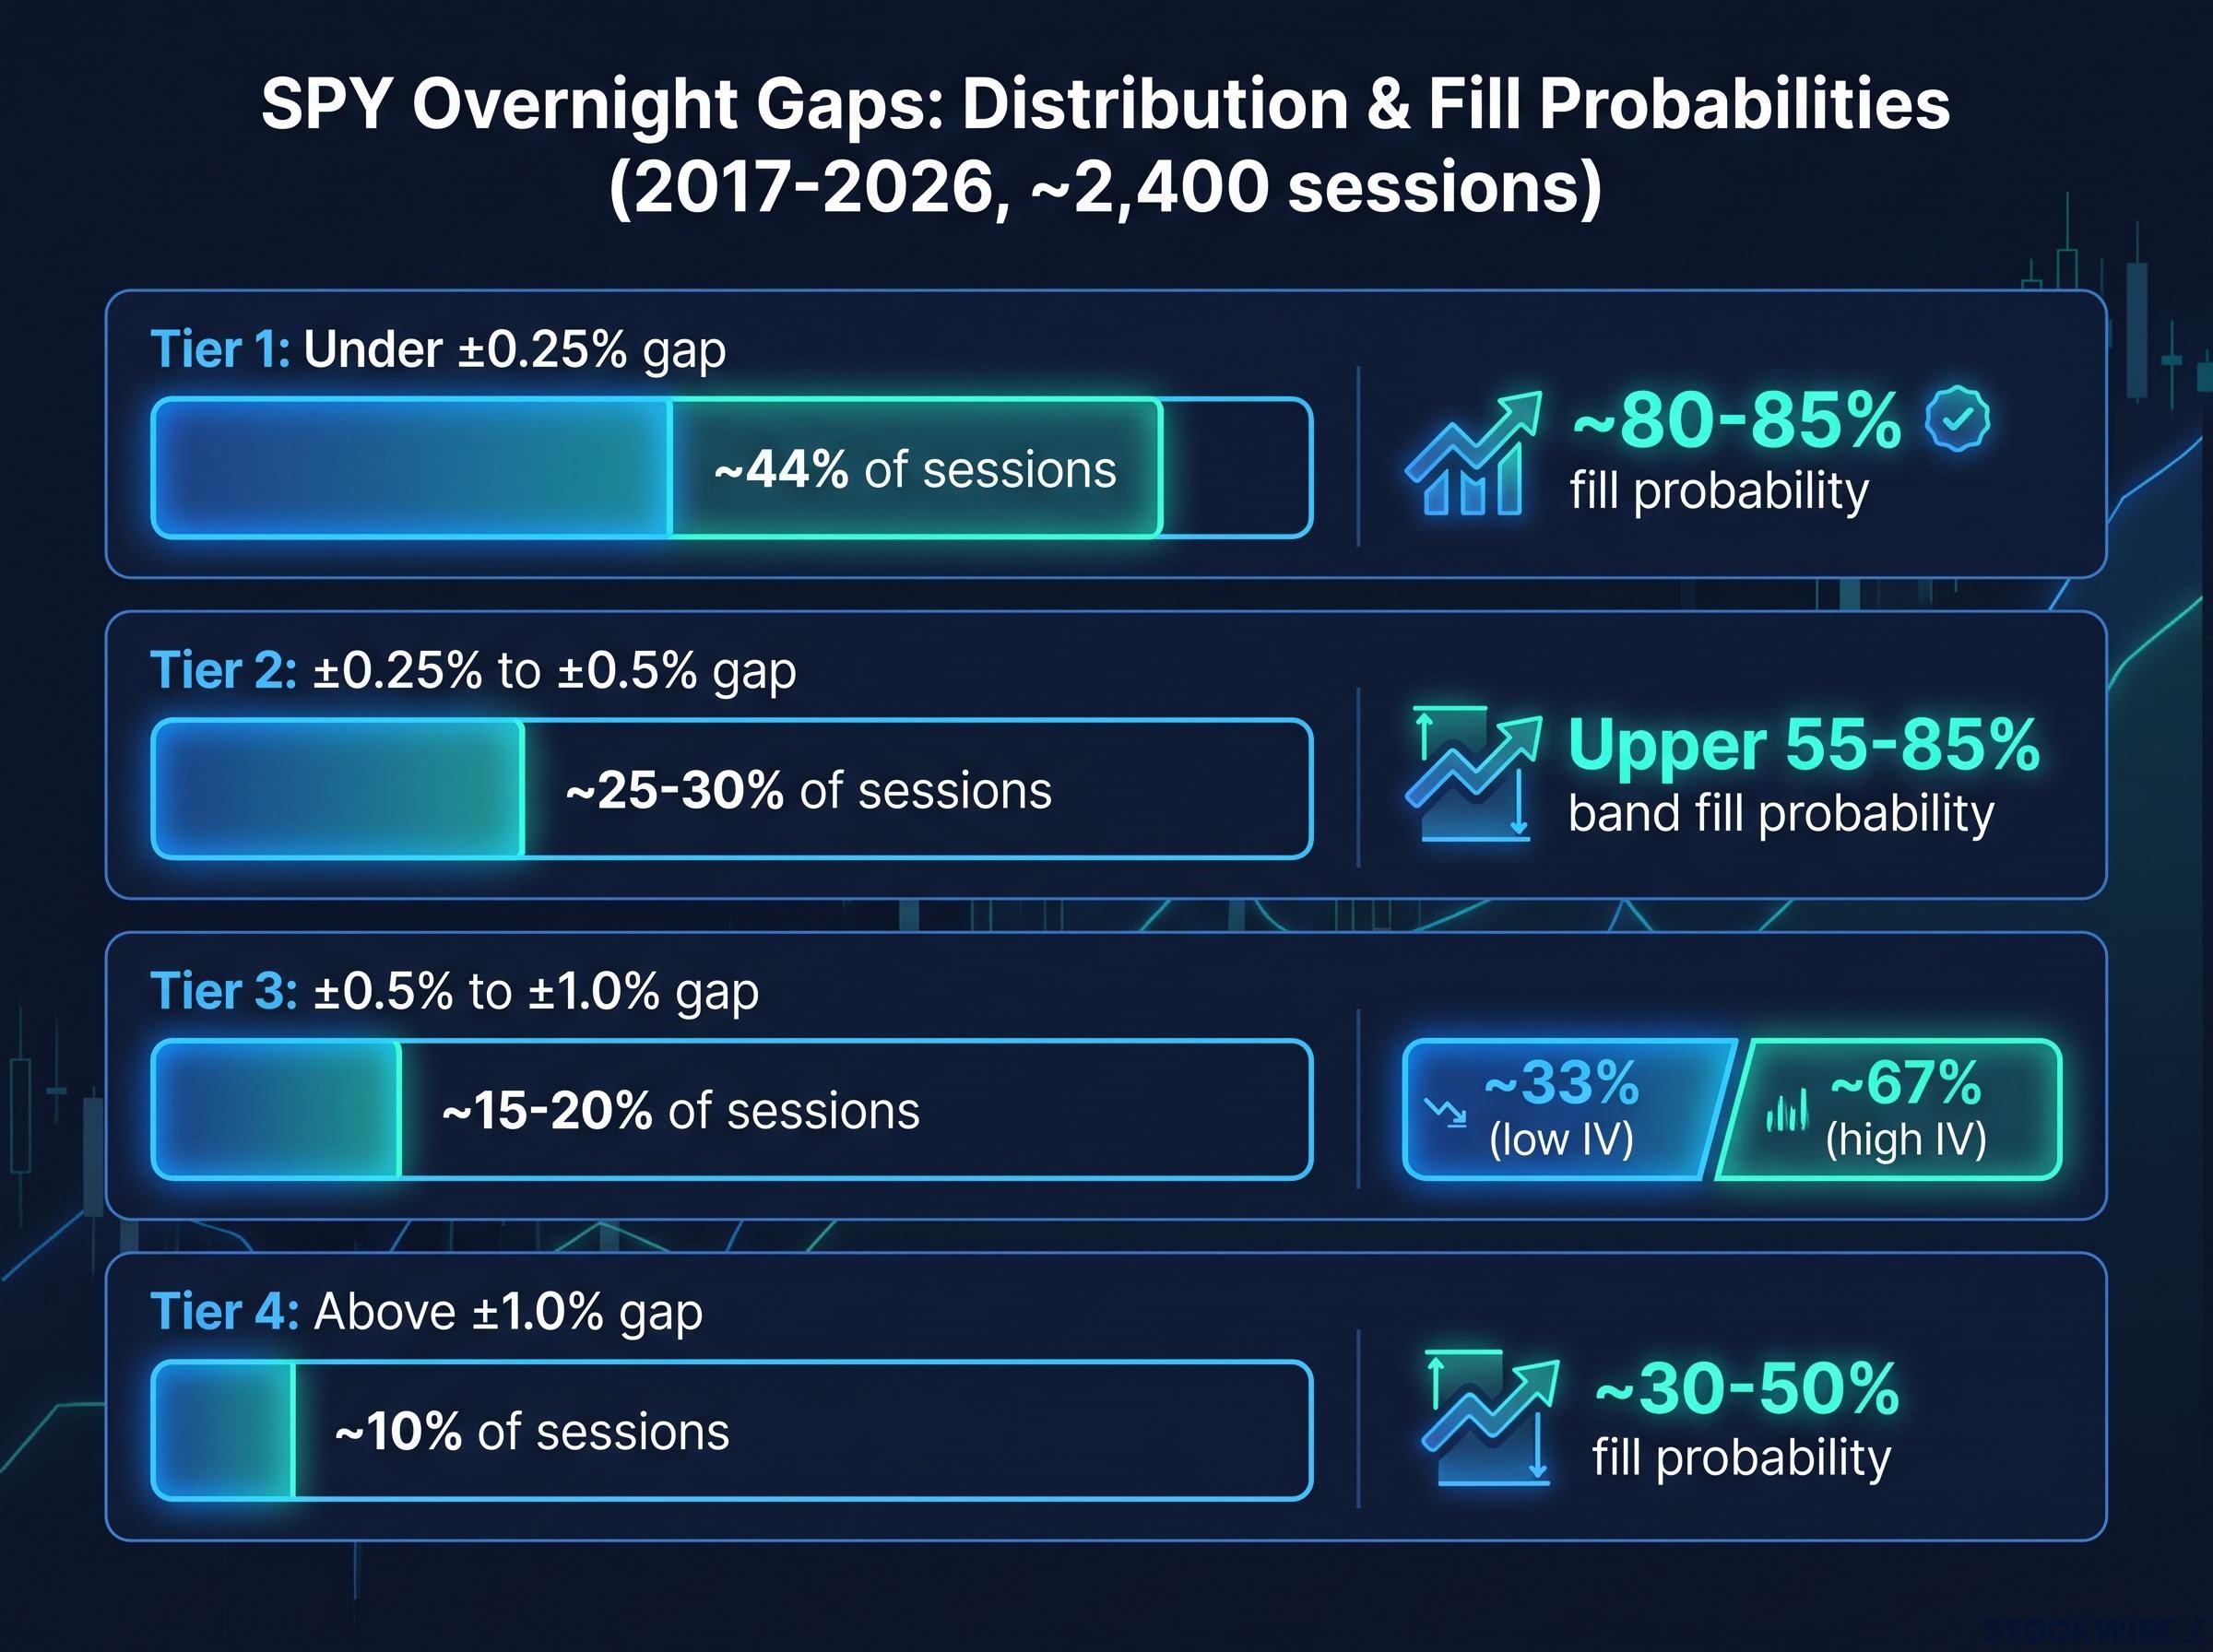
Move up to the 0.25-0.5% range and the fill rate remains favourable, sitting at the upper end of a 55-85% band. Still a probability edge, but less automatic. The market has to do marginally more work, and not every session’s range is wide enough to cover the ground.
| Gap size bucket | Fill probability (same session) | Characterisation |
|---|---|---|
| Under ~0.25% | ~80-85% | Strong mean-reversion candidate |
| ~0.25-0.5% | Upper 55-85% band | Favourable but less automatic |
| ~0.5-1.0% | ~33% (low IV) / ~67% (high IV) | Regime-dependent; single fill rate misleading |
| Above ~1.0% | ~30-50% | Continuation as likely as reversion |
Where the aggregate fill rate hides the real story
The 0.5-1% bucket is where a single fill-rate figure becomes genuinely misleading. The data shows approximately 33% fill probability in a low implied-volatility regime and approximately 67% in a high-volatility one. Averaging those into a single number erases the most useful information in the dataset.
The overall 60-70% aggregate is the figure most likely to appear in market commentary. It is technically accurate. It is also practically unhelpful. Because the sub-0.25% bucket accounts for nearly half of all sessions and fills at 80-85%, it drags the aggregate upward even as moderate and large gaps fill far less reliably. The number you are most likely to encounter is dominated by the gap size least likely to challenge your assumptions.
Why implied volatility changes everything for moderate gaps
The reason the 0.5-1% bucket splits so dramatically by regime is geometric, not statistical. Implied volatility, measured here using the VIX (the CBOE Volatility Index, which quantifies the market’s expectation of near-term S&P 500 price swings), tells you how much ground the market is likely to cover in a session. When that range changes, so does the probability that the market’s intraday path crosses back through the prior close.
VIX regime signals carry a similar dual-layer interpretation: the spot reading captures near-term realised volatility expectations while the futures curve reveals what professional volatility markets are pricing across a longer horizon, a distinction that matters when using the index as a gap-fill filter rather than a directional market call.
During the backtest period, the typical intraday range in calm conditions ran at roughly 1%, while elevated-volatility conditions pushed that figure to approximately 3%, a tripling of the available session range that mechanically reshapes what is geometrically possible within a single trading day.
The practical dividing line sits at a VIX reading of 30. Below that threshold:
- Average intraday range: approximately 1%
- A 0.7% gap can sit at or beyond the outer limit of the day’s typical range
- Same-session fill rate for 0.5-1% gaps: approximately 33%
- A gap of this size is more likely a mild repricing than a reversion candidate
Above a VIX of 30:
- Average intraday range: approximately 3%
- The same 0.7% gap is now well within the session’s expected path
- Same-session fill rate for 0.5-1% gaps: approximately 67%
- The setup improves materially, but is still not automatic
Small gaps under 0.25% show high fill rates regardless of regime. The daily range in even the calmest environment comfortably encompasses a gap that small. The regime filter’s value is concentrated in the moderate-gap bucket, where it roughly doubles the fill probability.
One nuance matters here. High volatility raises the base rate of touching any given level, including the prior close, because the market’s intraday path is longer and more jagged. A fill becoming geometrically plausible does not make mean reversion the guaranteed outcome. Sustained directional movement remains entirely possible even when the VIX is elevated. The regime filter tells you the fill is plausible, not that it is likely to happen on its own.
What this tells you is straightforward: checking VIX before forming a view on a moderate-sized gap is not optional. The same gap carries roughly twice the fill probability in elevated volatility, making the regime filter the single most valuable piece of information available after gap size itself.
Timing, edge decay, and what the data does not tell you
When gaps fill, they tend to fill fast. SPY gap studies report that more than 80% of gaps that ultimately fill do so by midday, with the first two hours of the session carrying the bulk of resolution. That concentration has a direct practical implication: the gap-fill signal is front-loaded.
If a gap has not filled by midday, the probability framework’s signal has largely expired for that session. The gap has either resolved, confirming the mean-reversion thesis, or it has demonstrated resistance to filling, which itself becomes information. Using gap-fill probability as an intraday signal in the afternoon means working with stale data.
The practical decision hierarchy that emerges from the full dataset looks like this:
- Classify the gap size at the open
- Check the VIX level to determine the implied volatility regime
- Anchor the execution window to the first two hours of the session
- Treat post-midday persistence as a signal that the gap may not fill that session
When the fill-rate framework breaks down
Two categories of gap sit outside the framework’s reliable range.
The first is news-catalyst gaps. Large overnight gaps accompanied by identifiable macro catalysts (Federal Reserve decisions, Consumer Price Index surprises, geopolitical shocks) behave more like continuation moves than mean-reverting dislocations. The fill-rate priors built on the full sample are less applicable when the gap reflects genuine informational repricing rather than positioning noise. Same-day fill rates for gaps above 1% fall into the 30-50% range depending on the study, and directional continuation becomes as plausible as reversion.
News-catalyst gaps driven by policy events have shown single-session equity swings ranging from a 2% S&P 500 decline to nearly a 7% surge in specific markets, a range that sits well above the threshold where the gap-fill framework’s priors begin to break down and directional continuation becomes as plausible as reversion.
The second is regime-ambiguous periods. When VIX sits near 30, the regime classification itself is uncertain. The framework draws a line at 30 because practitioners treat that level as a meaningful threshold, but markets do not snap cleanly from one regime to another. In the zone around that boundary, the moderate-gap fill probabilities carry wider uncertainty than the headline numbers suggest.
What to do with the data if you are not a quant
The framework reduces to a two-filter decision sequence that requires no backtesting infrastructure. Both inputs are publicly available at the open of any trading session: gap size (visible on any charting platform) and VIX (readable from any financial data source).
SPY vs comparable ETFs like VOO and IVV differ by up to 0.0645 percentage points in annual expense ratio despite tracking the same index, a cost distinction that becomes relevant for position-sizing decisions once a trader is applying systematic gap-fill strategies across many sessions rather than treating each gap opportunistically.
The sequence:
- Classify the gap by size
- Check the VIX regime
- Apply the timing window: the first two hours carry the strongest signal
The probability tiers that result:
- Sub-0.25% gaps: Fill rate approximately 80-85%. Treat as a strong mean-reversion candidate regardless of regime. The gap is small enough that nearly any session’s range covers it.
- Moderate 0.5-1% gaps with VIX below 30: Fill rate approximately 33%. Treat as mild repricing, not a reversion signal. Mean-reversion assumptions are the minority outcome in this setup.
- Moderate 0.5-1% gaps with VIX above 30: Fill rate approximately 67%. The setup improves materially. Still not guaranteed, but the probability edge is real and worth monitoring.
- Gaps above 1%: Significant caution warranted. Directional continuation is as plausible as reversion. Same-day fill edge erodes substantially.
The value of this framework is not in any single session’s outcome. Any individual gap can do anything. The value comes from applying it consistently across many sessions, where better-than-coin-flip edges compound into a measurably better probabilistic assessment than intuition or the unfiltered aggregate figure provides.
This article is for informational purposes only and should not be considered financial advice. Investors should conduct their own research and consult with financial professionals before making investment decisions. Past performance does not guarantee future results.
A conditional edge, not a law of gravity
“SPY gaps always fill” is partially correct, conditionally useful, and systematically misleading when applied without filters. The data supports the thesis for sub-0.25% gaps, where 80-85% fill rates make mean reversion the dominant outcome. It weakens progressively as gap size increases, and it splits dramatically by volatility regime in the moderate-gap range that matters most.
The question was never whether SPY gaps fill. It was which gaps fill, under which conditions, and over what time window. You now have the specific conditions: gap size as the primary filter, VIX regime as the secondary filter, and the first two hours as the execution window where the signal concentrates. That is not a law. It is a conditional edge, and conditional edges are the only kind worth trading on.
Options market volatility signals have been pointing toward an elevated-volatility regime through the September-November window, with VIX futures clustered in the mid-20s despite a calm spot reading, a forward curve structure that places the current environment squarely in the high-VIX bucket where moderate SPY gaps carry a materially higher fill probability.