
CBA just reported a record $10.9 billion cash profit, and the sector still lost 10.5% in thirteen sessions. That gap between earnings and price tells you something important about how the market is reading this moment.
Across those thirteen consecutive sessions to 23 August 2026, the S&P/ASX 200 Banks Index recorded losses in ten of them. Unlike the November-December 2025 pullback (driven by margin compression concerns) or the February-March 2026 decline (a geopolitical shock that reversed quickly), this episode has a different character. The May 2026 federal budget introduced structural changes to property investor taxation that have directly cut mortgage application volumes across every major lender. The market is not simply repricing for lower near-term earnings; it appears to be reassessing the growth trajectory of the sector’s core product.
Here is what the application data actually shows, why this correction differs from prior pullbacks, how the policy changes flow through to bank earnings, and what specific data points will determine whether this is a structural re-rating or a recoverable drawdown for Australian bank stocks.
How the August 2026 bank sector selloff compares to prior corrections
Placed in isolation, a 10.5% fall across thirteen sessions looks severe, but the past ten months put it in a different light. The Banks Index has already absorbed two pullbacks of comparable scale and clawed back both losses. The first came in November-December 2025, when investors focused on rising costs and ongoing margin pressure following a CBA quarterly update; the index shed roughly 11% before recovering as the margin outlook improved. The second arrived in February-March 2026, when the onset of conflict between the US and Iran knocked the sector lower; it rebounded sharply after a ceasefire was announced in early April and Bendigo Bank delivered a stronger-than-expected third-quarter result.
The pattern was familiar: external catalyst, identifiable resolution, recovery.
| Period | Approximate decline | Primary catalyst | Recovery pattern |
|---|---|---|---|
| November-December 2025 | ~11% | Margin compression concerns (CBA quarterly update) | Reversed as margin outlook improved |
| February-March 2026 | Comparable magnitude | Geopolitical shock | Reversed post-ceasefire and Bendigo quarterly |
| August 2026 (current) | 10.5% across 13 sessions | Budget-driven mortgage application decline | No resolution catalyst currently visible |
This time, the catalyst is internal to the banks’ core business. On 13 May 2026, CBA recorded a single-session decline of 10.4%, the steepest one-day fall in the company’s listed history, timed to the budget’s announcement of property investor tax changes. Its full-year result delivered record cash profit, up 7% to $10.9 billion, yet was described as “clouded” by the 15% mortgage application slump and investor-lending weakness.
ANZ management noted that all majors are seeing 12-20% declines in home-loan applications since the budget.
The fact that a record profit result could not arrest a sustained thirteen-session decline tells you the market has shifted its analytical frame from what banks earned last year to what they will lend next year.
ASX bank valuation premiums entering this correction were already stretched relative to global peers, with CBA trading at roughly 27-28x forward earnings against a long-run average of 18x and the sector’s weighted average price-to-fair-value sitting above 1.1, which means the re-rating from policy headwinds started from a more vulnerable base than either of the prior 2025-2026 pullbacks.
When big ASX news breaks, our subscribers know first
What the May budget actually changed, and why investor credit is falling faster
Three discrete policy changes in the May 2026 federal budget are driving the mortgage application data lower.
| Measure | Detail | Effective date | Borrower type affected |
|---|---|---|---|
| Negative gearing restriction | Limited for established residential properties acquired after 12 May 2026; existing arrangements grandfathered; new builds exempt | 1 July 2027 | Property investors (established dwellings) |
| SMSF borrowing ban | New limited-recourse borrowing arrangements (LRBAs) for SMSFs purchasing residential property banned; existing LRBAs grandfathered | Immediate | SMSF trustees seeking residential property |
| Capital gains tax changes | Altered CGT treatment for property investors as part of broader budget package | Confirmed | Property investors |
The key distinction from a rate-driven slowdown is visible in the application data. Investor applications are falling faster than owner-occupier applications across every major lender. That is the fingerprint of a tax-incentive change, not a broad affordability shock.
CBA reported mortgage applications down 15% overall since the 12 May budget, with investor applications down 28%. Westpac reported a 20% decline in mortgage applications and expects investor housing credit growth to halve next year. ABS data for the June quarter 2026 confirm the pattern: investor loan commitments fell 8.6%, while total new home loans declined 5.4%. The investor segment is leading the contraction.
ABS lending indicators for the June quarter 2026 confirm the investor-led contraction: investor loan commitments fell 8.6% while total new home loans declined 5.4%, providing the primary statistical anchor for the structural shift argument.
Equifax data cited by Pepper Money management showed mortgage inquiries running 20% below year-earlier levels for the three months to July 2026, and 15% lower than the period immediately before the May budget. The new build exemption from negative gearing restrictions creates a split lending market, where established property investor demand falls sharply while new construction lending may be partially insulated, but the aggregate effect on application volumes is unambiguous.
The negative gearing restrictions introduced in the May budget are more granular than headline reporting suggested: the ring-fence applies to established properties acquired after 12 May 2026, existing holdings are grandfathered indefinitely, and new builds retain full eligibility, a three-way split that directly explains why investor application volumes are falling sharply while new construction lending may be partially insulated.
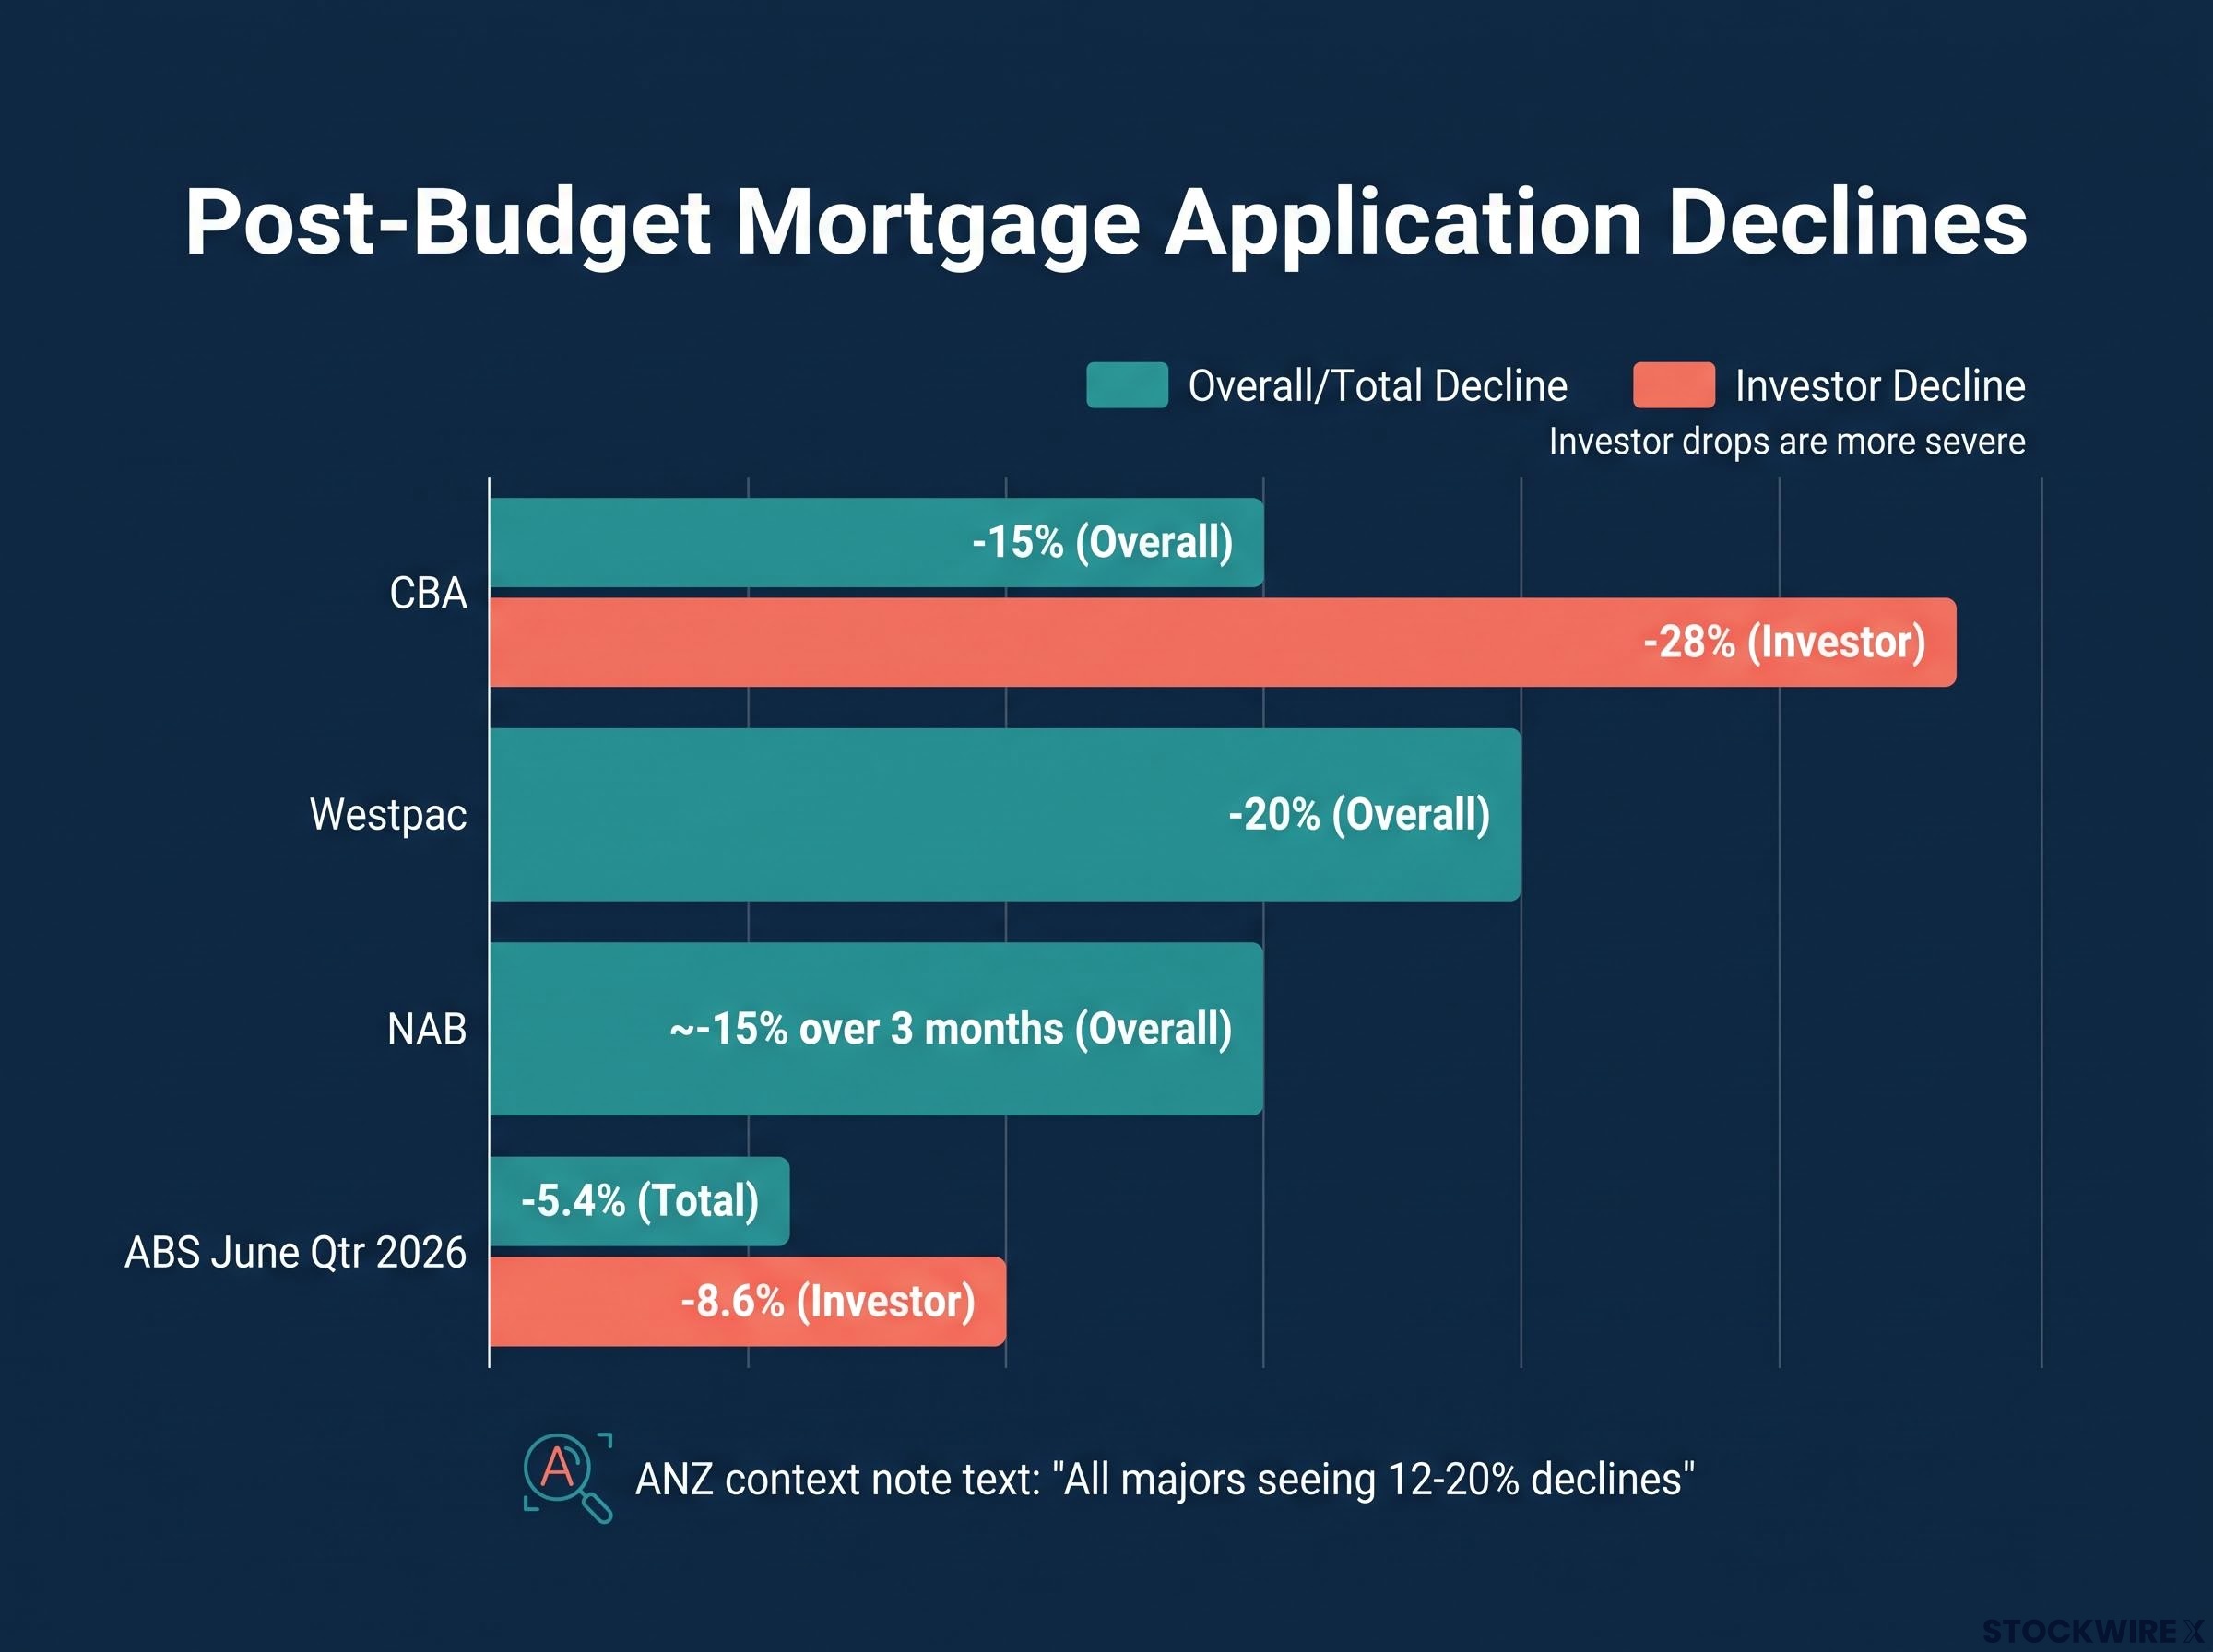
The divergence between investor and owner-occupier application declines is the clearest signal available that this is a policy-driven demand shift rather than a cyclical slowdown. The policy settings remain in place until at least 2027, which matters for how you think about duration.
The SMSF channel: a near-complete halt in one lending segment
The ban on new limited-recourse borrowing arrangements (LRBAs), which are loan structures that allow self-managed super funds (SMSFs) to borrow money to buy assets, has had an immediate and severe effect in one specific channel. According to Pepper Money management, SMSF residential lending has come to a complete stop, with affected borrowers pivoting to commercial SMSF structures instead. Growth in non-conforming and owner-occupied lending, alongside stronger refinancing, debt consolidation, and construction activity, has partially made up the gap.
This is a management-reported observation consistent with policy direction rather than a confirmed system-wide statistic; SMSF residential lending data is not yet fully represented in public ABS datasets. But the directional signal is clear.
How lower mortgage volumes flow through to bank earnings
The earnings impact runs through four distinct channels, each compounding the others:
- Loan-book growth deceleration. With application volumes down 12-20% across the Big Four, forward loan book growth is slowing materially. ABS data already show total new home loans contracting 5.4% in the June quarter. NAB reported home lending applications down approximately 15% over the three months to its reporting date, roughly mid-teens lower than a year earlier.
- Margin compression on remaining volume. As banks compete for a smaller pool of creditworthy borrowers, pricing pressure intensifies. The sector may face simultaneous volume and margin headwinds rather than being able to trade one off against the other as it has historically. Westpac’s expectation that investor credit growth will halve removes a higher-yielding segment from the lending mix, compounding the margin dynamic.
The divergence in housing credit forecasts between the major banks carries its own signal: NAB is projecting just 2.5% growth for FY27, against CBA’s revised 4-5% guidance, and the directional movement of the more optimistic bank toward the pessimist tells you something about where internal data is pointing.
- Non-bank and smaller lender vulnerability. Lenders with less diversified earnings bases absorb volume declines earlier and more acutely. Pepper Money’s commentary on the SMSF halt and mortgage volume pressure illustrates the dynamic: smaller lenders are the earliest-cycle casualties when housing volumes fall.
- Investor segment mix effect. The investor segment carries higher average loan balances and higher activity rates than owner-occupier lending. Its disproportionate decline, visible in CBA’s 28% investor application drop, compounds the book growth slowdown beyond what the headline application figures suggest.
The RBA has observed that demand for new home loans has “declined noticeably.”
The simultaneous prospect of lower volumes and tighter lending margins means the banks cannot simply grow revenue by fighting harder for the remaining borrowers. That is the scenario that would limit the earnings impact. Instead, the earnings headwind may be wider than initial application-volume data alone suggests, which tells you that consensus estimates for bank earnings may not yet have fully absorbed the structural shift.
Five signals that will tell you whether this correction has further to run
The level of decline is established. What matters now is the second derivative: whether volumes are still worsening, plateauing, or beginning to recover. Some executive commentary in early August 2026 hints at tentative stabilisation, but this is premature to treat as a trend rather than a data point.
Five monitoring inputs, ranked by informational priority, will determine what comes next:
- ABS monthly lending indicators. The most authoritative statistical measure of new loan commitments by borrower type. Investor versus owner-occupier splits are where the structural signal lives.
- CBA quarterly updates. As the sector bellwether with the most timely quarterly update cadence, CBA’s operational data provides the earliest read on whether the application decline is stabilising.
- Non-bank lender guidance. Pepper Money and similar lenders offer early-warning sensitivity given their exposure to SMSF and non-conforming segments. Volume shifts show up here first.
- Government messaging on property tax and SMSF policy. The negative gearing restrictions take effect on 1 July 2027. Any legislative amendment before that date would be a material catalyst in either direction.
- RBA rate decisions. Rate cuts could partially offset the demand destruction from policy changes, particularly for owner-occupier borrowers, though they would not reverse the investor-specific tax incentive shift.
Until ABS monthly data show two consecutive months of investor commitment stabilisation, any individual executive comment about improving momentum should be treated as a data point rather than a conclusion.
Quantifying housing price downside scenarios requires separating structural floors from cyclical pressure: chronic undersupply, tight rental conditions, and government deposit support all constrain how far prices can fall, which matters for how much of the bank earnings impact flows through collateral devaluation versus pure volume loss.
Broader context: what retail and consumer data add to the picture
Retail spending data, household savings rates, and consumer sentiment indicators provide the macro frame for assessing whether housing weakness is a banking sector story or a household balance sheet story.
Results season commentary paints a mixed but not recessionary picture. Vicinity Centres posted 3.3% portfolio moving annual turnover growth and characterised its sales performance as broadly holding up, though with notable choppiness across periods. Temple and Webster flagged a modest softening in buyer conversion, noting that shoppers are browsing as actively as before but spending more time before committing to a purchase. Super Retail reported that the fuel crisis over the Easter period weighed on what had been a strong first half.
The broader consumer backdrop is uneven rather than collapsed, which limits the downside scenario for bank credit quality even as loan growth slows. This is context, not conclusion; the banks’ core challenge remains the policy-driven contraction in investor lending specifically.
What this correction changes, and what it does not
Two facts sit side by side, and neither cancels the other.
Australian major banks remain profitable and well-capitalised. CBA’s $10.9 billion record cash profit, up 7%, is the clearest evidence that the sector is not in financial distress. The current earnings base is strong.
CBA delivered a record $10.9 billion cash profit for FY26, up 7%, yet the sector’s mortgage application volumes have fallen 12-20% across every major lender since the May budget. The gap between what the banks earned and what they will lend is the central tension.
At the same time, the policy change driving application declines is legislated, with no current signal of reversal. The negative gearing restrictions take effect on 1 July 2027. Hub24 management flagged that superannuation is poised to become a more compelling savings destination, with voluntary top-up contributions expected to grow over time, pointing to a broader structural rotation away from leveraged property investment as a wealth-building strategy.
The recovery dynamics question is the one that separates this correction from its predecessors. The November-December 2025 pullback reversed because margin concerns eased. The February-March 2026 decline reversed because the geopolitical trigger de-escalated. Both had identifiable, external catalysts that resolved. This correction’s catalyst is a legislated change in investor tax settings that will remain in place unless explicitly reversed by government. No equivalent resolution catalyst is currently visible.
What would need to be true for the structural re-rating to stabilise: sustained ABS volume stabilisation across two or more months, or a credible signal of policy modification before the 1 July 2027 effective date. What would need to be true for it to deepen: continued investor commitment declines through the second half of 2026, confirming that the demand destruction is not finding a floor.
This article is for informational purposes only and should not be considered financial advice. Investors should conduct their own research and consult with financial professionals before making investment decisions. Past performance does not guarantee future results. Forward-looking statements regarding policy impacts, lending volumes, and earnings trajectories are subject to change based on market developments, government policy decisions, and company performance.