
The Federal Reserve can move interest rates in an afternoon. It can inject liquidity into the banking system before markets open. It can reverse course on policy guidance between one press conference and the next. And yet, sitting on its balance sheet right now, is a $1.93 trillion mortgage position whose effective life stretches well past 2035, a commitment with the same structural patience required of a 30-year homeowner, embedded inside an institution that prizes flexibility above almost everything else.
This is not a solvency problem. The Fed is not going broke, and its ability to conduct monetary policy remains intact. But it is a constraint, one that will shape what the central bank can and cannot do with its balance sheet for the better part of a decade. That matters right now because it intersects directly with live questions about inflation management, balance sheet normalisation, and Kevin Warsh’s reported ambition of returning the Fed’s balance sheet to pre-COVID size.
Here is a framework for understanding why the Fed’s agency mortgage-backed securities (MBS) portfolio, bonds backed by pools of home loans, is not simply a large holding waiting to be unwound, and what the mechanics of that constraint mean for Treasury yields, bank reserves, and the trajectory of U.S. monetary policy through the late 2020s and beyond.
How the Fed built a $2 trillion mortgage position it cannot easily exit
The position did not appear overnight. The Federal Reserve accumulated its agency MBS holdings through successive rounds of quantitative easing (QE), large-scale bond-buying programmes designed to push down long-term interest rates, concentrated in the pandemic-era purchases of 2020-2022. At their peak, holdings reached the $2.2-2.58 trillion range before ongoing runoff brought the balance to approximately $1.93 trillion by mid-August 2026.
Each purchase round followed the same logic, and a serious body of research supported it. The Fed was attempting to compress term premiums, the extra yield investors demand for holding longer-dated bonds, and support the mortgage market at a moment of acute uncertainty. The three channels it cited were straightforward:
- Direct mortgage market support through demand for agency MBS
- Term premium compression across the yield curve
- A portfolio balance effect, pushing investors into riskier assets as safe yields fell
“Fed economist studies estimate cumulative holdings pushed 10-year yields down by 80-120 basis points at various points during the QE period.”
Fed FEDS research on large-scale asset purchases provides empirical support for the term-premium compression argument, finding that accumulated MBS and Treasury holdings materially reduced long-term yields across multiple purchase rounds, the same mechanism behind the 80-120 basis point estimates cited in the QE literature.
The empirical case was real. The problem was not that the strategy lacked a theoretical foundation. It was that the risks of exit, specifically the risk that these assets would extend dramatically in duration once rates rose, were materially underweighted. Both Jerome Powell and Janet Yellen have been publicly identified as responsible for the portfolio strategy decisions that created the current position. What seemed like a flexible, reversible intervention at each step became, in aggregate, a trap visible only in hindsight.
When big ASX news breaks, our subscribers know first
What extension risk means and why it explains the Fed’s current problem
If you watch mortgage data at all, you have seen the number that explains everything about this portfolio: prepayment speed. Prepayment speed measures how quickly homeowners pay off their mortgages ahead of schedule, usually through refinancing. When mortgage rates are low, homeowners refinance aggressively, prepayments surge, and the effective life of mortgage-backed securities stays short. The bonds pay off quickly, and the holder gets capital back to redeploy.
Mortgage rate mechanics sit at the centre of this constraint: the 30-year fixed rate is mechanically tied to the 10-year Treasury yield plus a spread of approximately 2 percentage points, meaning the Fed’s own rate decisions directly suppressed the prepayment speeds that now determine how long its MBS book remains on the balance sheet.
When rates rise, the opposite happens. Homeowners with 2-3% mortgage rates have no incentive to refinance into 6-7% loans. Prepayments collapse. The effective life of those MBS pools stretches far beyond what anyone expected when the bonds were purchased.
This is extension risk: the duration of MBS is not fixed. It moves with the rate environment. And because the Fed’s own rate hikes in 2022-2023 are what drove mortgage rates higher, it effectively extended the life of its own portfolio through its own policy decisions.
The numbers behind the extension
The scale of that extension is striking. In the COVID era, when prepayment speeds were elevated, analyst Chris Whalen puts the weighted average life of these pools at approximately 1.5-2 years, meaning the Fed was recovering principal relatively quickly.
Today, the picture is fundamentally different.
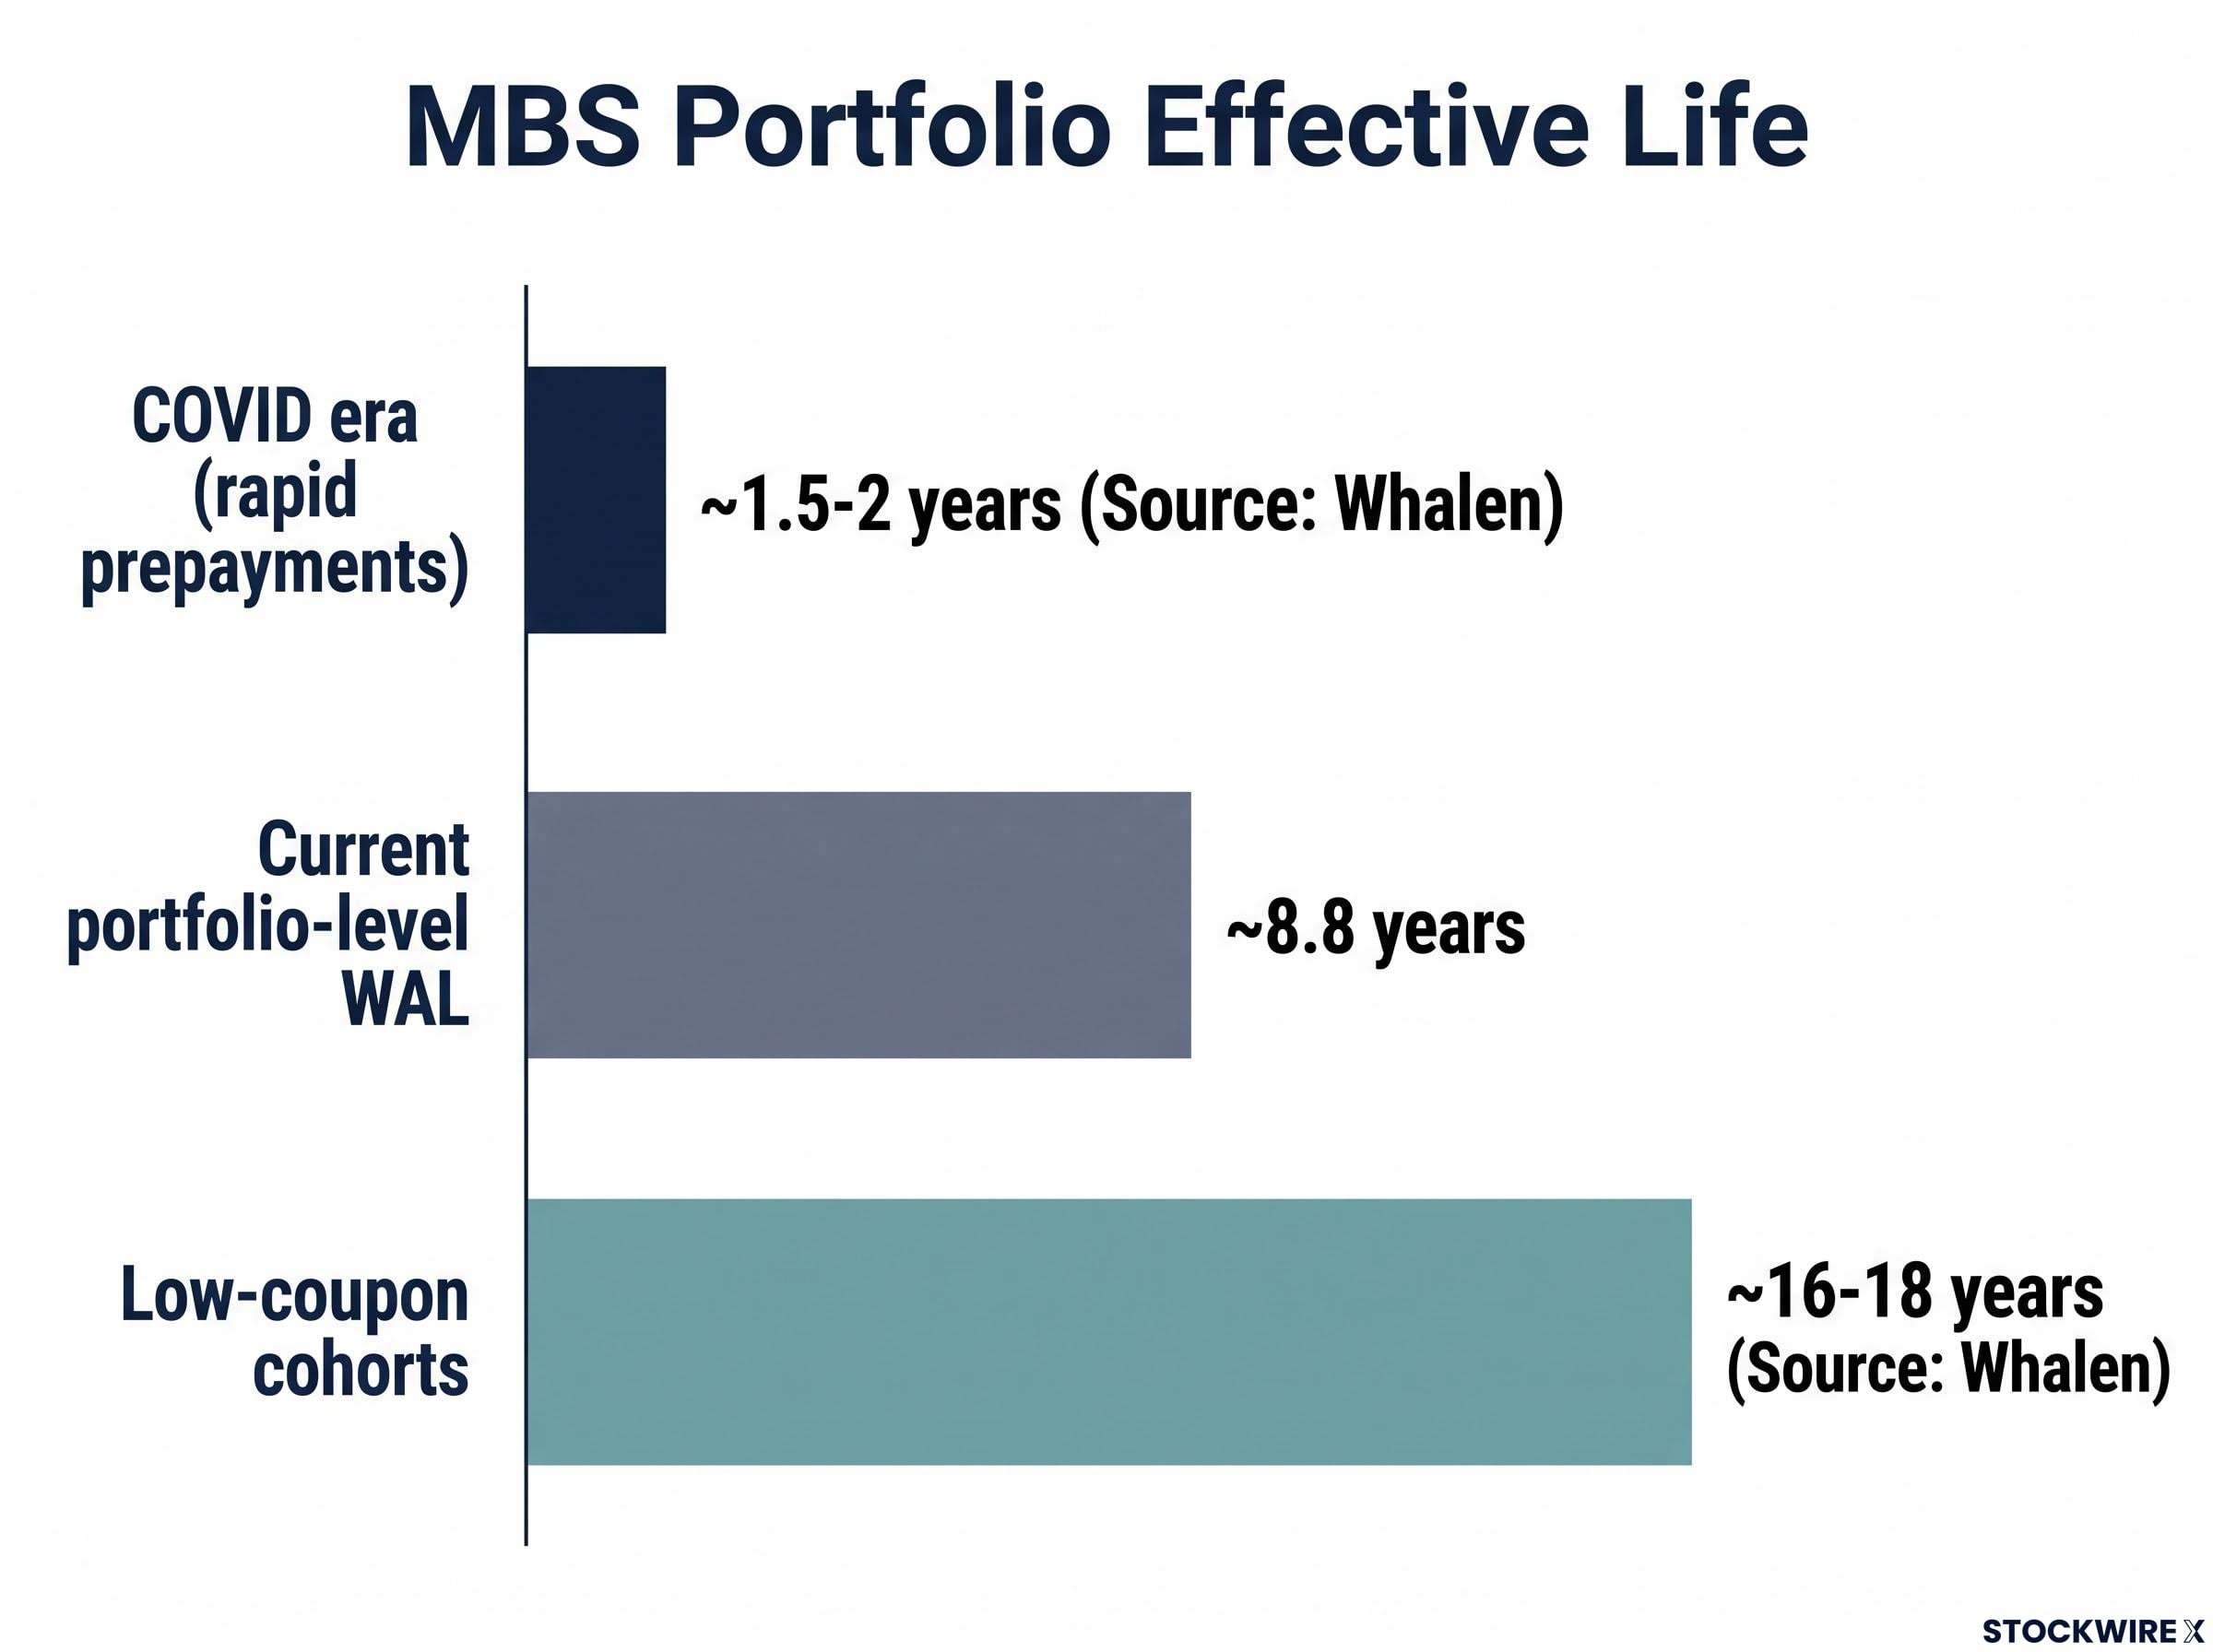
| Period | Effective life | Source / scope |
|---|---|---|
| COVID era (rapid prepayments) | ~1.5-2 years | Whalen; pool-level characterisation |
| Current portfolio-level WAL | ~8.8 years | Detailed portfolio review; weighted average life |
| Low-coupon cohorts (fully extended) | ~16-18 years | Whalen; specific low-coupon vintage estimate |
A distinction matters here. Whalen’s 16-18 year estimate targets the specific low-coupon vintage pools, those carrying coupons of roughly 2-3% that are furthest below prevailing mortgage rates. Portfolio-level analysis supports a weighted effective duration of approximately 6.3 years and a weighted average life of approximately 8.8 years for the overall book, with lower-coupon cohorts clustering in the 10-12 year range. Both framings are valid when applied to their respective scope.
The directional point is the same either way. The Fed did not simply buy long-term assets. It bought assets whose effective duration was very short at the time of purchase and only became long after its own rate decisions changed the environment. That is the mechanism that makes this a trap rather than a simple mismatch.
The Fed’s balance sheet is losing money, and the Treasury is paying the price
You already understand the dynamic from personal finance, even if you have never held an MBS. If you are earning 2.5% on a savings bond but paying 5% on a line of credit, you are losing money on the spread every day you hold both positions. The Fed is in the same situation at institutional scale.
The interest the Fed pays on reserve balances (deposits commercial banks hold at the Fed) and on reverse repurchase agreements now exceeds the income generated by its low-coupon securities portfolio. This negative carry dynamic has produced a sustained net operating loss.
Those cumulative losses do not vanish. They sit on the balance sheet as a “deferred asset,” an accounting entry that will only be worked down once the Fed returns to positive net income. The deferred asset has reached hundreds of billions of dollars.
“One analysis estimates unrealized losses on the Fed’s MBS holdings alone at approximately $423 billion.”
The consequence chain is direct:
- Negative carry produces operating losses each quarter
- Operating losses accumulate as a growing deferred asset on the balance sheet
- The deferred asset blocks the resumption of Treasury remittances, the payments the Fed normally sends to the U.S. government from its earnings
Treasury remittances have been halted entirely. They will not resume until the deferred asset is extinguished. This is not an accounting abstraction. It is a direct reduction in government revenue that would otherwise fund public expenditure, a real fiscal cost of the balance sheet strategy that persists regardless of whether the Fed itself remains operationally sound.
Fiscal dominance, the condition in which government debt servicing constrains what the central bank can do with rates, compounds the MBS problem: each 1-percentage-point increase in the average interest rate on federal debt now costs approximately 1.2% of GDP annually, meaning the Fed’s negative carry losses arrive inside a fiscal environment that can absorb additional pressure poorly.
Why the Fed cannot simply sell its way out
The intuitive response is obvious: if the portfolio is a problem, sell it. The reality is more constrained than that, and understanding why is where the structural argument sharpens.
The Fed’s MBS portfolio is not literally unsellable. But active sales would crystallise enormous unrealized losses, currently estimated in the hundreds of billions. They would also inject significant supply into the mortgage market, pushing MBS prices lower and mortgage rates higher at a moment when housing affordability is already strained. And they would create political exposure that the institution, already managing elevated scrutiny, is not positioned to absorb.
The logic reduces to three steps:
- Active sales crystallise losses that are currently unrealized and amortising over time
- Active sales risk disrupting the mortgage market by flooding it with supply
- Therefore, passive runoff, allowing principal payments to shrink the portfolio gradually, is the only financially and politically viable path
How the low-coupon trap differs across institutional contexts
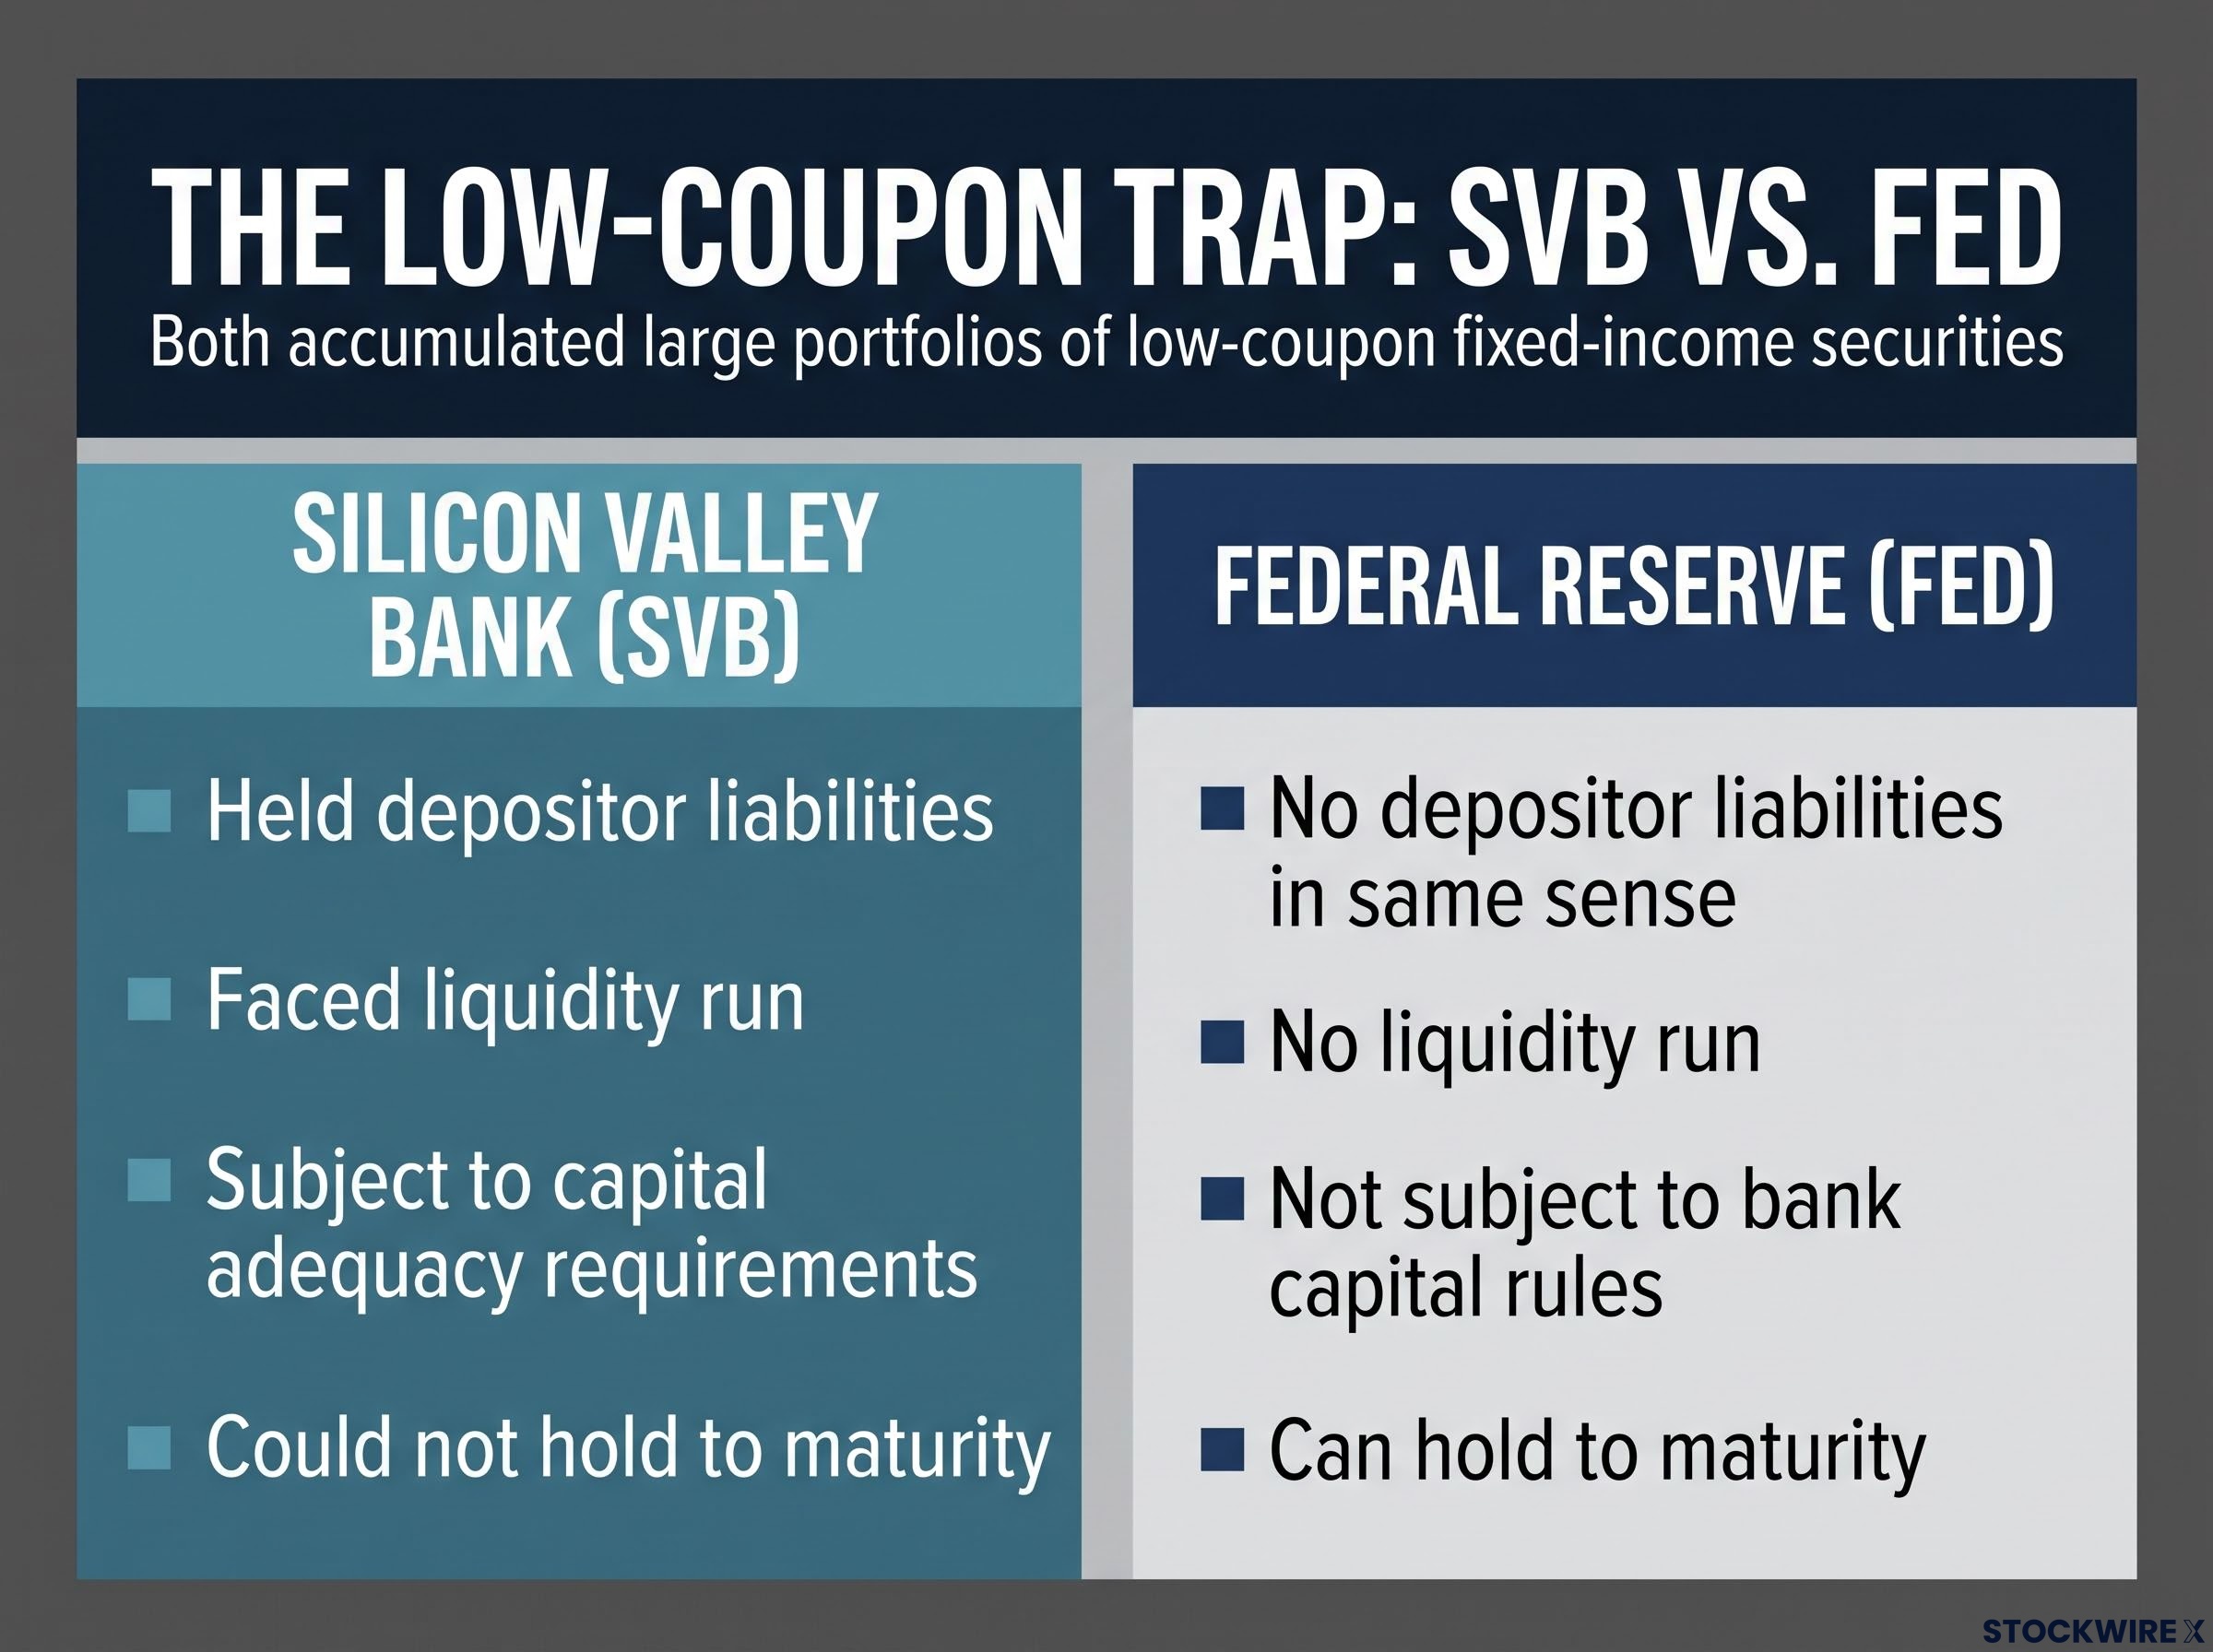
The structural parallel with Silicon Valley Bank is worth drawing precisely. Both the Fed and SVB accumulated large portfolios of low-coupon fixed-income securities that lost substantial market value when rates rose rapidly. SVB’s failure was partially attributed to exactly this dynamic.
The institutional distinction is what determines the outcome. SVB held depositor liabilities, faced a liquidity run, and was subject to capital adequacy requirements. It could not hold to maturity. The Fed holds no depositor liabilities in the same sense, faces no liquidity run, and is not subject to bank capital rules. It can hold every security to maturity, allowing unrealized losses to amortise naturally over the holding period.
The parallel is analytically useful for understanding the mechanism. The institutional distinction explains why the Fed survives it. But surviving it still costs a great deal.
Current runoff has reduced the portfolio from peak levels to $1.93 trillion as of August 2026. Since late 2025 and into 2026, the Fed has been channelling MBS principal paydowns into T-bills rather than longer-dated securities, a shift that compresses the duration profile of the asset side without shrinking the overall balance sheet. Official communications from the New York Fed confirm no intent to liquidate holdings.
What balance sheet normalisation would actually require
Reports suggest Kevin Warsh has set his sights on bringing the Fed’s balance sheet down to its pre-COVID footprint. That represents a substantial reduction from current levels, and the MBS portfolio is the single largest obstacle to achieving it on any reasonable timeline.
Returning the Fed’s balance sheet to pre-COVID size would require eliminating not just the remaining $1.93 trillion in MBS but also unwinding Treasury holdings accumulated during the same period, a multi-year project with direct implications for yields, reserves, and market functioning.
As the securities portfolio shrinks through runoff, reserve balances decline. Reserve balances, the deposits banks hold at the Fed, have recently been near $3 trillion in what the Fed calls the “ample reserves” regime. As those balances fall, banks and money market funds are pushed toward short-term Treasury bills to replace the safe, liquid assets they are losing, which lifts T-bill demand and presses short-term yields lower.
Informal yield curve control, the Treasury’s parallel attempt to cap long-end yields through doubled buyback caps targeting 10-, 20-, and 30-year Treasuries, interacts directly with the Fed’s passive runoff strategy: when buyback operations signal duration management at the Treasury level, they partially offset the supply dynamics that passive MBS runoff creates, but the $4 billion per operation ceiling limits the mechanical effect to probabilistic resistance rather than structural control.
Bill Nelson of the Bank Policy Institute is widely regarded among practitioners as one of the sharpest analysts of Fed plumbing and operational mechanics, and his work has helped frame why this channel matters. But the T-bill substitution effect is not mechanical. Three variables determine how it plays out:
- The pace of reserve decline as the securities portfolio shrinks
- Ample-reserves regime dynamics, particularly shifts in overnight reverse repo (ON RRP) usage that can absorb some of the adjustment
- The Treasury’s own issuance response, which can offset extra bill demand by supplying additional short-term securities
If you hold short-duration fixed income or monitor the short end of the yield curve, this matters directly. The pace of Fed balance sheet reduction is not merely an institutional accounting story. It has a direct transmission channel into the instruments you own or track. The T-bill substitution effect means that normalisation, even when conducted passively, reshapes demand dynamics across the short end of the curve.
What the Fed’s MBS position will cost, and for how long
The most data-consistent summary of the situation is this: the Fed transformed what it believed to be a short-duration, easily reversible balance sheet expansion into a long-duration commitment measured in a decade or more, concentrated in low-coupon MBS whose behaviour is now tightly coupled to future rate paths.
The costs break down into three distinct categories:
- Income statement drag: Negative carry and the growing deferred asset reduce reported earnings and will persist for the full duration of the portfolio
- Fiscal cost: Suspended Treasury remittances represent a real and ongoing reduction in government revenue, measurable in billions annually
- Policy flexibility cost: The Fed’s balance sheet options for responding to the next downturn are materially narrower than they would otherwise be, particularly for any future large-scale asset purchase programme
Under benign assumptions, the portfolio will remain in meaningful size well into the 2030s. Weighted average life estimates for significant portions of the book fall in the 8-12 year range. Specific low-coupon vintages could persist well beyond 15 years if prepayments remain depressed.
How the current episode will shape future balance sheet decisions
The policy flexibility cost may prove the most consequential over time. The Fed’s balance sheet entering the next downturn will not be at pre-2008 size, limiting the perceived runway for additional QE without political and institutional resistance.
The distinction is between operational capacity, which remains unimpaired, and political and reputational constraints, which are materially elevated by the current episode. Future decisions to deploy large-scale asset purchases will occur in the context of a public and political record of what the current programme cost. That record raises the threshold for similar interventions, even if the economic case for them is strong.
FOMC internal divisions over how to balance 3.5% PCE inflation against rising unemployment illustrate exactly the policy flexibility problem the MBS constraint creates: a committee already fractured by competing mandate priorities has fewer balance sheet tools available to break a tie between hawks and doves, making the MBS portfolio’s drag on future QE capacity operationally relevant right now.
This is a drag on flexibility measured in years and decades, not a crisis measured in quarters. The Fed is not insolvent. Monetary policy is not broken. But the institution’s ability to respond to the next shock with the same balance sheet tools it deployed in 2020 is genuinely constrained, and that constraint will not resolve itself quickly.
This article is for informational purposes only and should not be considered financial advice. Investors should conduct their own research and consult with financial professionals before making investment decisions.
Past performance does not guarantee future results. Financial projections are subject to market conditions and various risk factors.
A decade-long constraint the Fed will have to work around, not through
The Fed’s MBS portfolio is not a crisis. It is a structural constraint, one built through decisions that seemed defensible at each step and that will shape the boundaries of U.S. monetary policy for the better part of a decade. The empirical literature supported the term-premium compression argument, and the intervention did reduce long-term yields at a moment of genuine uncertainty. The error was underweighting exit and extension risk, not deploying the tool without basis.
Three variables will determine how quickly the constraint eases: the pace of portfolio runoff, the evolution of prepayment speeds if mortgage rates eventually decline, and the trajectory of Treasury remittances as the deferred asset is gradually extinguished. You now have the framework to track all three, and to evaluate the Fed’s balance sheet debate on its actual mechanics rather than on headlines alone.