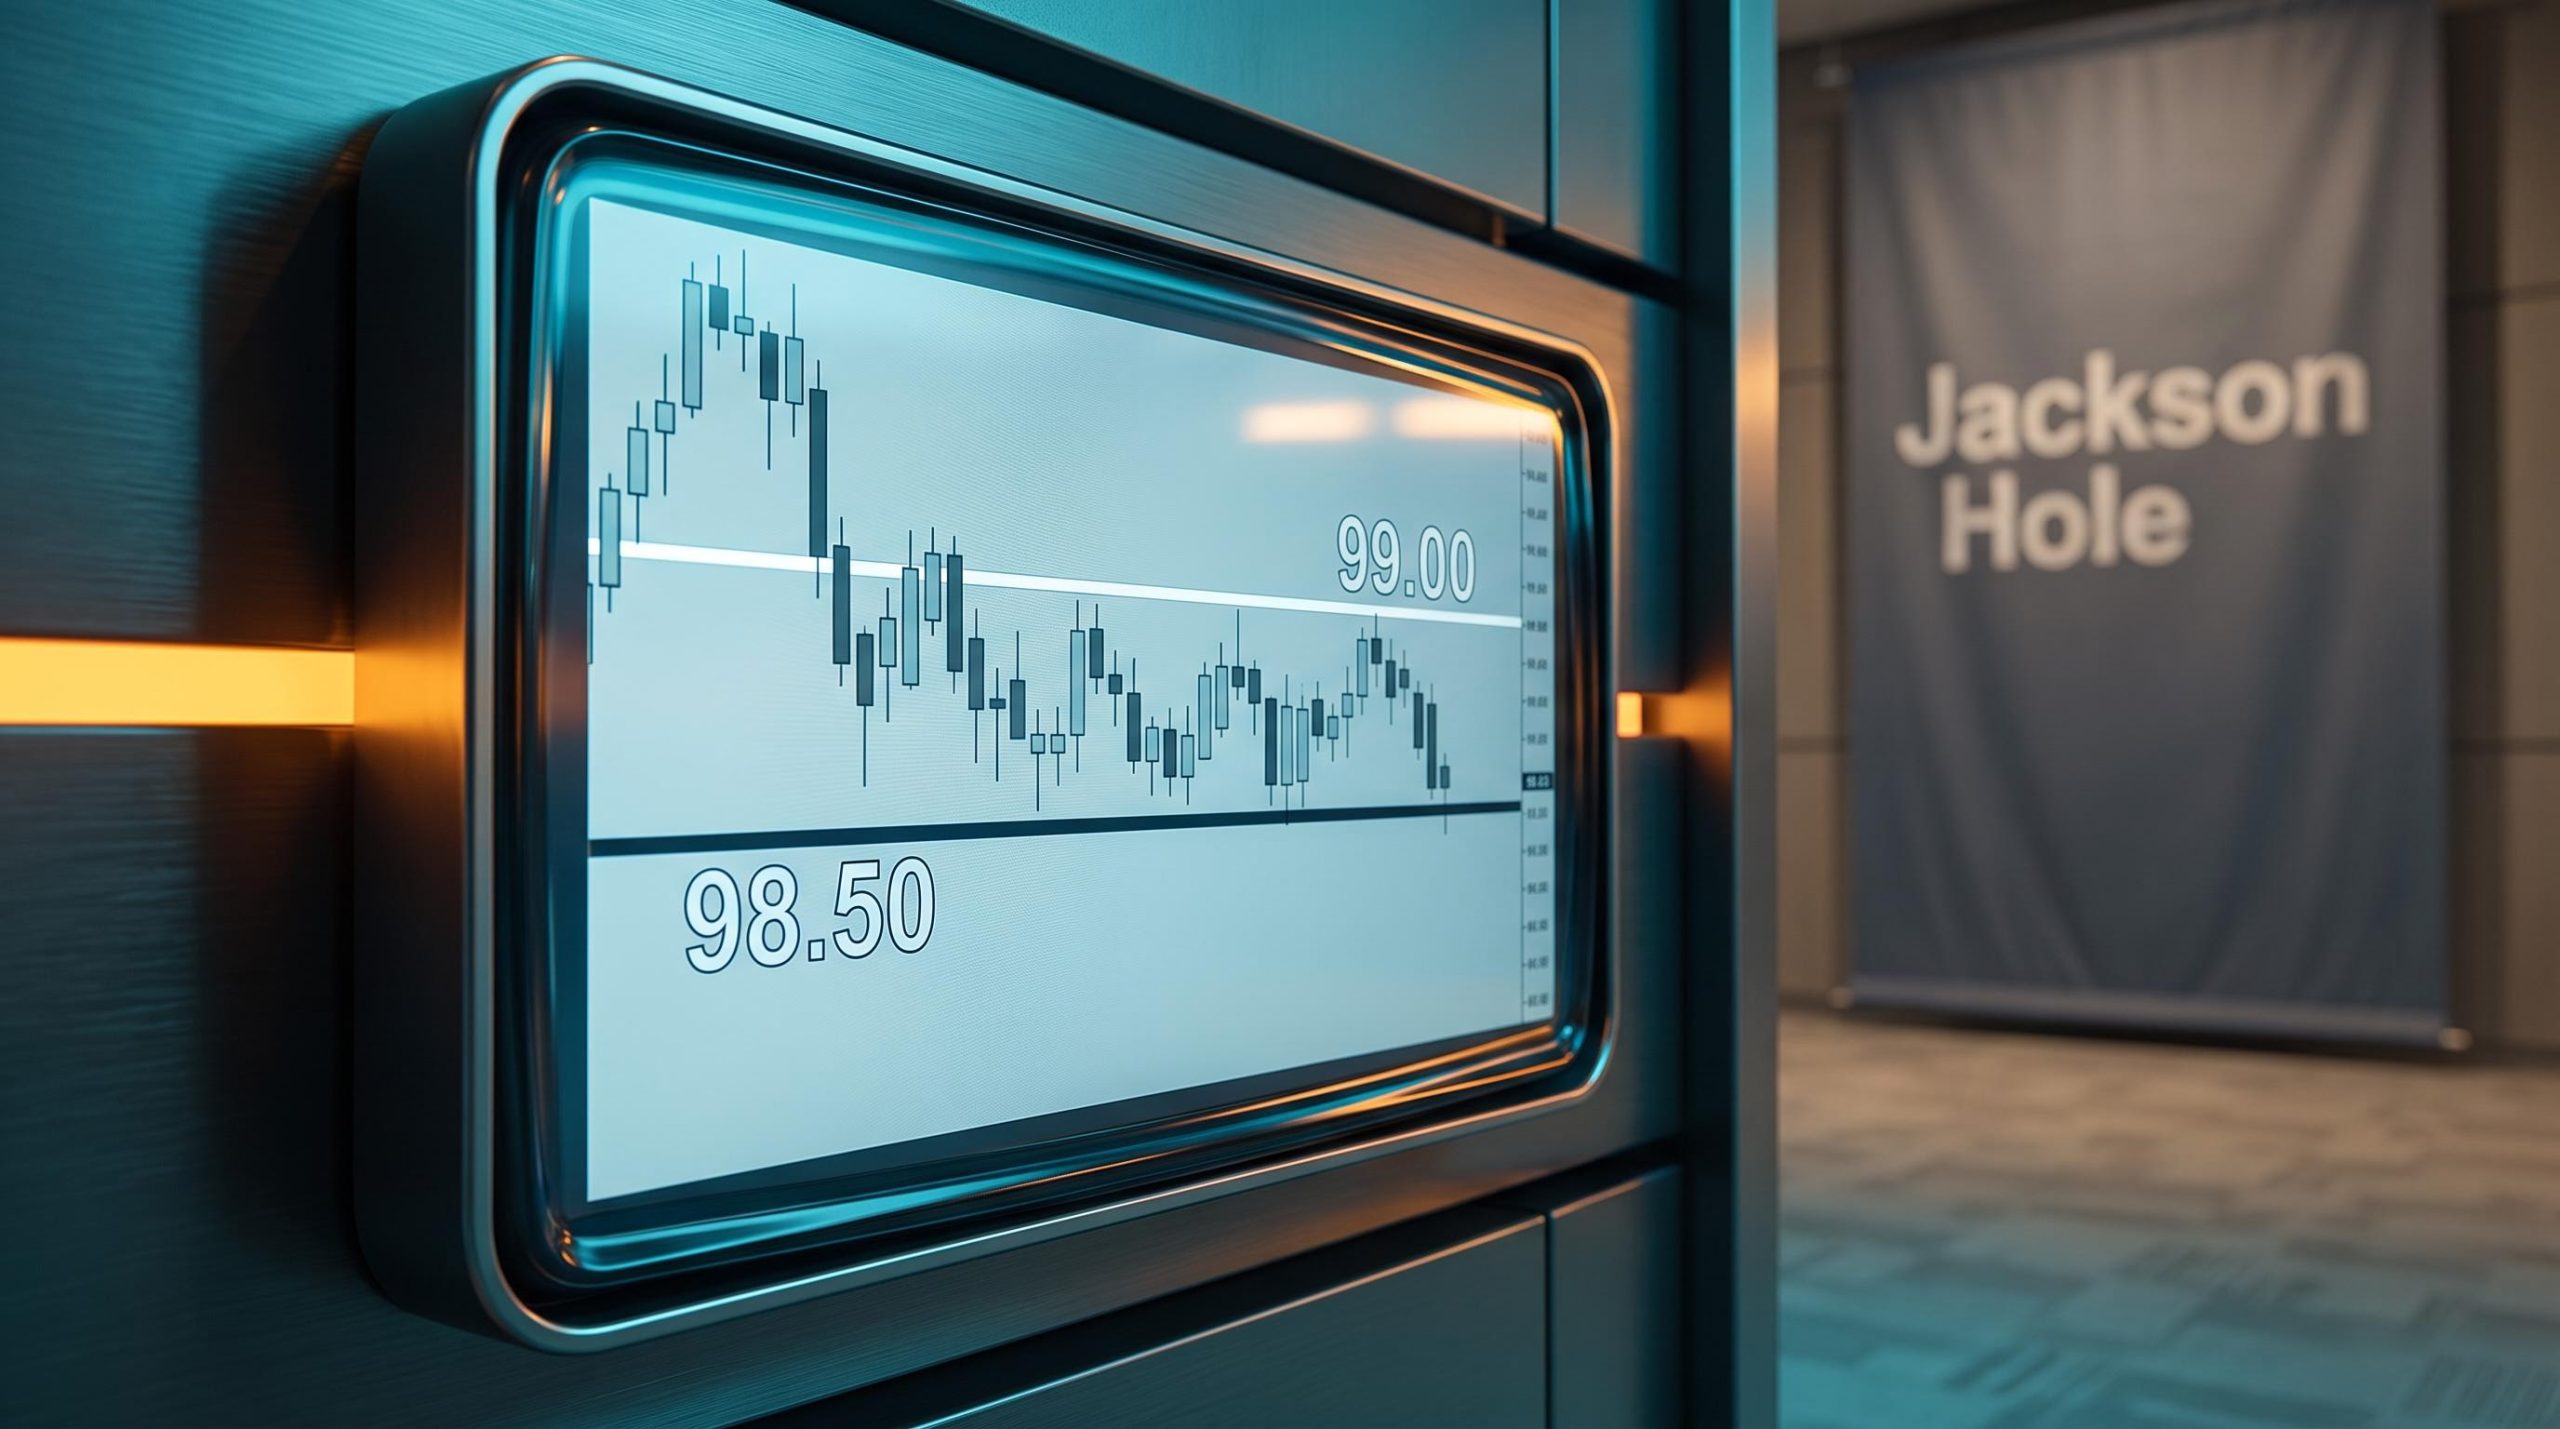
On Thursday, 21 August, a regional manufacturing survey posted its highest six-month outlook reading since 1983, jobless claims undershot consensus, and the Dollar Index gained roughly 0.12%. Markets are not broken. Something more instructive is happening.
The muted reaction is not a blip. It reflects a durable set of conditions: a technically bearish Dollar trend, well-anchored rate-cut expectations, and a market that has learned to rank policy signals far above regional survey beats. Traders positioned for this week’s Jackson Hole keynote are not going to reprice the Dollar on one Thursday morning’s inputs, however historically eye-catching those inputs are.
Here is what the data actually tells you about trading the Dollar in this environment. This piece breaks down why the Philly Fed’s 1983-era print moved nothing, what the technical and policy conditions mean for the 98.50 support level, and what to watch from Friday’s PMIs through to the Jackson Hole keynote on 27 August.
What the data actually said on Thursday
The Philadelphia Fed’s current activity index came in at 47.4 for August, almost double the consensus expectation of approximately 25 and well above the prior reading of 41.4. This is not a marginal upside surprise. It is the kind of beat that, in isolation, would normally force a reassessment.
The strength ran deeper than the headline. The employment sub-index surged 18 points to its highest level since April 2022, a striking print given that national payroll data had shown an outright contraction during the same period. The six-month forward-looking index climbed 39 points to a reading last observed four decades ago.
The Philadelphia Fed Manufacturing Business Outlook Survey has tracked regional manufacturing conditions since May 1968, giving the current activity and forward-outlook indices a historical baseline long enough to contextualise readings that appear exceptional in shorter-cycle comparisons.
Philly Fed’s six-month forward outlook climbed to its highest reading since 1983.
Initial jobless claims confirmed the sweep. The 206,000 print beat the 210,000 consensus and improved from the prior week’s 212,000, arriving at 12:30 GMT alongside the Philly Fed numbers.
| Indicator | Actual | Consensus | Prior |
|---|---|---|---|
| Philly Fed Current Activity | 47.4 | ~25 | 41.4 |
| Employment Sub-Index | Highest since April 2022 | — | — |
| Six-Month Outlook | Highest since 1983 | — | — |
| Initial Jobless Claims | 206,000 | ~210,000 | 212,000 |
A beat of this magnitude relative to consensus is not a data footnote. It is the kind of print that demands an explanation for why the Dollar barely moved, rather than an assumption that the non-reaction was obvious.
When big ASX news breaks, our subscribers know first
The Dollar’s response in numbers and what the chart was already saying
The 98.50 support level had been established and defended during early London trading, well before the 12:30 GMT release window opened. By the time the Philly Fed figures crossed terminals, a bounce off that floor was already in progress. The data gave traders reason to stay long; it did not give them the original idea.
The DXY technical structure that defined Wednesday’s session, a stair-step breakdown in which every prior support level rotated into resistance, explains why Thursday’s data was absorbed into an already-established bearish framework rather than reshaping it.
The session high reached just below 99.00. The net DXY gain for the day: approximately 0.12%. That tells you the chart, not the calendar, was the primary driver of Dollar positioning on Thursday.
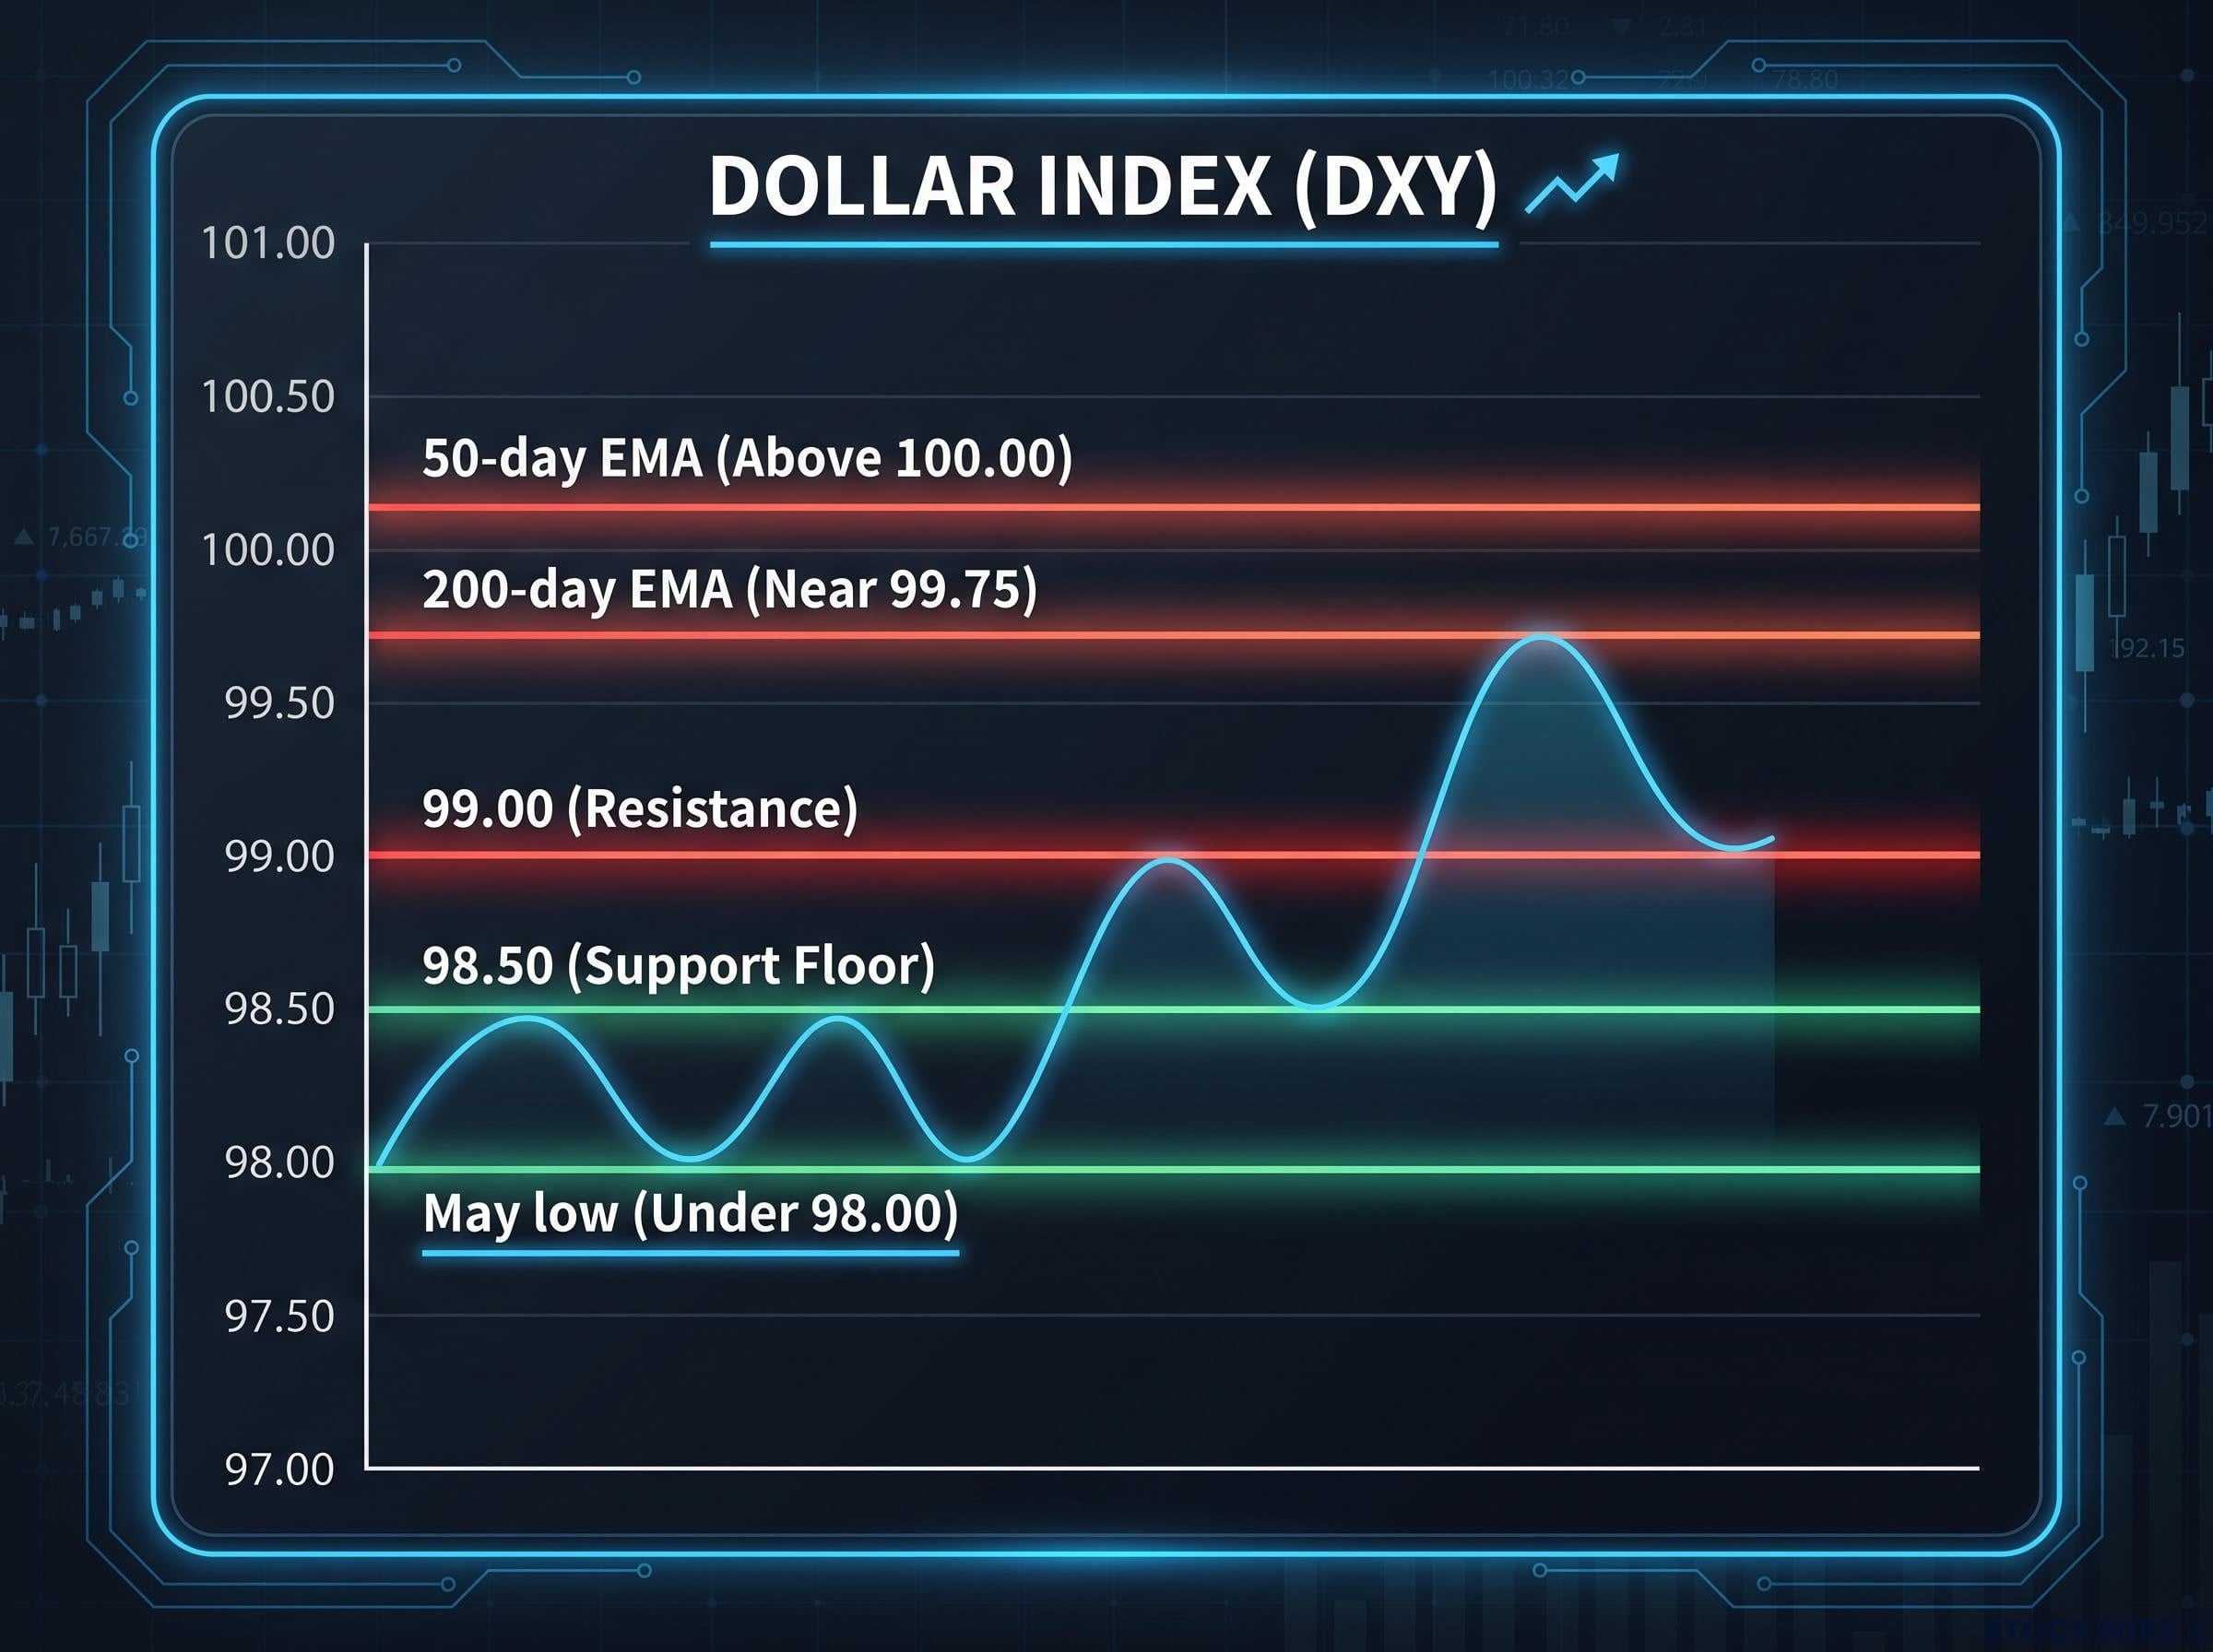
Five technical reference points define the range DXY is working within right now:
- 98.50: The floor established this session, functioning as near-term support
- 99.00: A psychological level that has repeatedly turned back upside attempts
- 200-day EMA: Situated near 99.75, representing the first substantial overhead resistance above 99.00
- 50-day EMA: Trading just above 100.00, rolling lower in the direction of the 200-day
- May low: Positioned just under 98.00, the next meaningful downside reference below 98.50
Why 99.00 kept the ceiling on
Sellers positioned at the 50-day and 200-day EMA zones had a structural reason to supply Dollars into any strength, regardless of what the Philly Fed said. The 200-day EMA near 99.75 and the declining 50-day EMA above 100.00 create a layered resistance structure that absorbed the data-driven demand before it could generate any momentum.
The bearish crossover setup, the 50-day declining toward the 200-day, reinforces the path of least resistance as lower. Bulls face a deteriorating moving-average backdrop even when individual prints are strong. The daily Stochastic RSI (a momentum oscillator that measures whether recent price action has been unusually strong or weak) sat near 18, deep in oversold territory, but without a confirmed reversal signal. Oversold does not mean finished falling.
Why one exceptional print cannot change a regime
There is a distinction between data that is surprising and data that changes a regime. Thursday’s Philly Fed report belongs firmly to the first category.
The current activity index came in at roughly double the forecast. That is a genuine shock to expectations. But for currency markets, the question that matters is not “how big was the beat?” It is “does this change what the Fed is likely to do?” A single regional manufacturing survey, however historically strong its forward outlook, does not alter the path of front-end rates (the short-term interest rate expectations that directly price the Dollar). And if it does not alter the path of front-end rates, the Dollar’s medium-term trend remains intact.
Front-end rate expectations are what currencies actually price, not current official rates, which is why a regional survey beat that leaves the Fed’s expected path unchanged produces almost no lasting FX reaction regardless of how large the deviation from consensus appears.
Professional currency traders apply a hierarchy of data importance. Three conditions need to be met for a data print to shift the Dollar’s medium-term trend:
- It must be national in scope rather than regional
- It must be replicated across consecutive releases, forming a pattern rather than a one-off
- It must be of a type, such as payrolls, CPI, or core PCE (the Fed’s preferred inflation gauge, measuring price changes excluding food and energy), that directly influences terminal rate expectations
The Philly Fed meets none of these conditions. Consider that its employment sub-index reached its strongest reading since April 2022 at a point when broader national payroll figures were showing an outright contraction. A regional survey flashing strength while the national labour picture deteriorated illustrates precisely why currency markets assign lower weight to regional data relative to national releases. The practical lesson: when you see a big headline number, the first question to ask is not how large the beat was, but whether it changes what the Fed is likely to do. If the answer is no, the currency market will treat it accordingly.
Friday’s PMIs set the stakes for Jackson Hole
Friday’s S&P Global flash PMI readings for August arrive at 13:45 GMT on 22 August, and the consensus creates an immediate tension. Markets expect slight softening in both manufacturing and services, the day after a regional manufacturing survey posted its strongest current-activity reading in five years.
| PMI Index | Consensus | Prior |
|---|---|---|
| Manufacturing PMI (August flash) | 53.8 | 53.9 |
| Services PMI (August flash) | 54.0 | 54.6 |
| Composite PMI | — | 54.5 |
The PMI result is not a standalone trade. It is the data point that determines whether you head into a Fed chair keynote with 98.50 intact or with a break already in progress toward 98.00. The two scenario branches:
- Broad PMI beat, particularly in services: reinforces 98.50 as credible support heading into Jackson Hole, giving bulls a defended floor to work from
- PMI miss, especially in services: gives bears fresh justification to press for a break below 98.50, targeting the May low near 98.00
No scheduled events between Friday’s PMIs and the Jackson Hole symposium (27-29 August) are expected to force a repricing of front-end rate expectations. DXY can drift in range during the gap. The PMIs set the starting conditions; Jackson Hole delivers the verdict.
What Jackson Hole can do that the Philly Fed could not
This will be the Fed chair’s first symposium keynote address, elevating the communication risk above a standard scheduled appearance.
Jackson Hole belongs to the “regime-changing” category that Thursday’s data never could reach. The keynote on 27 August carries structural weight because it meets the conditions regional surveys cannot: it is national in scope, it directly shapes terminal rate expectations, and it comes from the single voice that matters most for front-end pricing.
FOMC internal divisions heading into Jackson Hole amplify the communication risk: with hawkish and dovish camps publicly divergent, the keynote tone carries more potential to surprise than in cycles where the committee was aligned, making the Stochastic RSI’s oversold reading a more volatile setup than it would otherwise appear.
Two directional paths emerge:
- Dovish or gradual-easing confirmation: validates current market pricing and keeps the bearish Dollar trend intact. DXY remains below 99.00, and 98.50 stays under pressure as support rather than serving as a launchpad. A break toward the May low near 98.00 remains the path of least resistance.
- Hawkish pushback on cut timing or inflation persistence: this would be the single most plausible near-term catalyst for a sustained test of 99.00. Combined with strong Friday PMIs, a hawkish or mildly hawkish tone gives DXY its best shot at challenging the resistance that has capped every rally this month. With the Stochastic RSI near 18, oversold conditions could amplify a hawkish surprise.
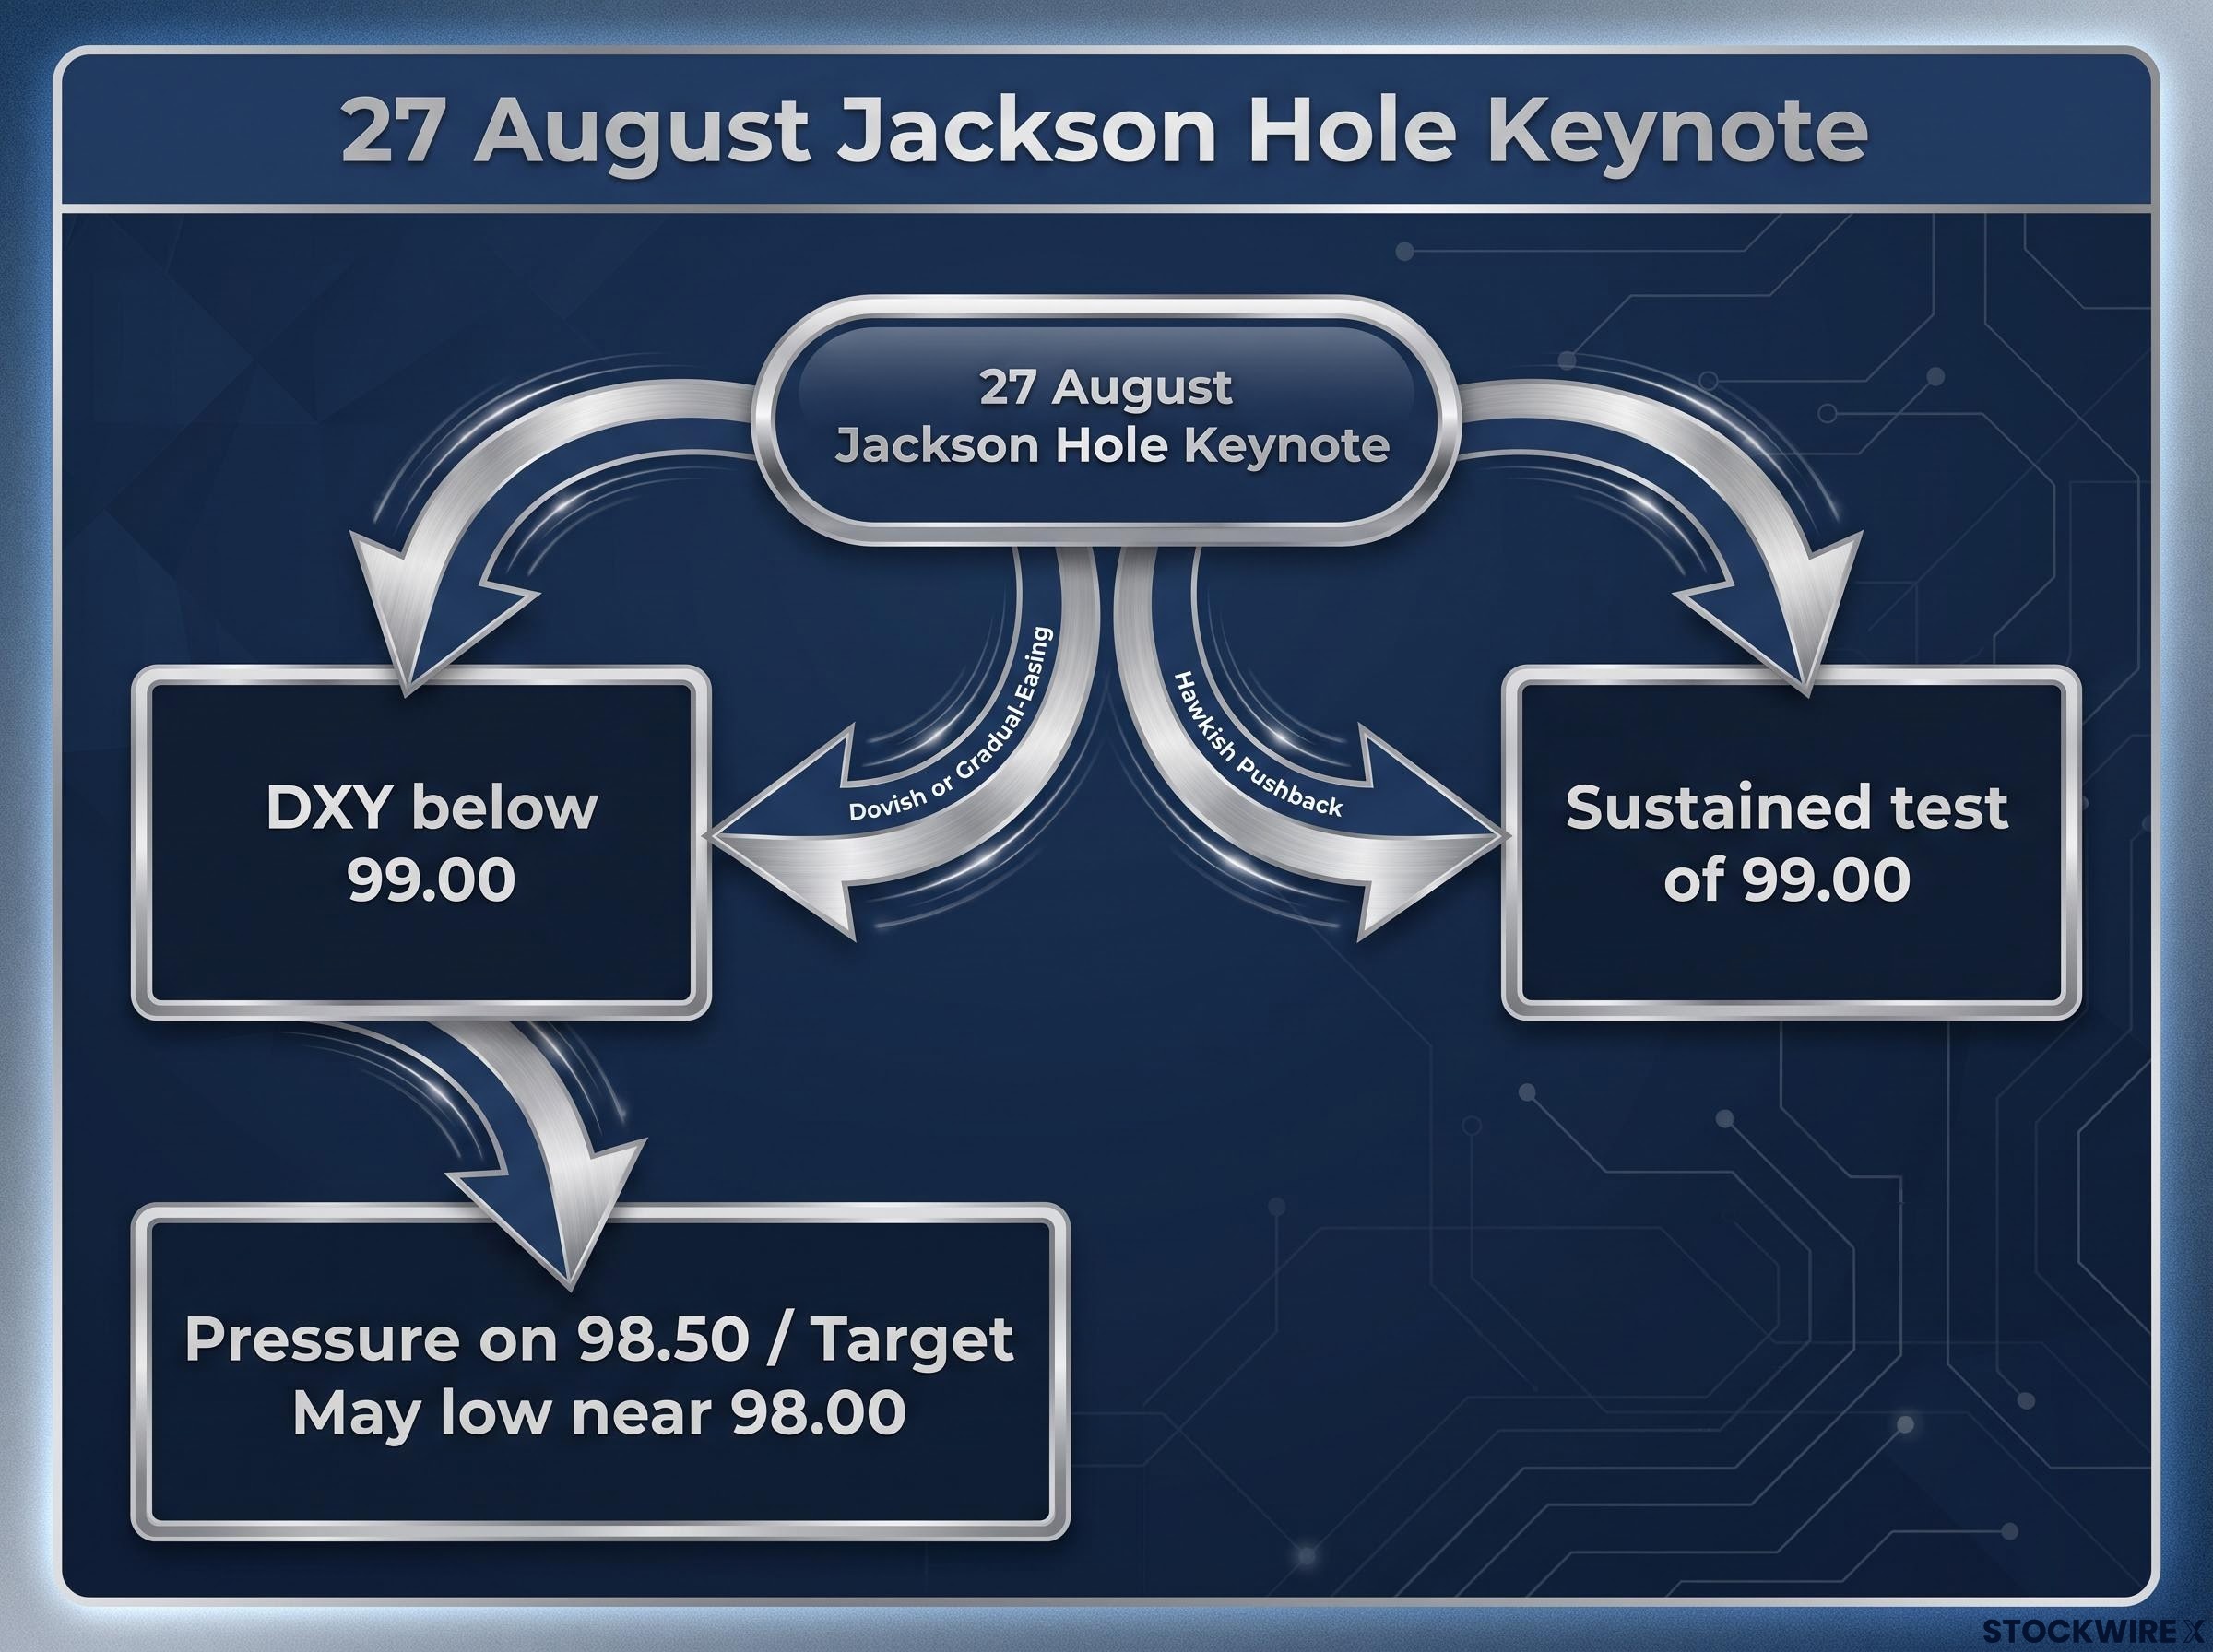
For you, the Jackson Hole keynote is the event that decides whether Thursday’s bounce off 98.50 becomes the foundation of a recovery attempt or a temporary pause before the bearish trend resumes. The Philly Fed could not write that story because it lacked the structural authority. The Fed chair can.
What this week’s setup actually tells you about trading the Dollar now
Thursday demonstrated a core principle: in a technically driven, policy-sensitive market, the trend and the resistance structure are the dominant forces. Data that does not change the policy path is subordinate to both. The net DXY gain of approximately 0.12% on a historically strong data day is not a market failure. It is a signal that the Dollar’s directional story will be written at Jackson Hole, not in Thursday’s data columns.
The distinction between “data as trigger” and “data as confirmation” matters here. Thursday’s bounce off 98.50 was technically driven. The strong data made the bounce more comfortable to hold but did not make it more powerful.
The asymmetric risk skew surrounding DXY ahead of Jackson Hole tilts toward further weakness: a dovish or ambiguous keynote confirms the existing trend, while a hawkish surprise must overcome weeks of positioning and a deteriorating moving-average structure before it translates into sustained Dollar strength.
Four durable principles from this episode:
- Respect the trend and levels over standalone data
- Differentiate headline beats from policy events: regional surveys and weekly claims sit below payrolls, CPI, and core PCE in the hierarchy of what actually reprices the Dollar
- Use data as confirmation, not as a trigger, in technically driven markets
- Watch how markets react to repeated upside surprises at resistance. If strong data fails to break 99.00 and the moving-average structure remains bearish, that failure is itself information.
The 98.50 level is the tactical pivot for the next seven to ten days. Its behaviour through the PMI release and into Jackson Hole will reveal whether the bearish trend is resuming or consolidating before a potential recovery attempt. Position your attention accordingly.
Where the Dollar goes from here depends on one conversation
Thursday’s data was historically strong. The Dollar barely moved. The reason is straightforward: the market is pricing a policy story that the Philly Fed cannot rewrite on its own. PMIs on Friday set the defensive picture for 98.50, and the Jackson Hole keynote on 27 August determines whether that support holds or the bearish trend resumes its course.
The question is not what the data will say but whether it will be of a type and magnitude capable of changing what the Fed is expected to do. That test arrives on 27 August.
This article is for informational purposes only and should not be considered financial advice. Investors should conduct their own research and consult with financial professionals before making investment decisions. Forward-looking statements about Federal Reserve policy and Dollar Index levels are speculative and subject to change based on market developments.