UK inflation just climbed to a four-month high of 2.9% year-on-year in July 2026, and for GBP/USD traders, the read-through is not subtle: one more Bank of England rate hike is now firmly in play, and sterling is already moving to reflect it.
Thursday’s session saw GBP/USD reach its strongest point since February, with the pair changing hands near 1.3639 in North American hours and posting a daily advance of around 0.25%. But the macro backdrop and the technical picture are telling a more nuanced story than a clean one-way trade. The RSI on the daily chart is edging into overbought territory at 70.49, even as the structural support below remains compelling.
This piece lays out exactly what the inflation print means for Bank of England (BoE) expectations, how those expectations are expressing themselves in GBP/USD price action, and where the key levels sit for traders navigating the near-term setup.
What the July inflation print is actually telling the market
The headline number landed right where economists expected it. That matters more than it might seem at first glance.
- UK CPI: 2.9% year-on-year in July 2026, up from 2.6% in June
- Primary driver: higher household energy bills
- The print was in line with consensus forecasts
The ONS CPI bulletin for July 2026 confirmed the 2.9% year-on-year reading officially, providing the statistical foundation that rate markets and BoE watchers used to recalibrate their December meeting expectations.
An inflation reading that matches expectations while still showing re-acceleration is a specific kind of signal. It is not a shock that forces repositioning. It is a confirmation that closes the door on near-term dovish pivots from the BoE. The carry argument for sterling, where holding the currency pays you a yield advantage because rates remain elevated, stays intact.
The headline number conceals a more complex picture: core inflation pressures are actually easing, with core CPI forecast at 2.5% and services CPI at 3.4% for July, meaning the measures the MPC weighs most heavily when setting rates are both moving in the right direction even as the energy-driven headline spikes.
The market’s shorthand verdict: the print is “keeping hike bets alive.”
The distinction between surprise and confirmation matters here. A surprise upside would have triggered a sharp repricing. An in-line print that still trends higher tells the market something quieter but more durable: the macro environment is not normalising on schedule, and the BoE’s reaction function remains live. For anyone trading sterling, that is the foundation the current move is built on.
When big ASX news breaks, our subscribers know first
How markets have repriced the Bank of England through December
The inflation data does not move GBP/USD directly. It moves rate expectations, and rate expectations move the currency. Understanding that mechanism is the difference between tracking price and understanding why it is where it is.
Interest rate differential mechanics explain why so much of the GBP/USD move happens in advance of the actual BoE meeting: markets price the expected future rate path continuously, which means a CPI print that confirms existing expectations can move sterling just as significantly as a formal decision, because it narrows the uncertainty band around what the committee will do.
The way this works is straightforward. When traders expect a central bank to raise interest rates, they buy the currency because higher rates mean a better return on deposits and bonds denominated in that currency. The more confident the market becomes that a hike is coming, the more the currency strengthens in advance. By the time the actual decision arrives, much of the move has already happened.
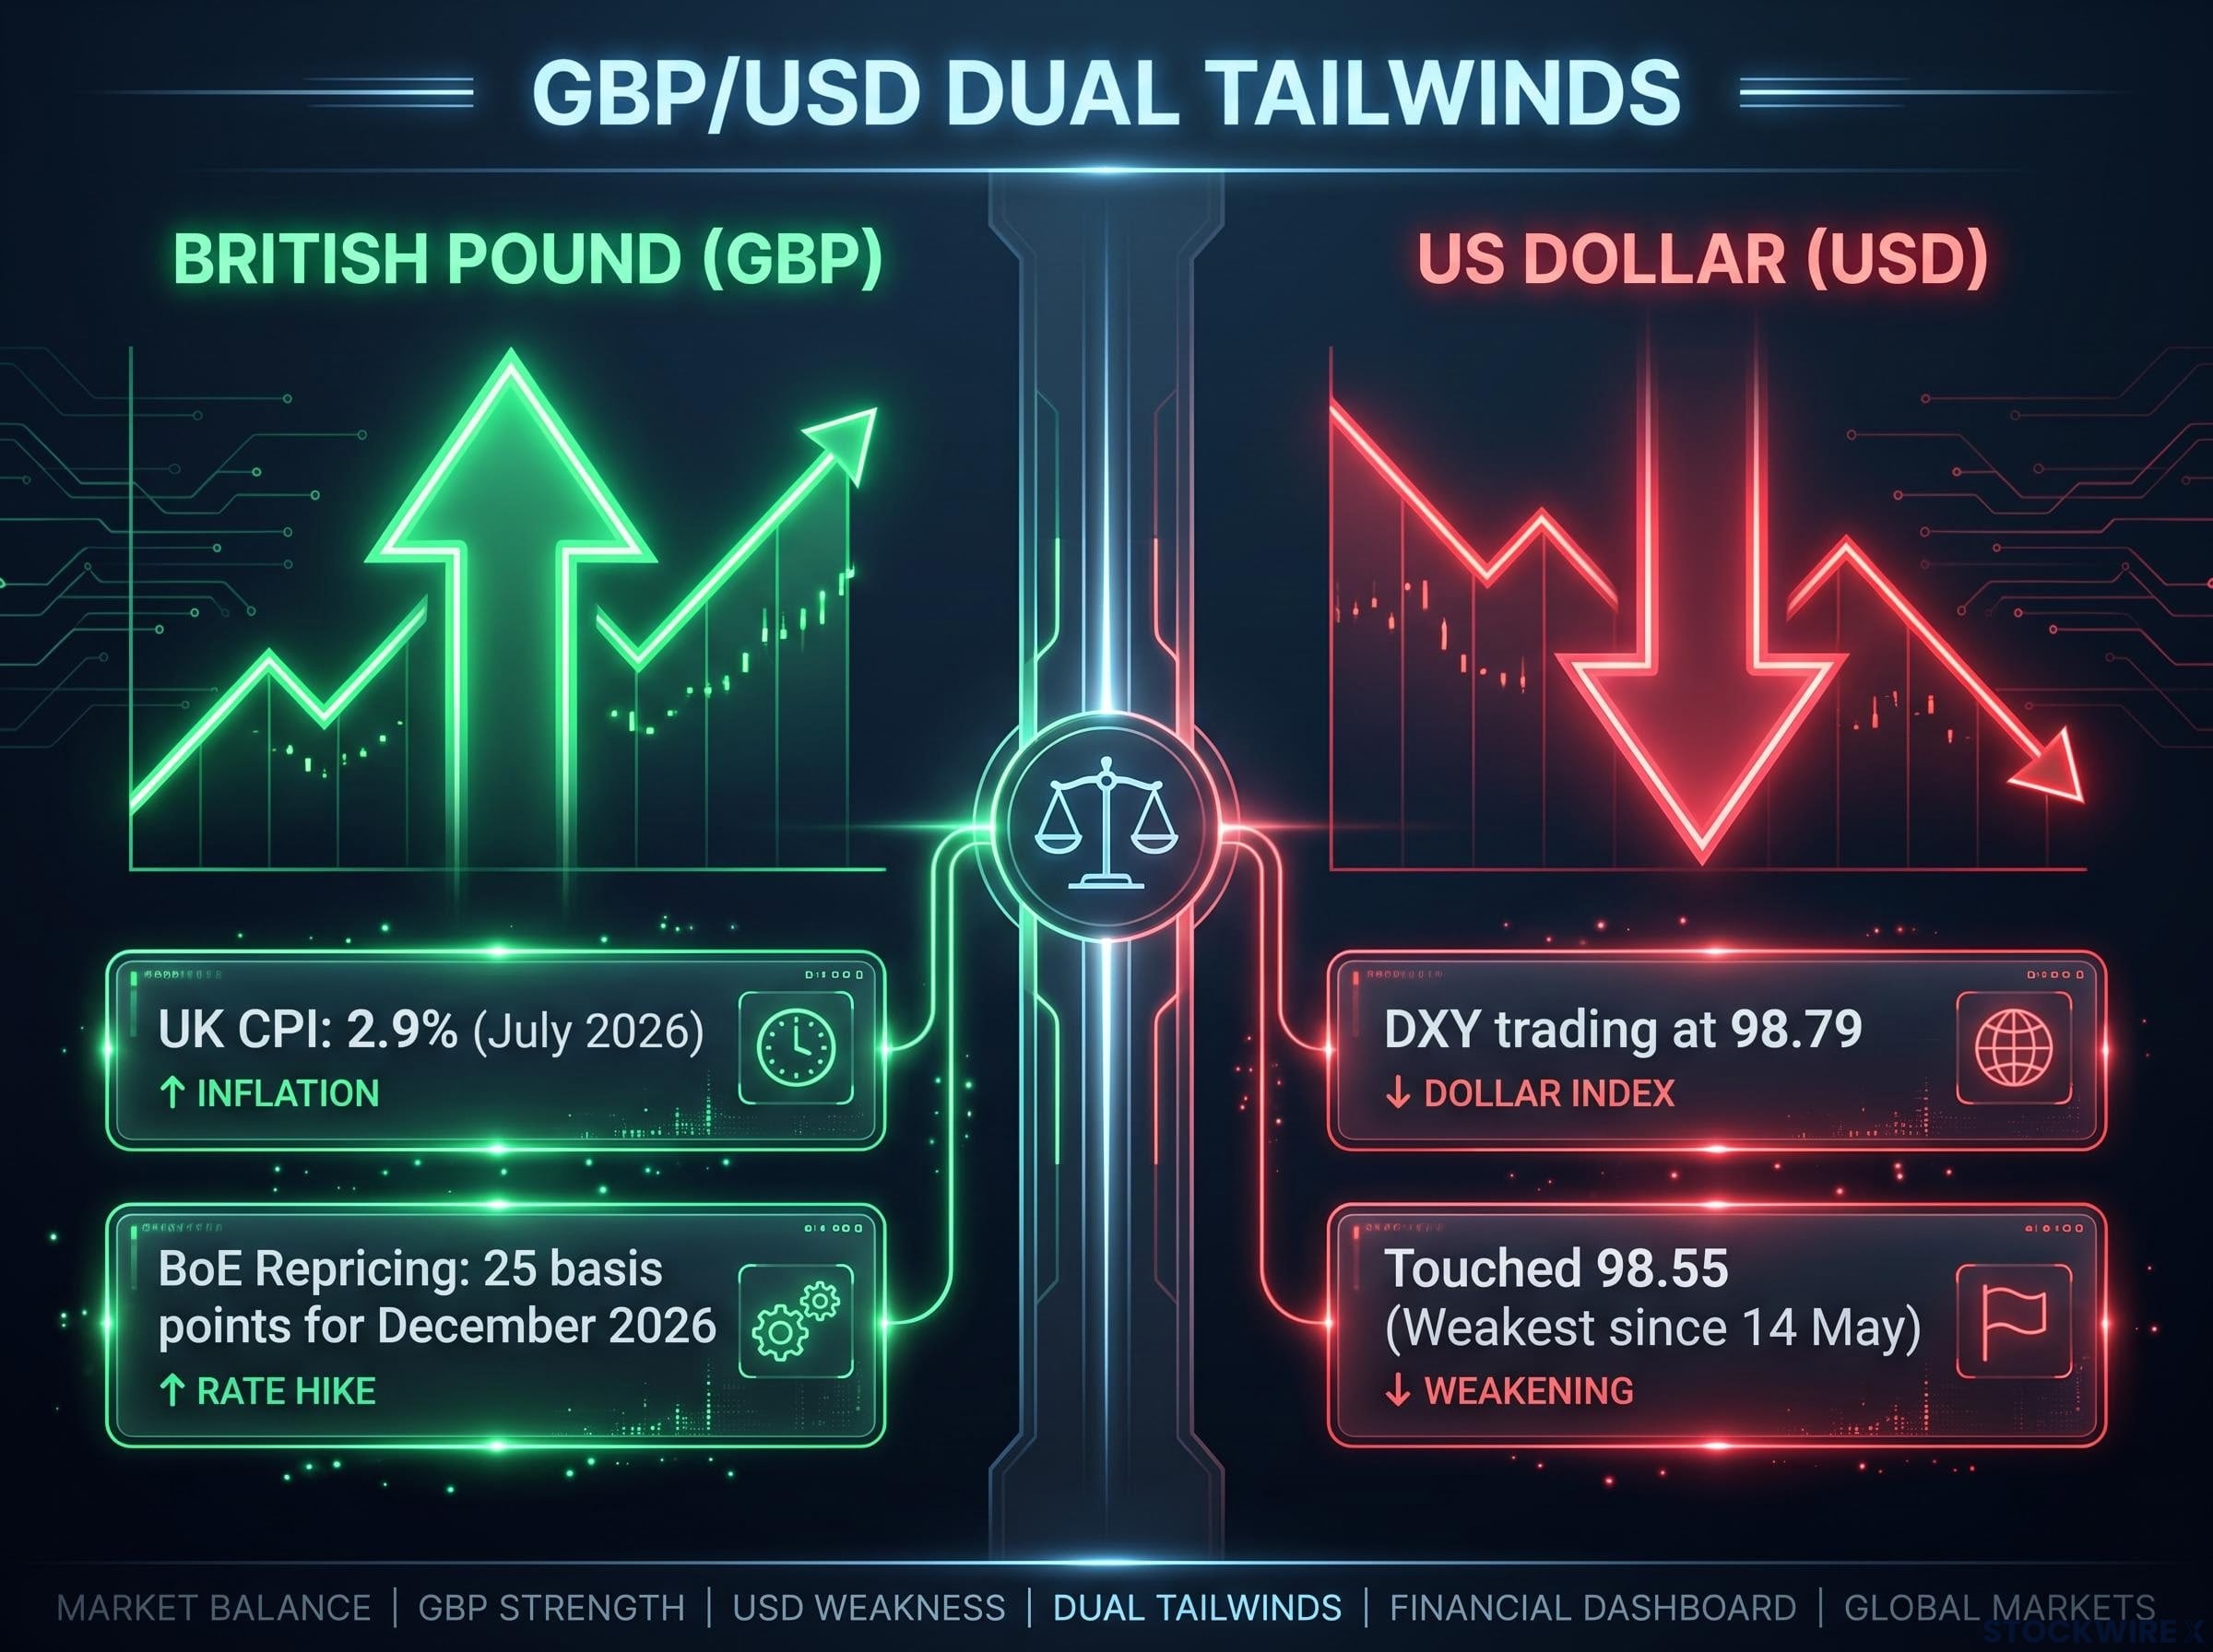
Prime Terminal data shows the market has priced in roughly 25 basis points of further BoE tightening, with that increment expected to be delivered at the December 2026 meeting. That is one standard-increment hike, not a major escalation, but it confirms that the central bank is still in tightening mode rather than approaching a pivot toward cuts.
UK Retail Sales figures for July were also on the radar, with the market anticipating a deceleration in household spending that adds a secondary variable to the macro picture. Weaker consumption could eventually argue against further tightening, but the inflation data is carrying more weight in the current repricing.
What the December pricing actually means for positioning
Here is where the asymmetry sits. With one hike already priced in, the upside for sterling from a BoE confirmation is capped. The market has already moved to reflect the expectation. What is not priced in is a surprise: a hold, or any signal that the BoE is reconsidering. That would carry disproportionate downside for GBP/USD.
What this tells you is that the risk-reward for new long positions at current levels is not as clean as the trend suggests. The macro case supports a constructive view, but most of the good news is already in the price.
Reading the GBP/USD technical structure on a day like this
Thursday’s price action reinforced the bullish near-term bias. The pair peaked at an intraday high of 1.3659, a level not seen since February 2026, before settling around 1.3639 in North American trading, representing a gain of roughly 0.25% on the session. The daily low came in near 1.3594.
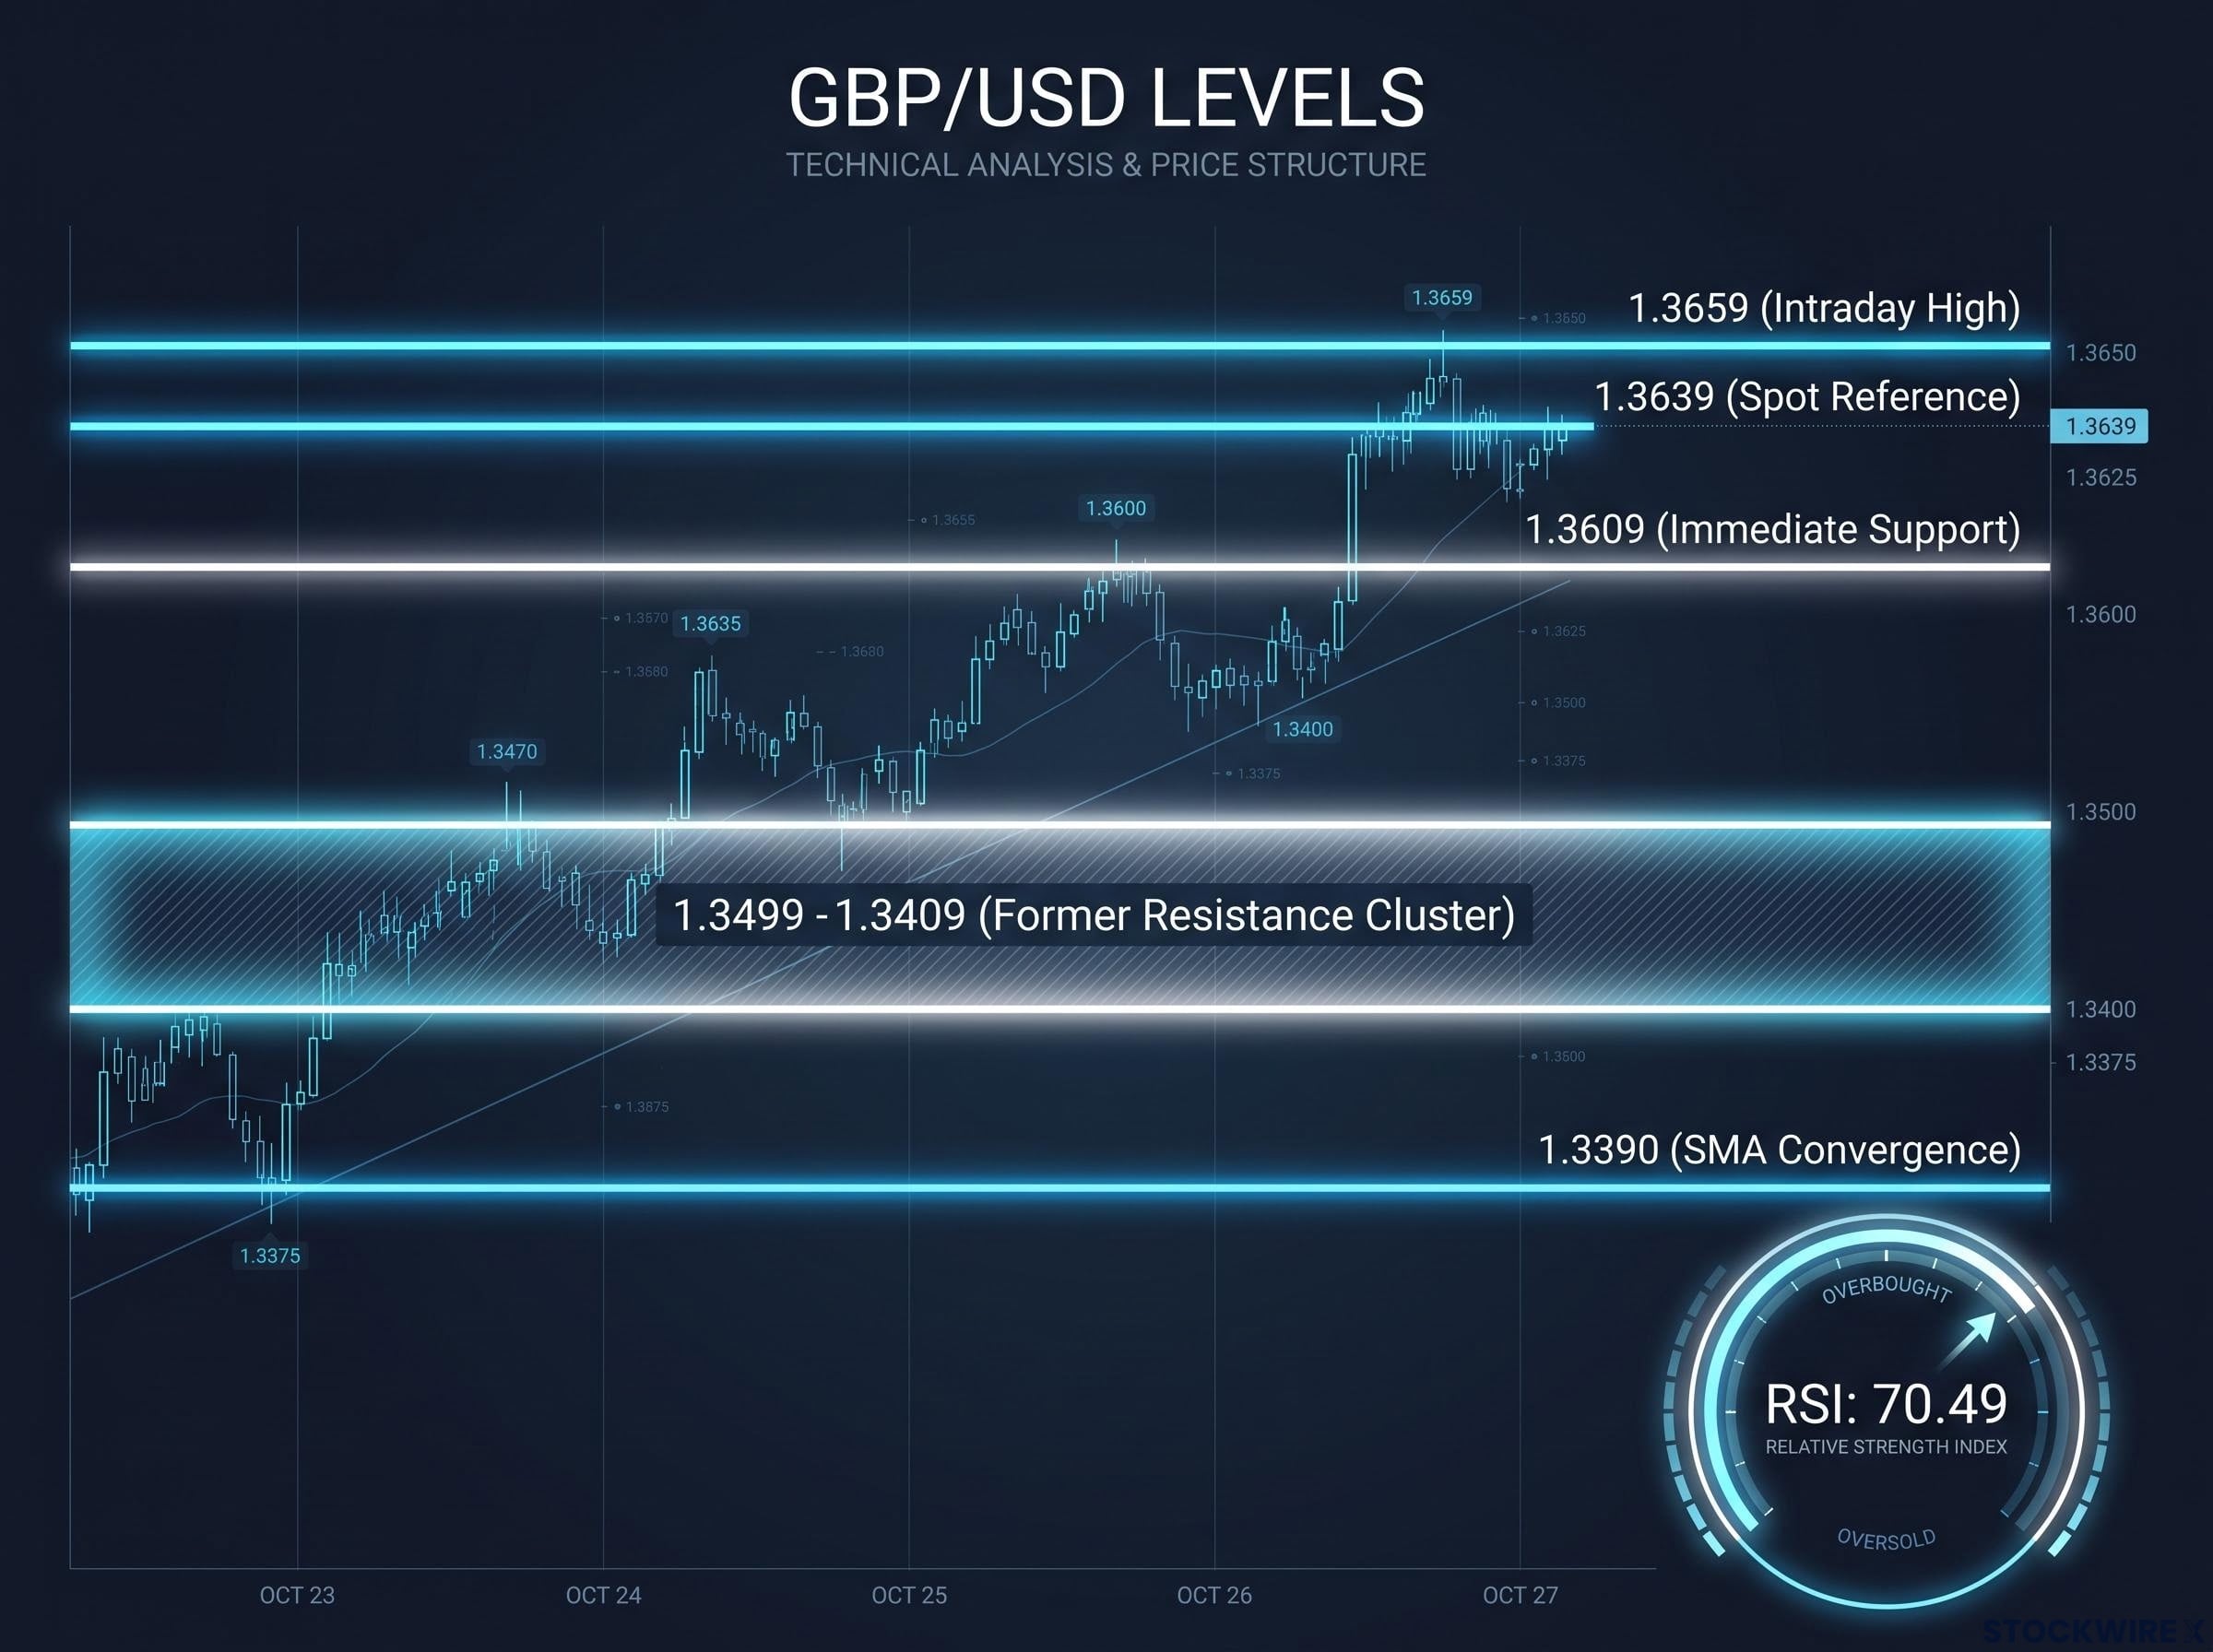
What makes the current setup compelling is the support architecture underneath. Below spot, a former descending trend-line resistance band has flipped into support, and the 50-, 100-, and 200-day simple moving averages have gathered into a tight cluster just beneath it.
| Level | Price | Description | Significance |
|---|---|---|---|
| Intraday high | 1.3659 | Session peak, highest since February | Near-term upside reference |
| Spot reference | 1.3639 | North American session price | Current trading level |
| Immediate support | 1.3609 | Upward trend-line break point | First downside level to watch |
| Former resistance cluster | 1.3499-1.3409 | Descending trend-line resistance, now support | Primary buy-the-dip zone |
| SMA convergence | 1.3390 | 50-, 100-, and 200-day SMA cluster | Macro-technical anchor level |
The support structure is where the technical picture earns its credibility. Three major moving averages converging at a single level is uncommon, and when that convergence aligns with a former resistance zone just above it, the result is a layered support band that would require a significant shift in macro sentiment to break.
RSI at 70.49: The 14-period Relative Strength Index (a momentum indicator that measures whether a currency pair is being bought or sold too aggressively) has crossed into overbought territory on the daily chart, signalling that buying pressure has built up quickly and the move may be running ahead of itself in the short term, leaving the pair susceptible to a pause or shallow correction before any continuation. In practical terms, this means the pace of buying is running ahead of what the trend can sustain in the short term, raising the probability of a consolidation or shallow pullback before any continuation higher.
An RSI above 70 does not invalidate the uptrend. But it tells you that chasing the pair at current levels carries elevated short-term risk of a pullback to the 1.3499-1.3409 buy-the-dip zone before any further move higher. Knowing where that zone sits transforms an abstract bullish view into something you can actually trade around.
Why the US Dollar’s position matters as much as the BoE story
Sterling strength is only half of the equation. The other half is dollar weakness, and right now, both forces are pushing in the same direction.
The DXY, a gauge of the dollar’s value against a broad basket of major currencies, was trading at 98.79 during the session, having earlier touched 98.55, a two-and-a-half-month trough that marked its weakest reading since 14 May. That soft USD environment is running parallel to the sterling-specific BoE bid, and the alignment is why the GBP/USD move looks as clean as it does.
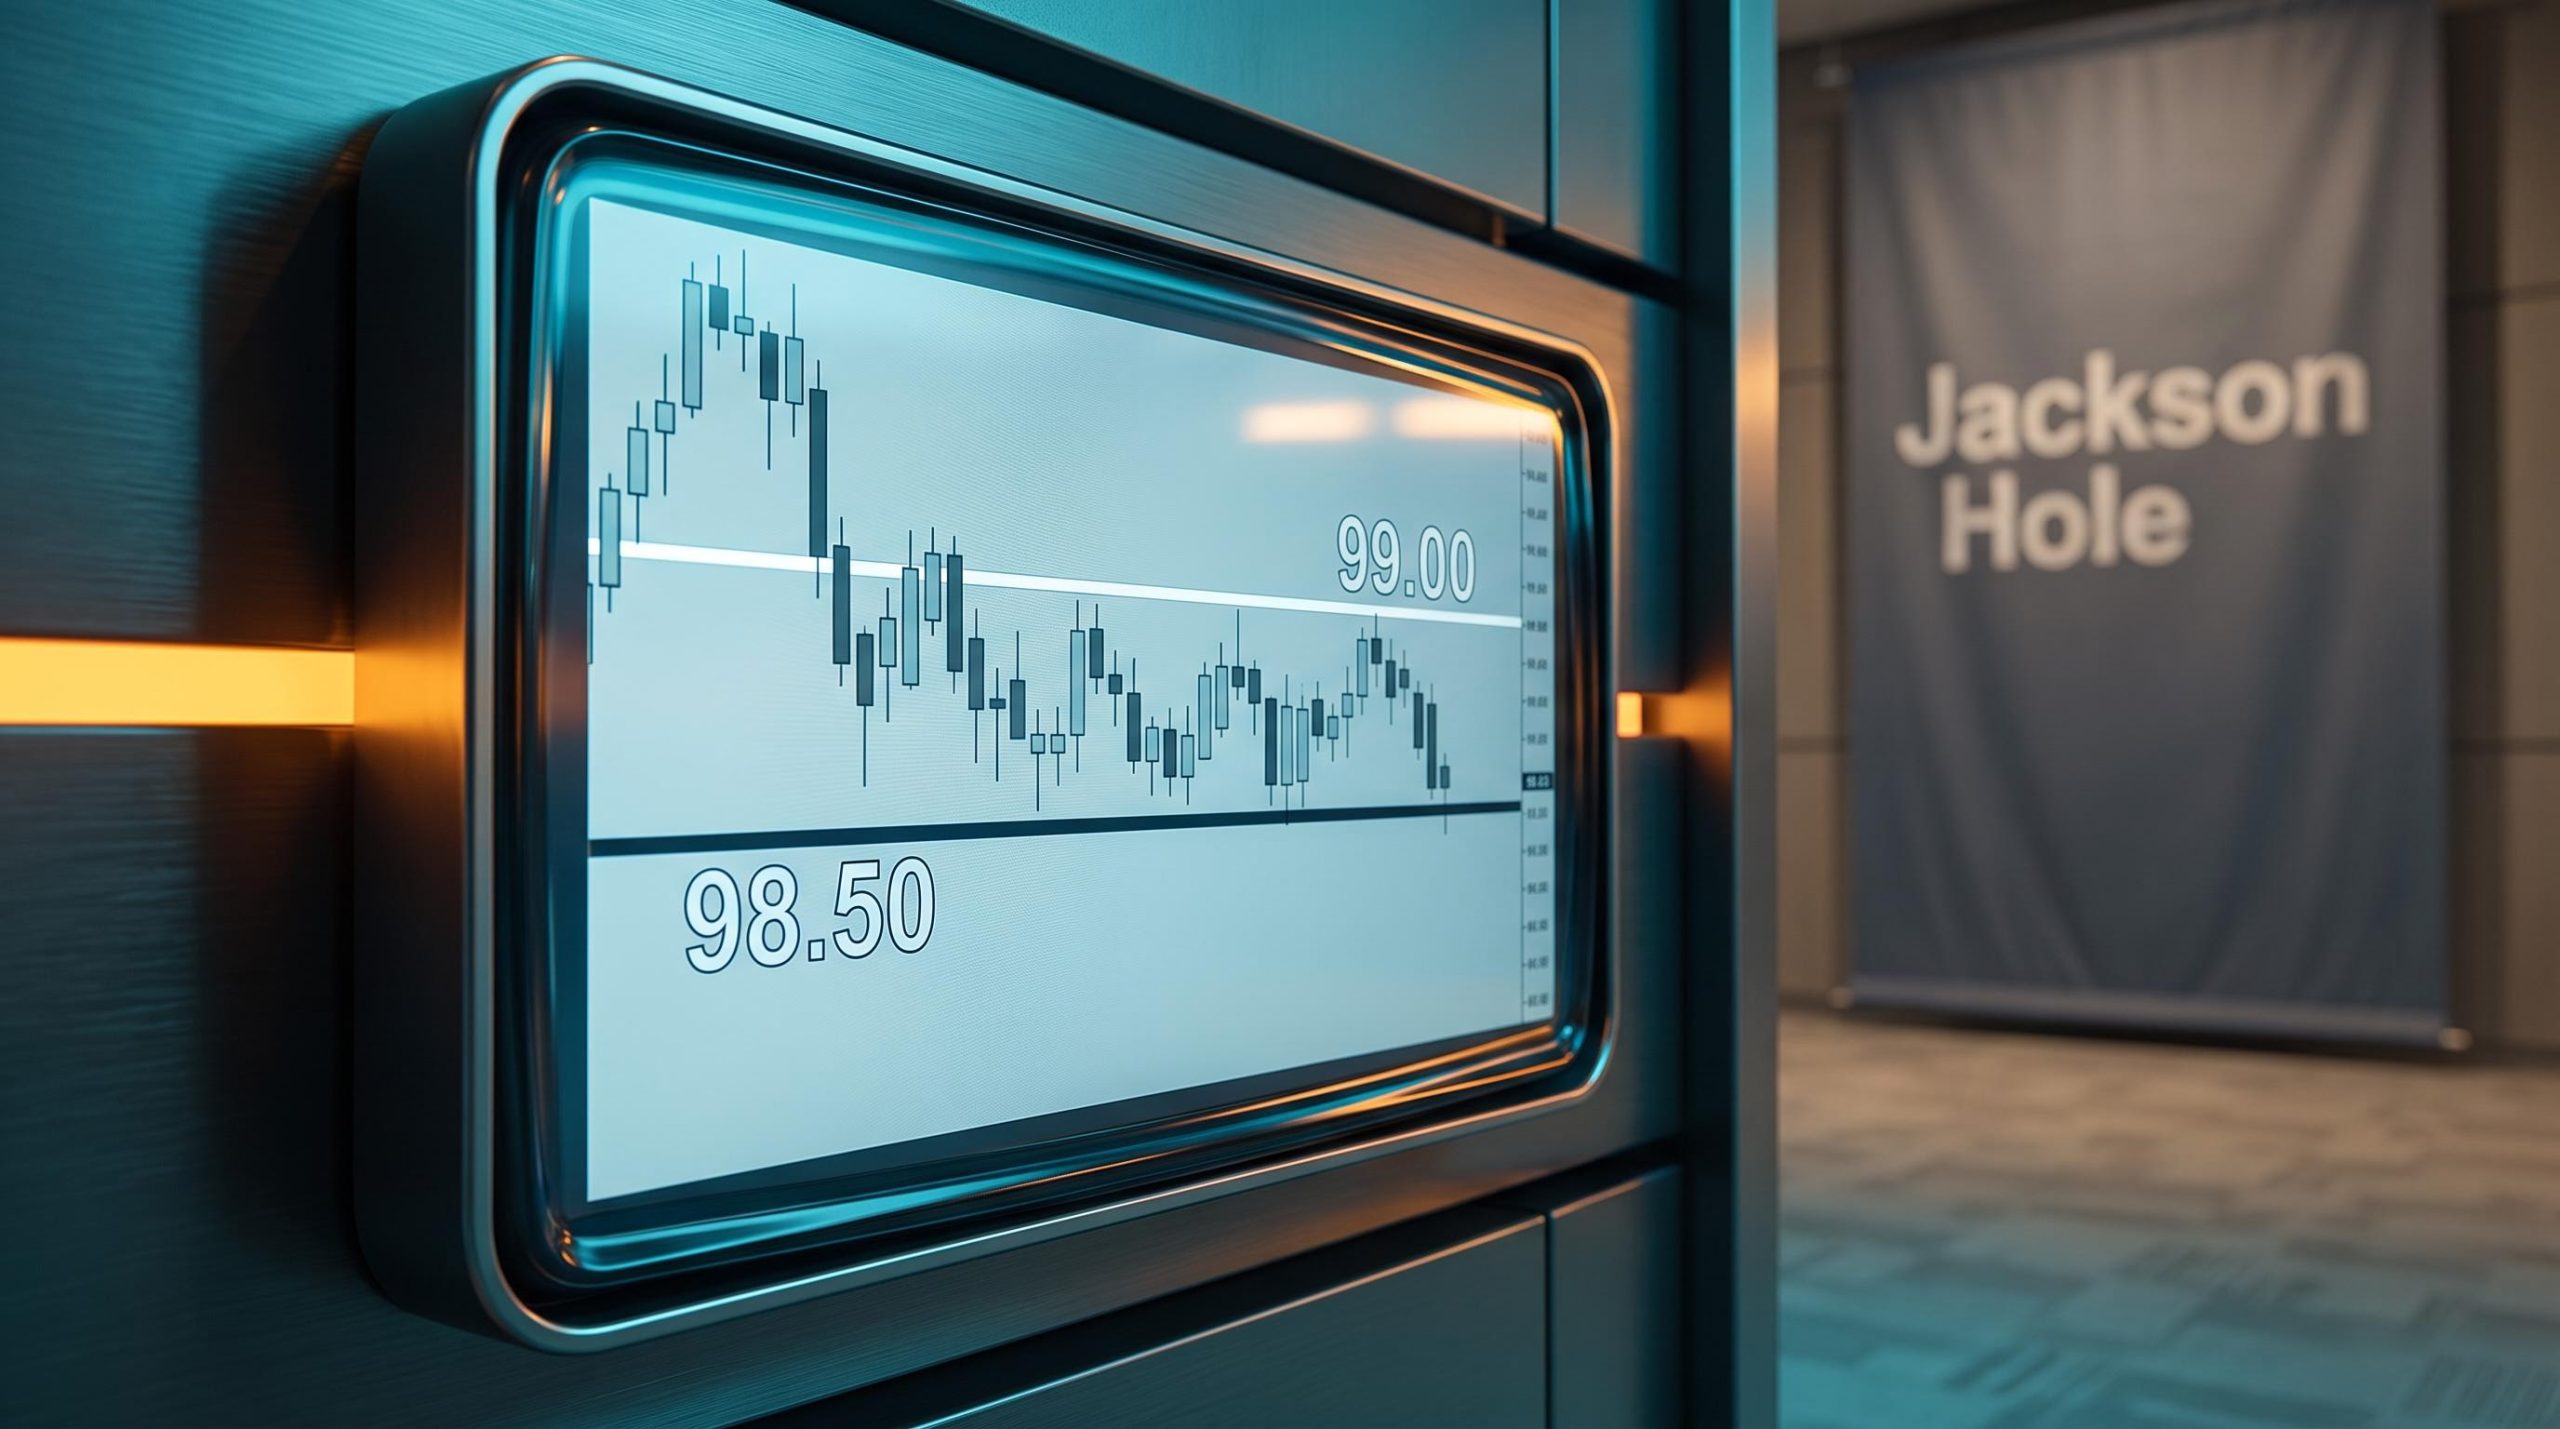
The DXY breakdown structure is not a one-session phenomenon: the Dollar Index settled below 98.80 on 19 August 2026 after completing a stair-step breakdown in which every prior support level rotated into resistance, a pattern that suggests the soft USD environment amplifying GBP/USD gains is a structural condition rather than a transient dip, at least until Jackson Hole clarifies the Fed’s trajectory.
Two tailwinds are driving this trade simultaneously:
- BoE rate repricing: the inflation data keeping hike expectations alive and supporting sterling demand
- USD softness near multi-month lows: the DXY at its weakest level since mid-May, reducing the denominator side of the pair
When two independent forces are directionally aligned, the resulting move can look more convincing than either force warrants on its own. GBP/USD retained most of its gains through the North American session even as the dollar found partial support off its intraday lows, with the pair’s daily low near 1.3594 providing context for the intraday range.
The question worth stress-testing before adding exposure: what happens to GBP/USD if the dollar stabilises or recovers from its recent lows while the BoE story stays intact? A trade built on a single macro driver is easier to manage than one dependent on two concurrent tailwinds both persisting. Identifying that both forces are contributing helps you calibrate how much of the current move is durable versus coincidental.
Where the pair is most vulnerable and what would change the picture
The current setup offers three clearly differentiated scenarios, each with a specific triggering condition and implication for positioning:
- Bullish continuation: Price sustains above 1.3609 and the RSI cools from overbought levels without a meaningful pullback. This would open the path toward retesting higher levels, with no defined overhead resistance in the current dataset. The implication is that the macro bid is strong enough to absorb overbought conditions, and existing long positions have room to run.
- Constructive pullback into the buy zone: Price dips toward the 1.3499-1.3409 former resistance cluster and the SMA convergence near 1.3390. Technical analysis characterises this zone as a buy-the-dip opportunity within an ongoing uptrend, not a trend-reversal signal. The implication is that this pullback would offer a better risk-reward entry for traders who missed the initial move.
- Trend invalidation below 1.3390: A sustained break below the SMA convergence zone would bring the uptrend’s validity into question and require a reassessment of the directional thesis. The implication is that both the technical and macro arguments would need re-evaluation at that point.
The one level that changes everything
At 1.3390, all three major simple moving averages (the 50-, 100-, and 200-day) converge into a single price zone. It is not just a technical level. It is the point where the macro narrative (BoE tightening supports sterling) and the technical structure (uptrend intact above moving average support) either hold together or come apart.
For anyone running a directional GBP/USD position into the December BoE meeting, 1.3390 is the single most important number to monitor. Everything above it keeps the constructive thesis intact. A sustained break below it changes the picture entirely.
The December meeting itself remains the key macro catalyst. Any data between now and then that softens inflation expectations would alter the rate-expectation pillar of the trade, regardless of where the technicals sit.
Trading GBP/USD into December: what the macro and technical picture actually supports
The evidence presented across this analysis points in one direction. The BoE’s tightening bias, the CPI confirmation, and the bullish technical structure above the SMA convergence zone collectively support a constructive GBP/USD view into the December meeting.
Two qualifications temper that view: the RSI is overbought near-term, raising the probability of a consolidation before further upside, and the trade is being amplified by concurrent USD softness that may not persist. Both factors argue for patience on new entries rather than chasing current levels.
The most useful forward posture is specific. Monitor 1.3390 as the macro-technical anchor. If the pair pulls back toward the 1.3499-1.3409 zone with the RSI cooling, the setup improves. If 1.3390 breaks, the thesis needs reassessment. That is the framework the data supports today.
For investors wanting to model how the dollar-side of this trade behaves across CPI scenarios, our full explainer on DXY technical positioning maps the specific support and resistance levels active before the July US CPI print, including the conditions under which the bearish DXY structure would reverse and apply counter-pressure to GBP/USD.
This article is for informational purposes only and should not be considered financial advice. Investors should conduct their own research and consult with financial professionals before making investment decisions. Past performance does not guarantee future results. Financial projections are subject to market conditions and various risk factors.