
MA Financial delivers 45% underlying EPS growth and lifts dividend 33% in 1H26
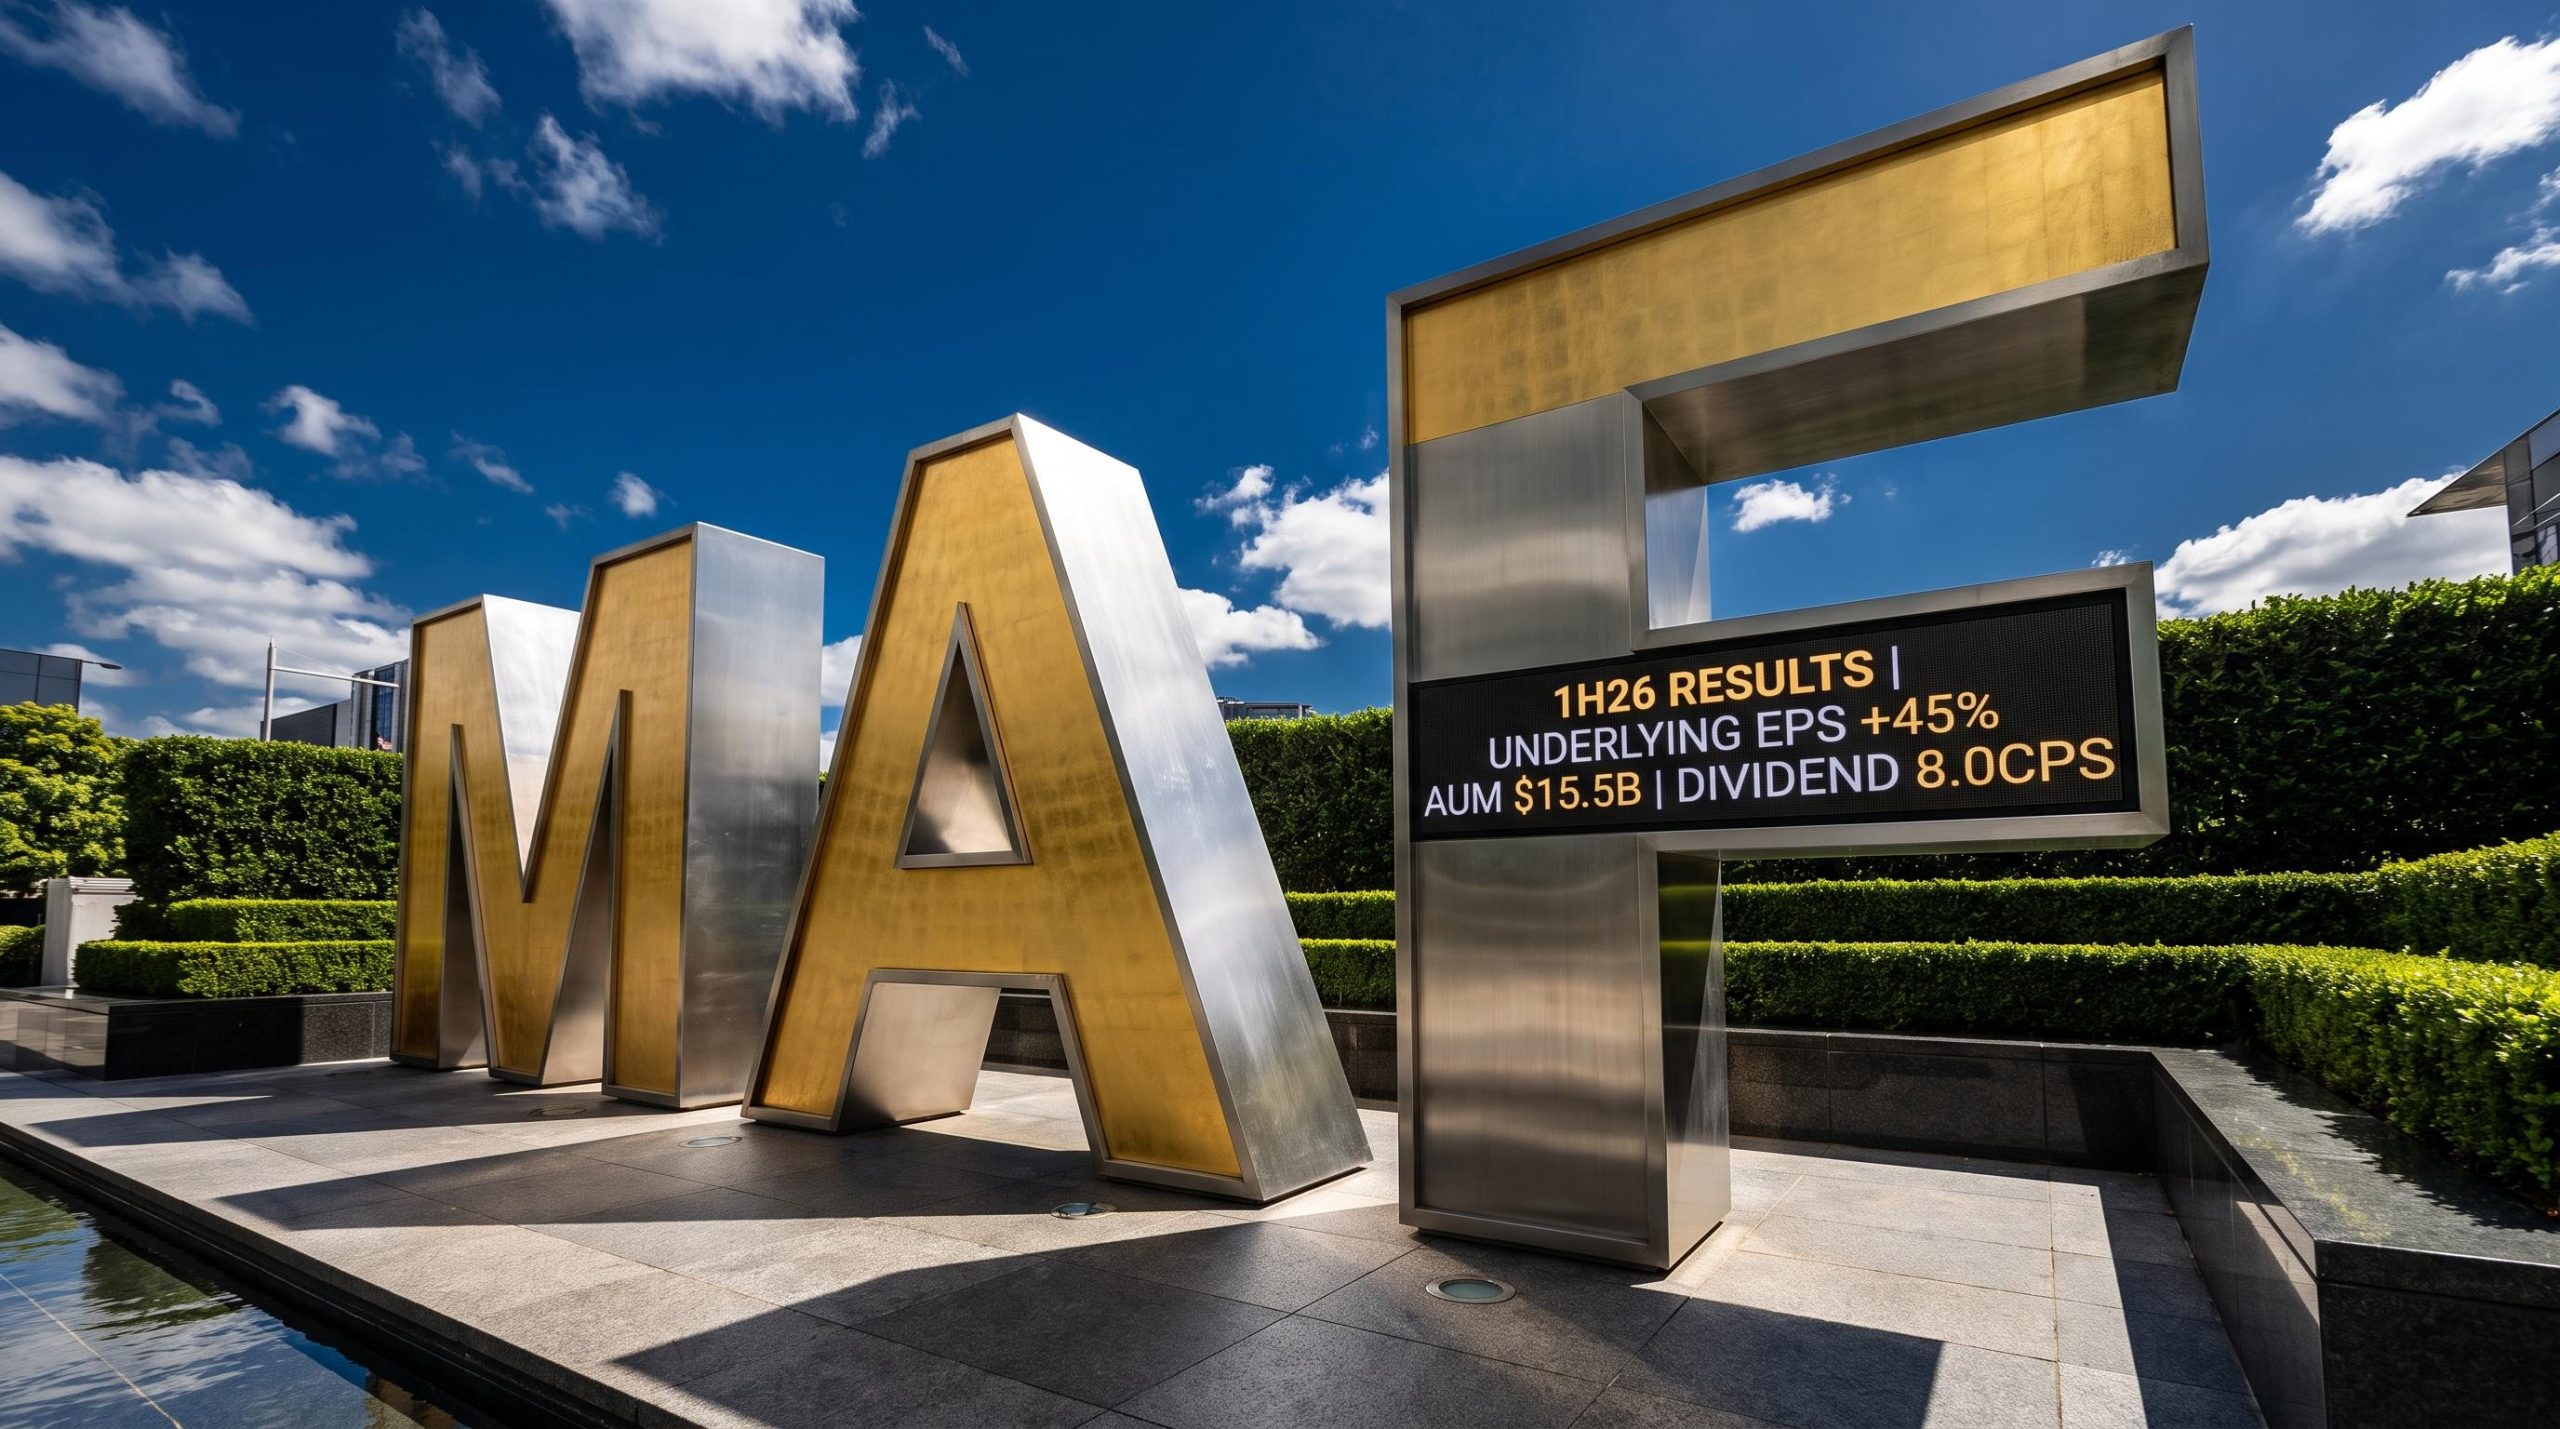
In its 1H26 results presentation, MA Financial Group reported underlying earnings per share of 20.3 cents excluding large notable items (LNI), up 45% on the prior corresponding period. The result reflected record revenue and broad-based growth across the group’s diversified asset management, lending and advisory platforms.
Including LNI, underlying EPS reached 27.5 cents, up 96% on 1H25. Management outlined a business benefitting from increasingly diversified and recurring earnings streams over the half-year ended 30 June 2026.
Key headline figures from the presentation included:
-
Underlying EPS ex LNI of 20.3 cents, up 45% on 1H25
-
Underlying EPS incl LNI of 27.5 cents, up 96% on 1H25
-
Record underlying revenue of $230 million, up 41%
-
Interim dividend of 8.0 cents per share fully franked, up 33% (payable 16 September 2026)
-
Assets under Management (AUM) of $15.5 billion, up 44%
-
Recurring revenue contributing a record 72% of total revenue (ex LNI)
Management noted the group is well positioned for continued material earnings growth in FY26, with FY26 EPS anticipated to be materially higher than FY25 and an earnings skew toward the second half (ex LNI).
When big ASX news breaks, our subscribers know first
A record half built on diversified, recurring revenue
The presentation detailed a period of strong operating momentum, with recurring revenue rising 28% to $154 million. Management emphasised the shift toward higher-quality, more predictable earnings as scale and diversification continue to compound.
| Metric | 1H26 (incl LNI) | 1H26 (ex LNI) | 1H25 | Change (ex LNI) |
|---|---|---|---|---|
| Revenue | $230.1m | $214.6m | $163.4m | +31% |
| EBITDA | $83.8m | $68.2m | $47.8m | +43% |
| NPAT | $48.5m | $35.9m | $22.6m | +59% |
| EPS | 27.5c | 20.3c | 14.0c | +45% |
| ROE | 21.0% | 15.5% | 11.0% | +4.5pps |
Strategic investment spend reduced underlying EBITDA by $3.3 million in 1H26, down from $6.1 million in 1H25. Headline growth was also aided by co-investment realisations classified as LNI, which the group has been transparent in isolating for comparability.
Understanding “underlying” earnings and Large Notable Items
MA Financial reports both statutory (IFRS) and underlying results. Statutory results follow accounting standards and consolidate the group’s lending trusts, which is why statutory revenue reached $623.2 million for the half. These figures capture large securitisation vehicles the group manages.
Underlying results strip out these consolidation effects to reflect the run-rate business economics that management uses to allocate resources and make decisions.
Large Notable Items (LNI) refer to significant net realised gains and losses from the disposal of two Asset Management co-investments during the period. This comprised a realised gain on the sale of Infinite Aged Care, partly offset by a realised loss on the sale of the Brunswick Heads Hotel.
For like-for-like trend analysis, investors are directed to the ex-LNI figures. The LNI gains nonetheless reflect a genuine capital-recycling capability within the platform.
Divisional performance drives the result
Asset Management — the engine (59% of EBITDA)
Asset Management remained the largest EBITDA contributor at 59%. AUM reached $15.5 billion, up 44%, despite the sale of the Marion and Corrimal shopping centres for approximately $700 million.
-
Recurring revenue of $96.2 million, up 15%
-
Transaction-based revenue of $22.1 million, up 220% from cyclical lows
-
Total fee-based margin of 1.59%
-
MA Redcape Hotel Fund achieved 15.4% like-for-like venue earnings growth and a 17.5% total investor return over 12 months
-
MA Aged Care Fund delivered a 2.8x multiple on invested capital via the Infinite Aged Care divestment
The MA Aged Care Fund exit delivered a 2.8x multiple on invested capital for fund investors, with MA Financial securing approximately $20 million in gains plus a performance fee from the sale of Infinite Care to Anglicare Sydney.
Lending & Technology — accelerating scale (35% of EBITDA)
The Lending & Technology division contributed 35% of EBITDA, driven by rapid loan book expansion.
-
MA Money loan book of $7.5 billion, up 127%; net interest margin (NIM) of 1.33%, in the upper half of the 1.2%–1.4% target range
-
Finsure managed loans of $193 billion, up 25%; revenue per broker of $13k, up 16%
-
Middle™ processing approximately $1 billion of loan applications per week
Corporate Advisory & Equities — poised for 2H (6% of EBITDA)
Corporate Advisory & Equities contributed 6% of EBITDA, with revenue of $27 million, down 5% on deal-timing rather than lost mandates. The division advised on over $2.3 billion of transactions that closed in 1H26, including the FDC Consolidated Holdings IPO and the Star Entertainment Group debt refinancing mandate.
Management flagged a strong start to 2H26, with already-announced deals expected to deliver $25 million in FY26 fees.
Management perspective
The presentation stated that the group is well positioned for continued material earnings growth in FY26, underpinned by a business model built to compound shareholder value through scale and diversification.
Post-period momentum and the FY29 roadmap
The presentation outlined continued positive momentum into the second half, alongside upgraded three-year strategic targets.
Post-balance-date highlights included:
-
Asset Management recorded $449 million of gross fund inflows (net $166 million) in the first six weeks of 2H26, with the MA Priority Income Fund awarded Private Debt Fund of the Year by Lonsec.
-
MA Redcape Hotel Fund entered into contracts to acquire seven hotels in the Newcastle region from Iris Capital and divest two hotels in Western Sydney, described in the presentation as the largest freehold hospitality transaction in Australian history.
-
MA Money settled over $1 billion of new loans in 2H26 to date, taking the loan book to over $8 billion, and priced a $1 billion residential mortgage backed securities (RMBS) issuance on 31 July.
-
Corporate Advisory announced transactions expected to add $25 million in FY26 fees.
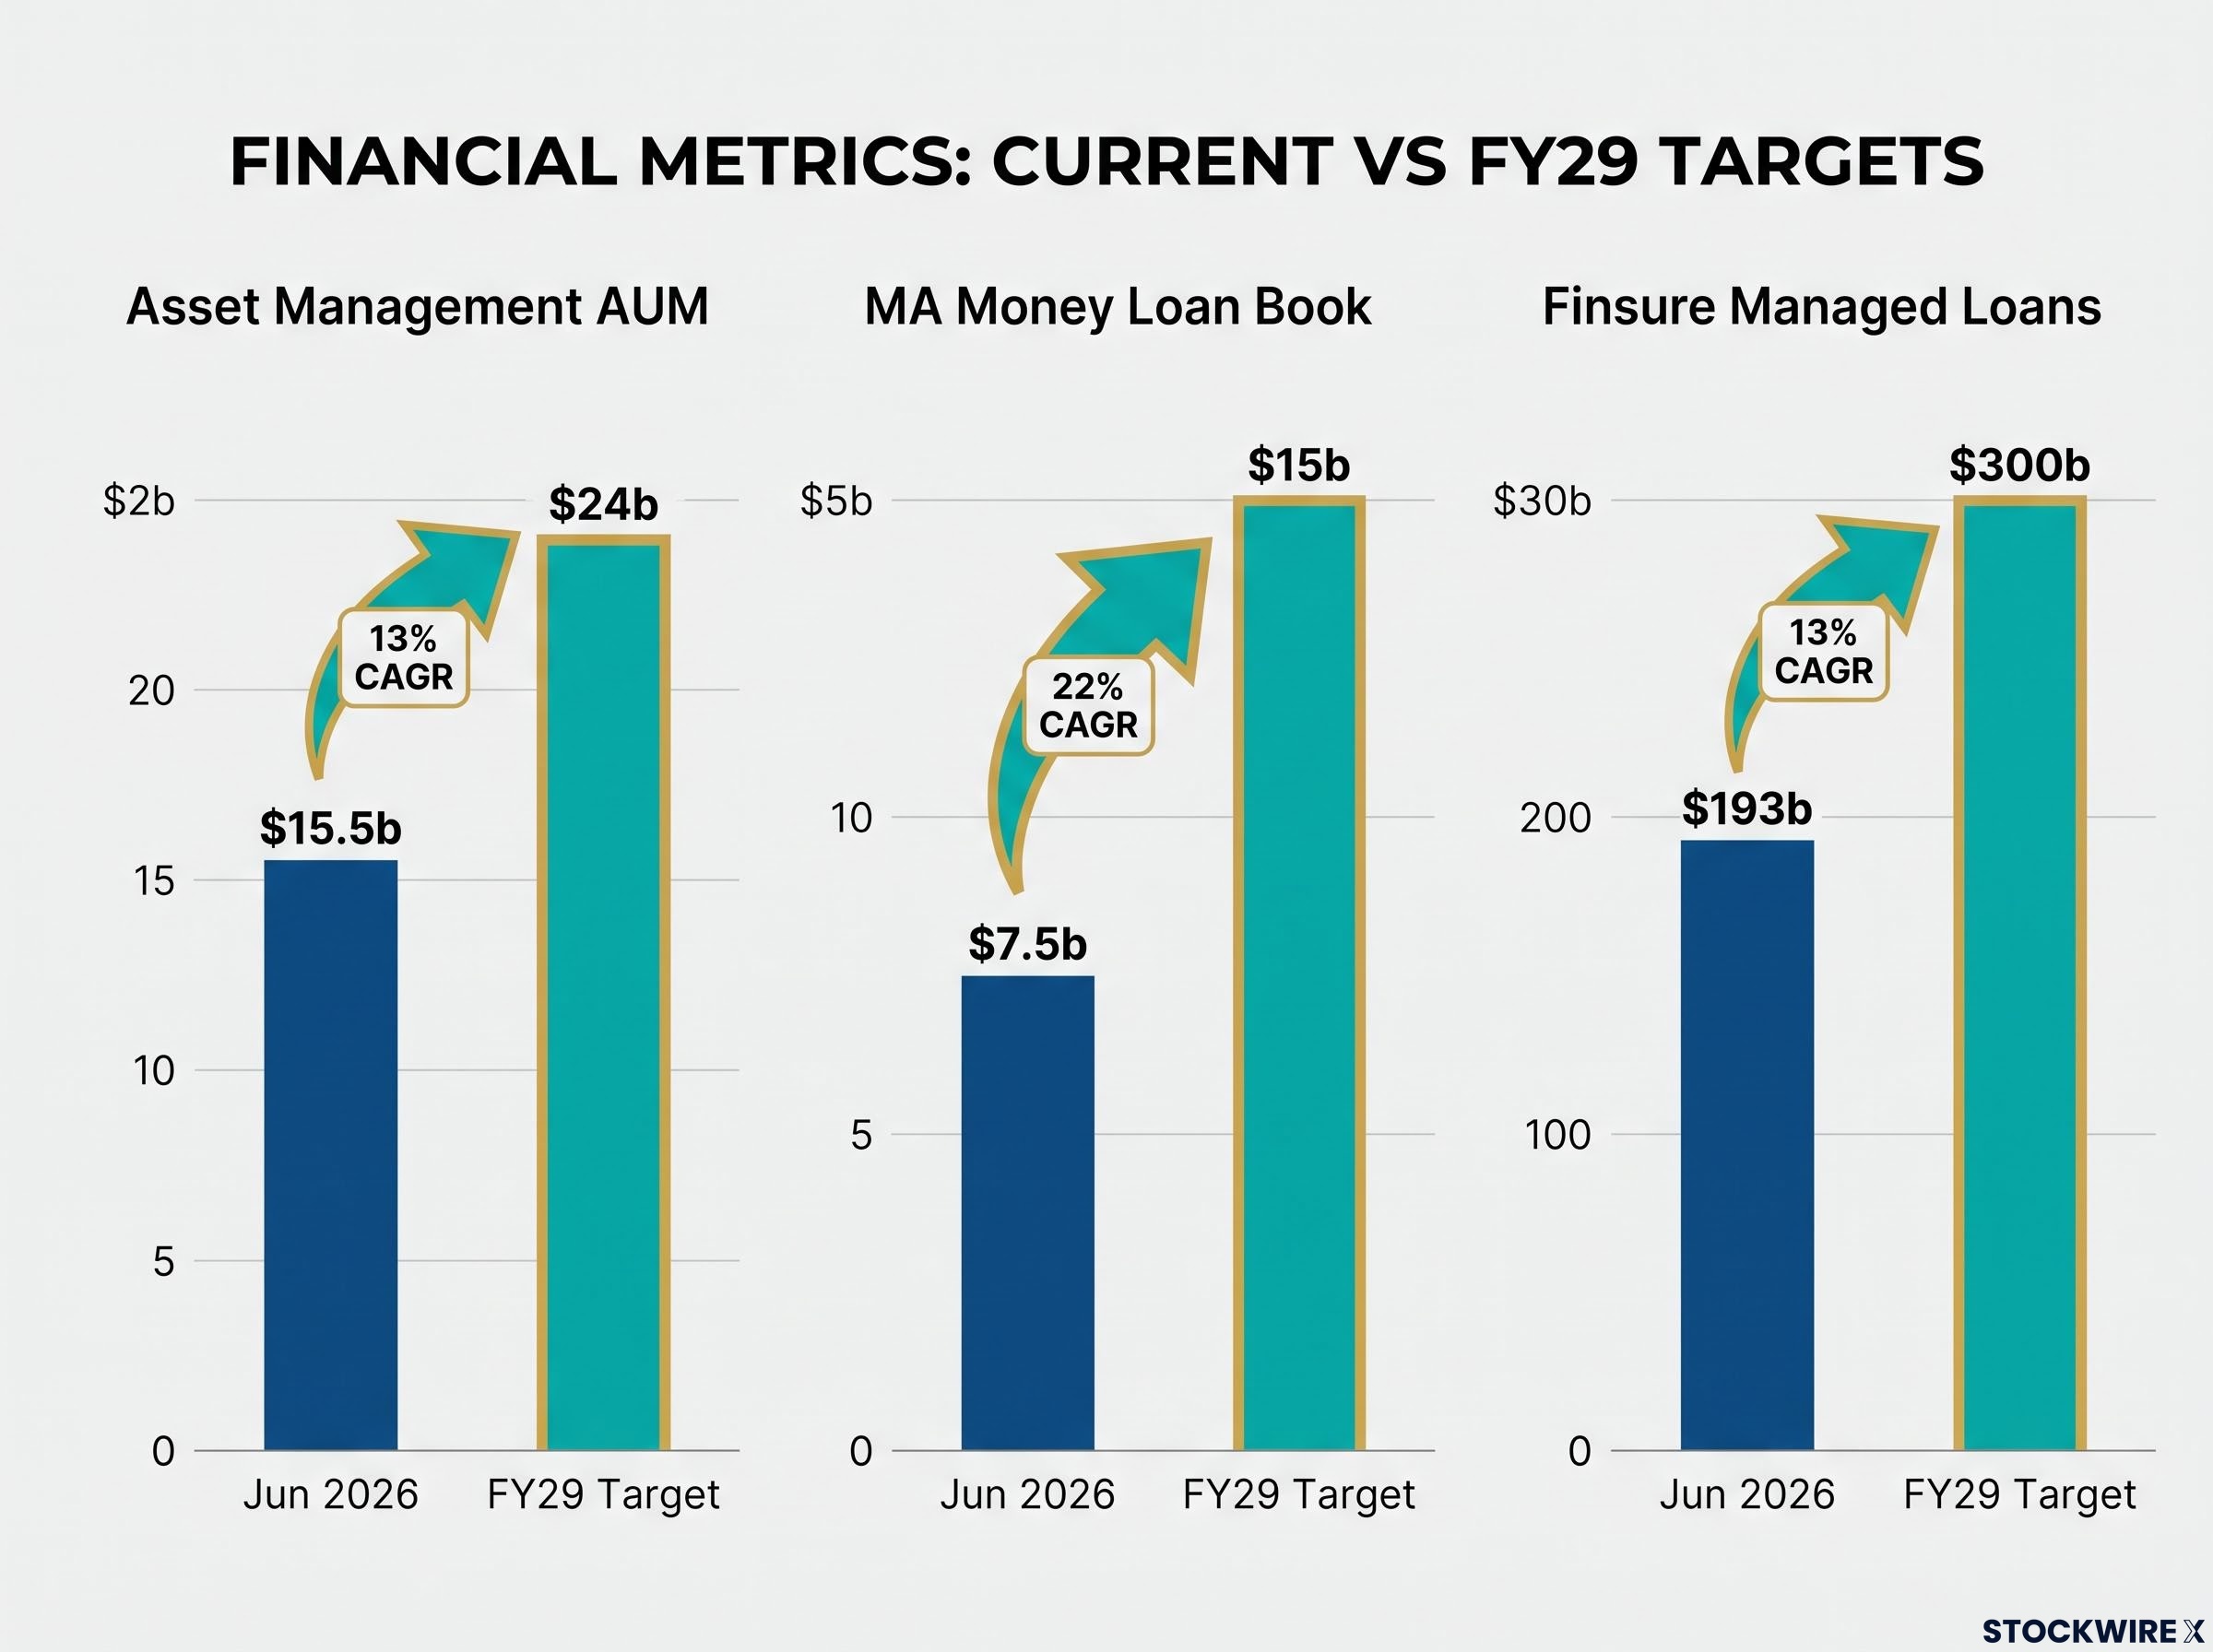
The company also updated its FY29 targets, reflecting the multi-year growth runway across each division.
| Division | Measure | Jun 2026 | FY29 Target | Implied CAGR |
|---|---|---|---|---|
| Asset Management | AUM | $15.5b | $24b | 13% |
| MA Money | Loan book | $7.5b | $15b | 22% |
| Finsure | Managed loans | $193b | $300b | 13% |
| Group | EBITDA margin (ex strategic spend) | 34% ex LNI | 38–40% | n.a. |
On outlook, management guided MA Money toward a $25–$30 million NPAT contribution in FY26, with strategic investment spend tracking toward $6–$8 million for the year. FY26 EPS is anticipated to be materially higher than FY25, with an earnings skew to 2H26 (ex LNI).
The commentary reinforced the compounding, diversified-platform thesis and a clear multi-year growth runway across the group’s asset management, lending and advisory businesses.
Stay Ahead on ASX Finance and Fintech News
Get breaking ASX announcements delivered to your inbox within minutes of release, complete with in-depth analysis already done. Join 20,000+ investors who rely on Big News Blast for FREE real-time coverage across Finance, Fintech, and beyond. Click the “Free Alerts” button to start receiving alerts the moment market-moving news breaks.