
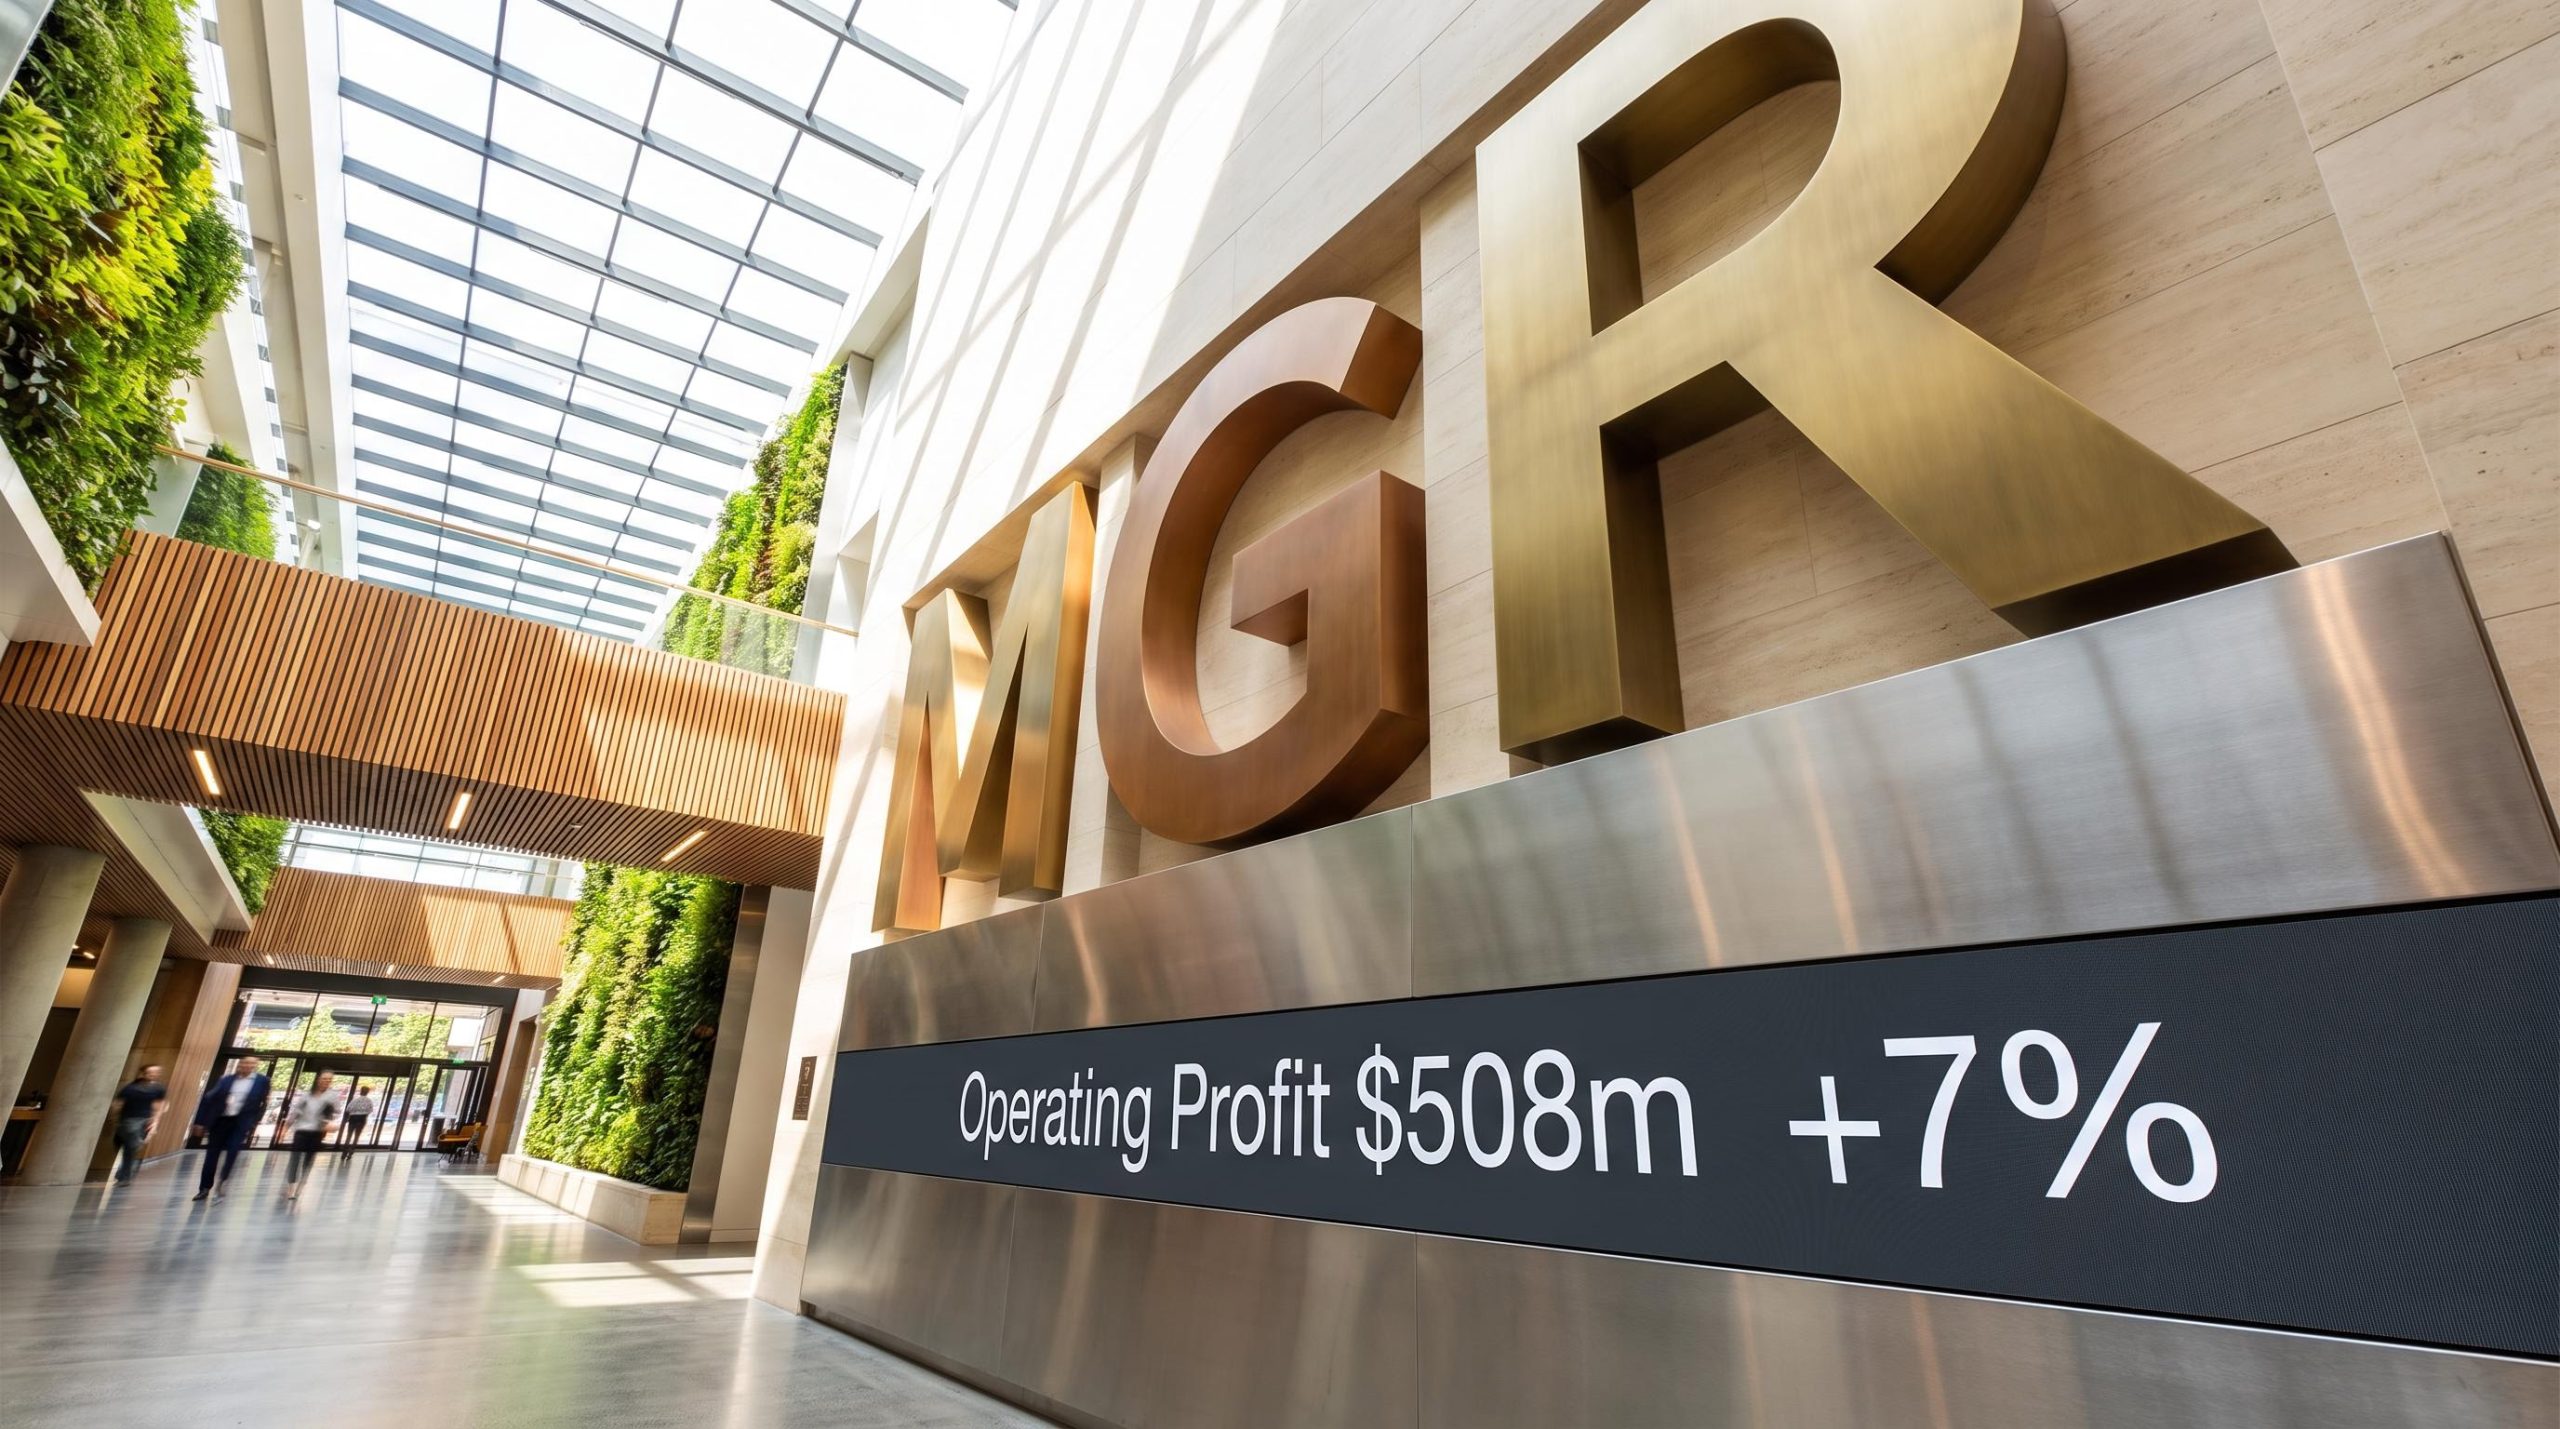
Mirvac delivers 7% EPS growth as statutory profit rebounds to $677m
In its FY26 results presentation, dated 19 August 2026, Mirvac Group detailed a return to strong profitability, with statutory profit rebounding to $677m from $68m in FY25 and operating profit rising to $508m, up 7%.
Management framed FY26 as a “platform reset” year, marking execution against a strategy designed to restore earnings quality after a weak FY25 impacted by residential impairments. Group EBIT reached $826m (up 12%), earnings per share (EPS) recovered to 12.9c (up 7%) and distribution per security (DPS) lifted to 9.5c (up 6%). Net tangible assets (NTA) grew 3% to $2.33, while headline gearing fell to 24.1% from 27.6%.
The Mirvac FY26 results reflect the company’s integrated model across four pillars: Investment, Funds, Development and Asset management.
When big ASX news breaks, our subscribers know first
FY26 results at a glance
The headline scorecard below compares the completed FY26 period against FY25.
| Metric | FY26 | FY25 | Change |
|---|---|---|---|
| Statutory Profit | $677m | $68m | >100% |
| Group EBIT | $826m | $736m | +12% |
| Operating Profit | $508m | $474m | +7% |
| EPS | 12.9c | 12.0c | +7% |
| DPS | 9.5c | 9.0c | +6% |
| NTA | $2.33 | $2.26 | +3% |
| Headline Gearing | 24.1% | 27.6% | -3.5% |
Beyond the headline earnings, the presentation outlined the scale of Mirvac’s operating platform:
-
Third-party capital under management $18.1b (+12% YoY)
-
Assets under management $23.7bn
-
Investment portfolio ~$10.5bn
-
Development pipeline ~$27bn
-
Residential exchanges 2,425 lots (+15% YoY)
Segment performance drove the earnings rebound
Growth came primarily from the Development segment, where EBIT rose 52% to $270m. Management attributed this to residential margin recovery and commercial contributions from 55 Pitt Street, SEED Stage 2 and Aspect.
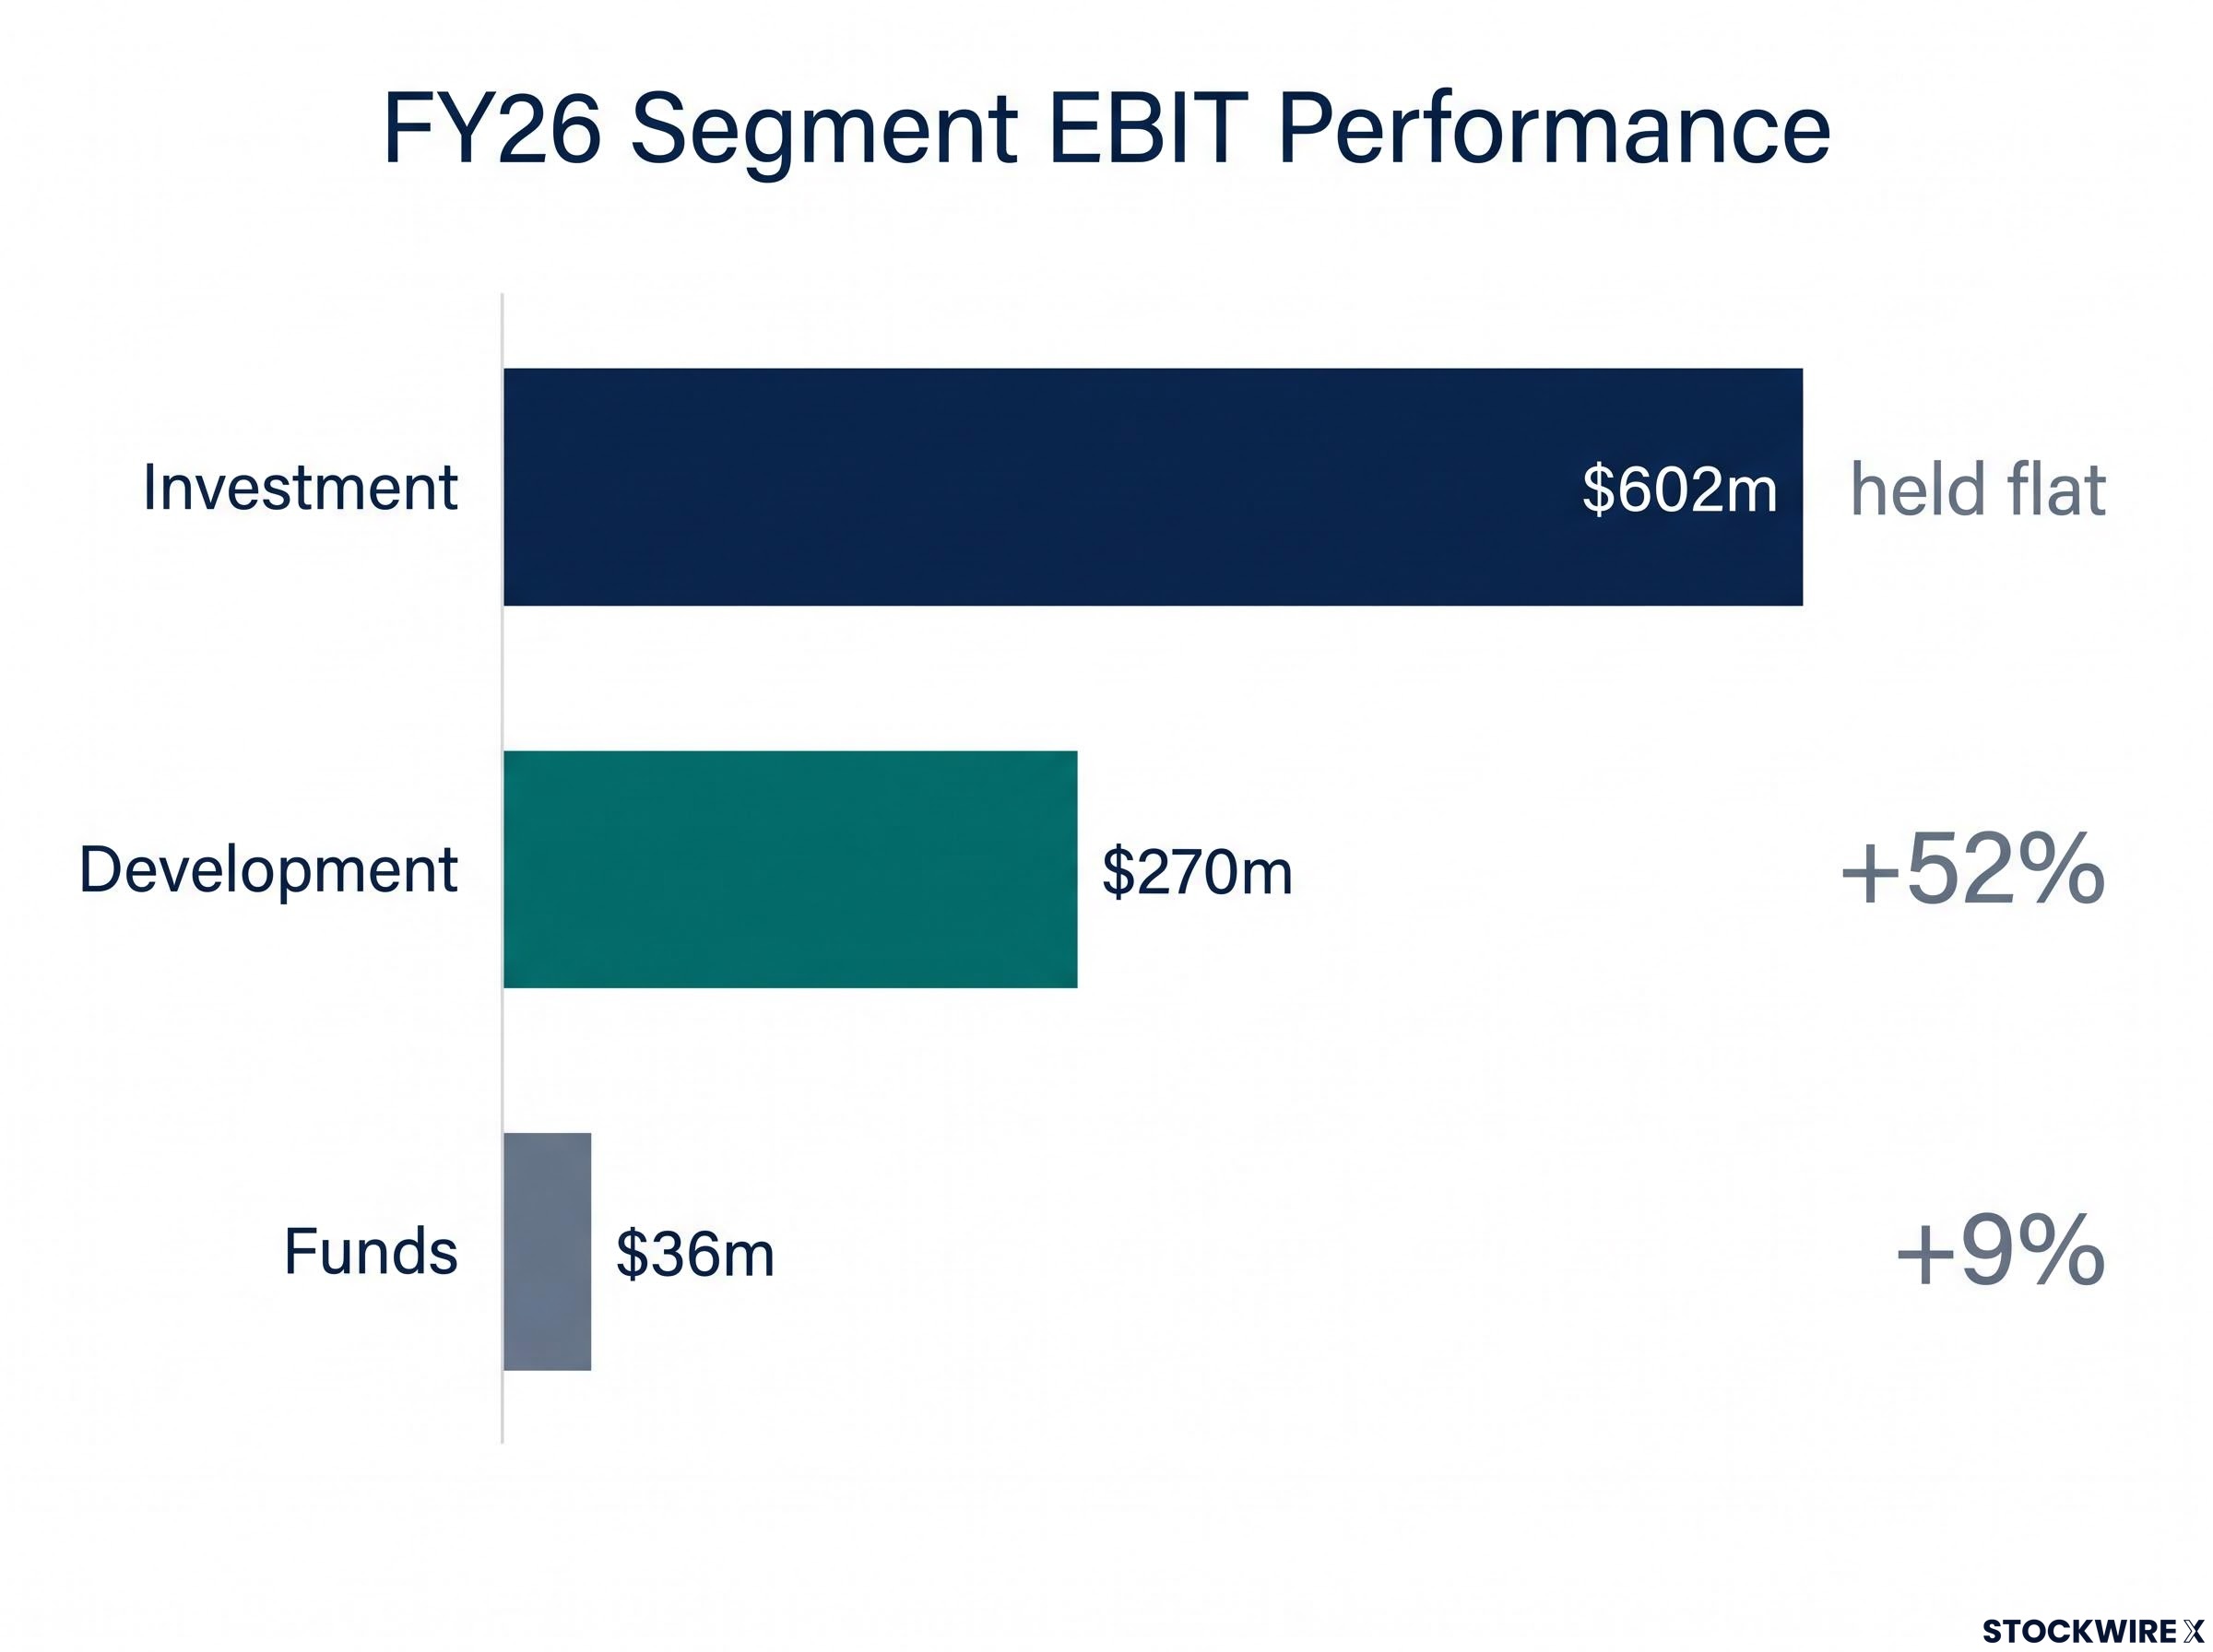
Investment EBIT held flat at $602m, as growth in Living and Industrial net operating income (NOI) was offset by income lost on non-core Office disposals. Funds EBIT lifted 9% to $36m, supported by build-to-rent (BTR) completions growing funds under management (FUM).
Residential margins returned to target range
Residential gross margin recovered to 23.9% on a basis excluding impaired projects. Including impacted revenue from previously impaired projects, the FY26 gross margin was 20.1%, placing it back within the long-term 18–22% target range.
All impaired residential projects have now been completed and settled, with the final lot at NINE, Willoughby settling in July 2026. This clearing of legacy impaired projects points to improving earnings quality as the drag on returns is removed.
What is Mirvac’s integrated model?
Mirvac operates what management describes as an “asset creation and curation” cycle. In plain terms, the Development arm creates new assets, generating Development EBIT and NTA uplift. Those completed assets then flow into the Investment portfolio, producing recurring rental income, and into the Funds platform, producing recurring management fees.
Why does this matter to investors? The structure is designed to create multiple, complementary earnings streams rather than reliance on one-off development profits. Each completed development can feed both recurring income and recurring fees, supporting a self-reinforcing growth cycle across the group.
Balance sheet strength creates capacity for growth
The presentation positioned a strengthened balance sheet as the platform for future deployment, emphasising reduced gearing and a preserved credit rating.
-
Headline gearing 24.1% (down from 27.6%), within the 20–30% target range
-
Available liquidity $1,603m (up from $1,201m)
-
Total drawn debt $3,755m (down from $4,309m)
-
Average cost of debt 5.7%; hedging 66%
-
Credit rating A3/A- (Moody’s/Fitch), unchanged
-
~$7bn capital raised over the last 5 years; ~$3bn asset disposals over 5 years
Management identified several capital sources to fund FY27 activity, including 380 St Kilda Road, which has been exchanged and is expected to settle in 1H27, approximately $1.5bn in residential pre-sales, and continued capital partnering with strategically aligned partners.
Investment and Funds platforms scaling
The Investment portfolio, at approximately $10.5bn, has been repositioned toward Premium Office, Sydney Industrial and Living. The portfolio recorded strong operating metrics: 98% occupied, +4.5% leasing spreads, +5.3% like-for-like (LFL) NOI growth and +3.1% valuation growth.
Industrial was a standout, delivering +10.7% LFL NOI and +6.5% valuation growth. Construction of the SEED Badgerys Creek development (approximately $2bn expected end value) commenced in May 2026, with NOI contribution anticipated from FY28. Living EBIT rose 9% to $59m, with the BTR platform expanded to 2,467 apartments and the Land Lease platform grown to 8,267 lots.
On the Funds side, third-party capital under management reached $18.1bn, with $14.8bn raised over four years and approximately $3.2bn of future secured FUM. Management detailed the MWOF capital raise of “~$630m equivalent”, the LIV Mirvac Fund recapitalisation featuring an “ART 48.5% stake”, and the MIV venture with ART grown to “>$3.0bn”. These recurring fee and rental income streams underpin the durability of group earnings.
The growth runway into FY28 and beyond
Management outlined a series of forward catalysts extending the earnings runway:
-
Approximately ~$130m of new NOI over roughly three years from the stabilisation of committed developments.
-
Pipeline activation, including 5 apartment settlements in FY27 and 5 new masterplanned community (MPC) projects launching across FY26/27, plus Hunter St East and Blackwattle Bay (approximately ~$5.5bn combined expected end value). These two projects have contracts exchanged, subject to satisfaction of conditions precedent, and are not yet reflected in the reported pipeline.
-
Funds platform deployment across MWOF, LIV Mirvac Fund, MIV and Retail.
-
An accretive on-market share buyback of up to ~$200m, initiated.
The presentation noted more than 15,000 new lots secured or progressing through planning over the last three years, supporting a future pipeline of approximately 26,000 lots.
FY27 guidance: management targets continued EPS growth
For FY27, Mirvac is targeting operating EPS of 13.2–13.4 cpss, representing approximately 2–4% growth, and a distribution of 9.9 cpss, representing growth of 4.2%.
The guidance rests on stated key assumptions, including FY27 residential settlements of 2,800–3,100 lots and a weighted average cost of debt of approximately 5.7%.
FY27 Guidance Framing
Group CEO & Managing Director Campbell Hanan presented the FY27 targets as subject to no material changes to the operating environment and delivery on key initiatives.
Why FY26 matters for investors
The FY26 results tie together several threads: an earnings rebound, residential margins restored to the target range, a de-geared balance sheet, a scaling funds platform and a visible multi-year growth runway supported by an initiated buyback.
Together, these point to a business that has completed a reset year and positioned itself for compounding growth across its integrated model. The FY27 guidance, targeting continued EPS and distribution growth, provides the near-term proof point against which management’s execution will be measured.
Stay Ahead on ASX Real Estate and Property News
Get FREE breaking ASX announcements delivered to your inbox within minutes, complete with in-depth analysis already done for you. Join 20,000+ investors who rely on Big News Blast to stay ahead of the market. Click the “Free Alerts” button to start receiving real-time coverage the moment market-moving news breaks.