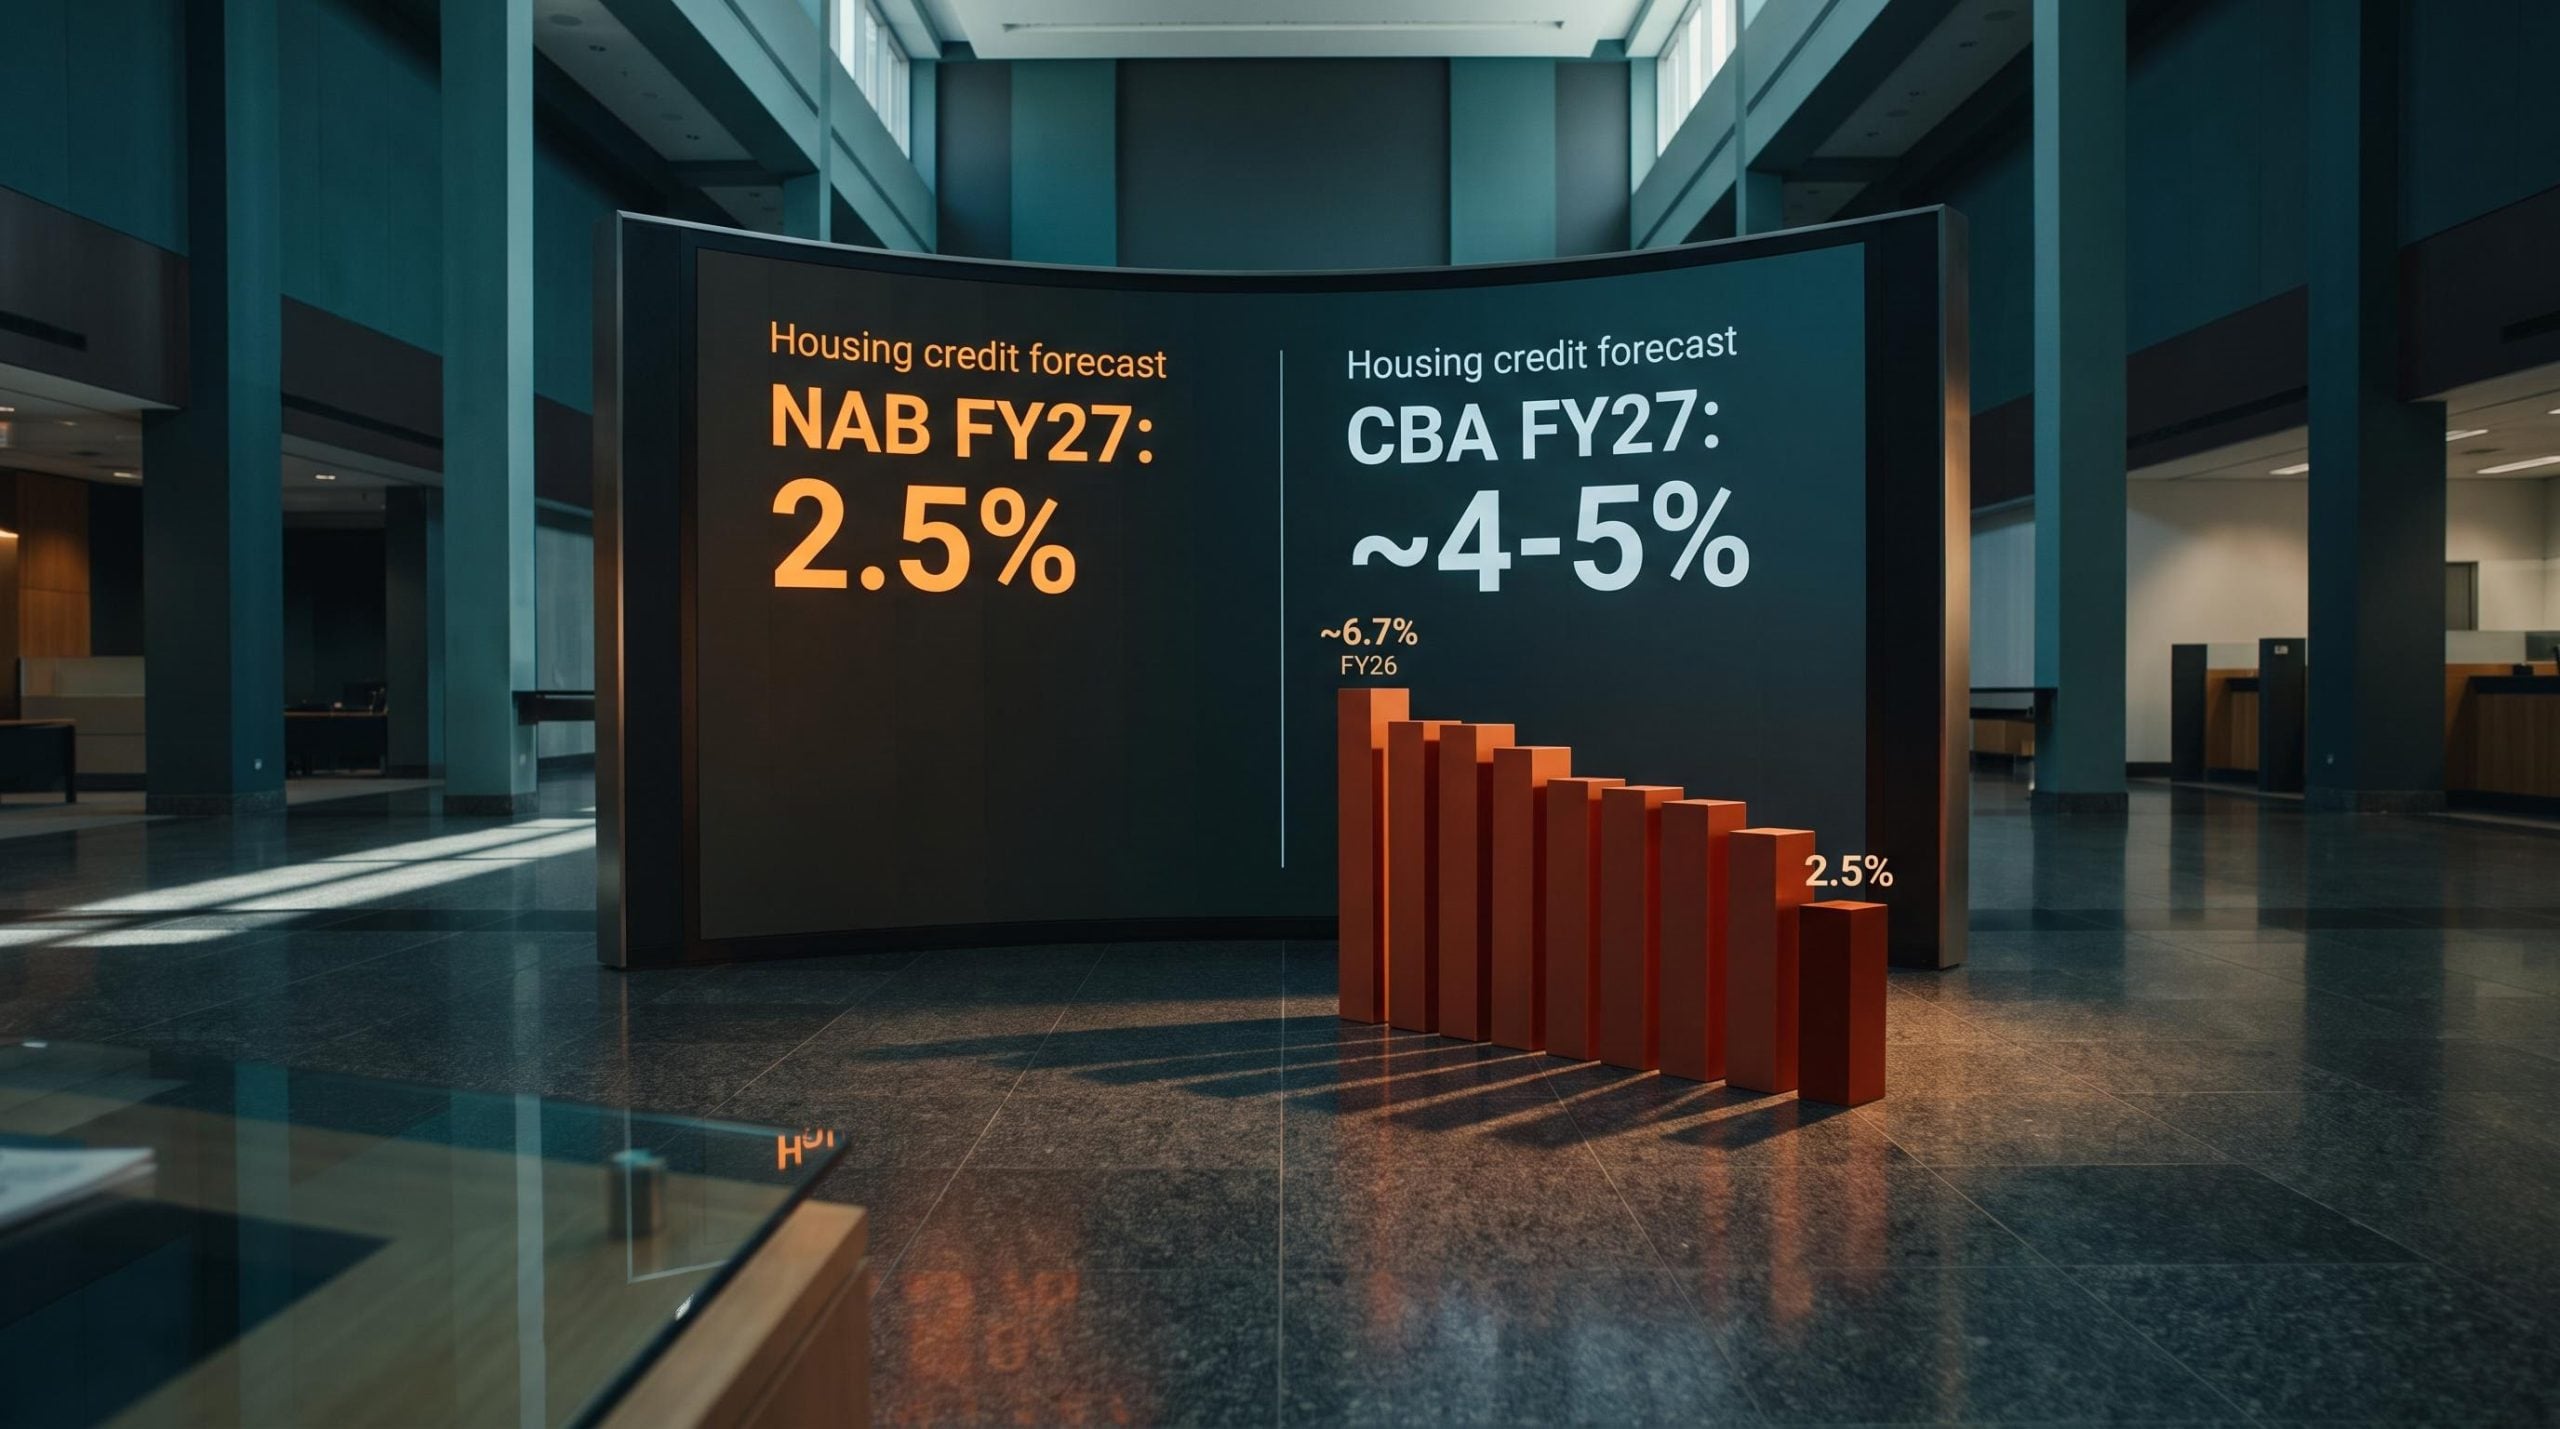
NAB‘s economists are forecasting just 2.5% housing credit growth for FY27. When that number landed, CBA‘s own guidance was sitting at 5-7%. That is not a rounding difference. It is a structural disagreement about whether Australian mortgage lending has a growth engine at all in the coming year.
Both banks are reporting against a backdrop of falling mortgage applications and rate-sensitive borrowers. CBA has since revised its guidance down to approximately 4-5%, but the gap with NAB‘s floor remains wide enough to produce materially different earnings outcomes across the mortgage sector.
Here is what the forecast gap, the pipeline data, and CBA‘s downward revision actually tell you about how to position around the Australian mortgage sector heading into FY27. This is a data-grounded read of the divergence, not a prediction of who is right.
The numbers on the table: what NAB and CBA are actually projecting
The scale of the disagreement becomes clearest when you line up the figures side by side.
NAB is projecting housing credit growth of just 2.5% for FY27, a sharp step down from an estimated 6.7% in FY26. That is a deceleration of more than 60% in the growth rate within a single year.
CBA originally guided for 5-7% housing credit growth over the coming year. That figure has since been revised to approximately 4-5%, a meaningful convergence toward NAB‘s position. The revision itself is analytically significant: the optimistic bank moved toward the pessimist, not the other way around.
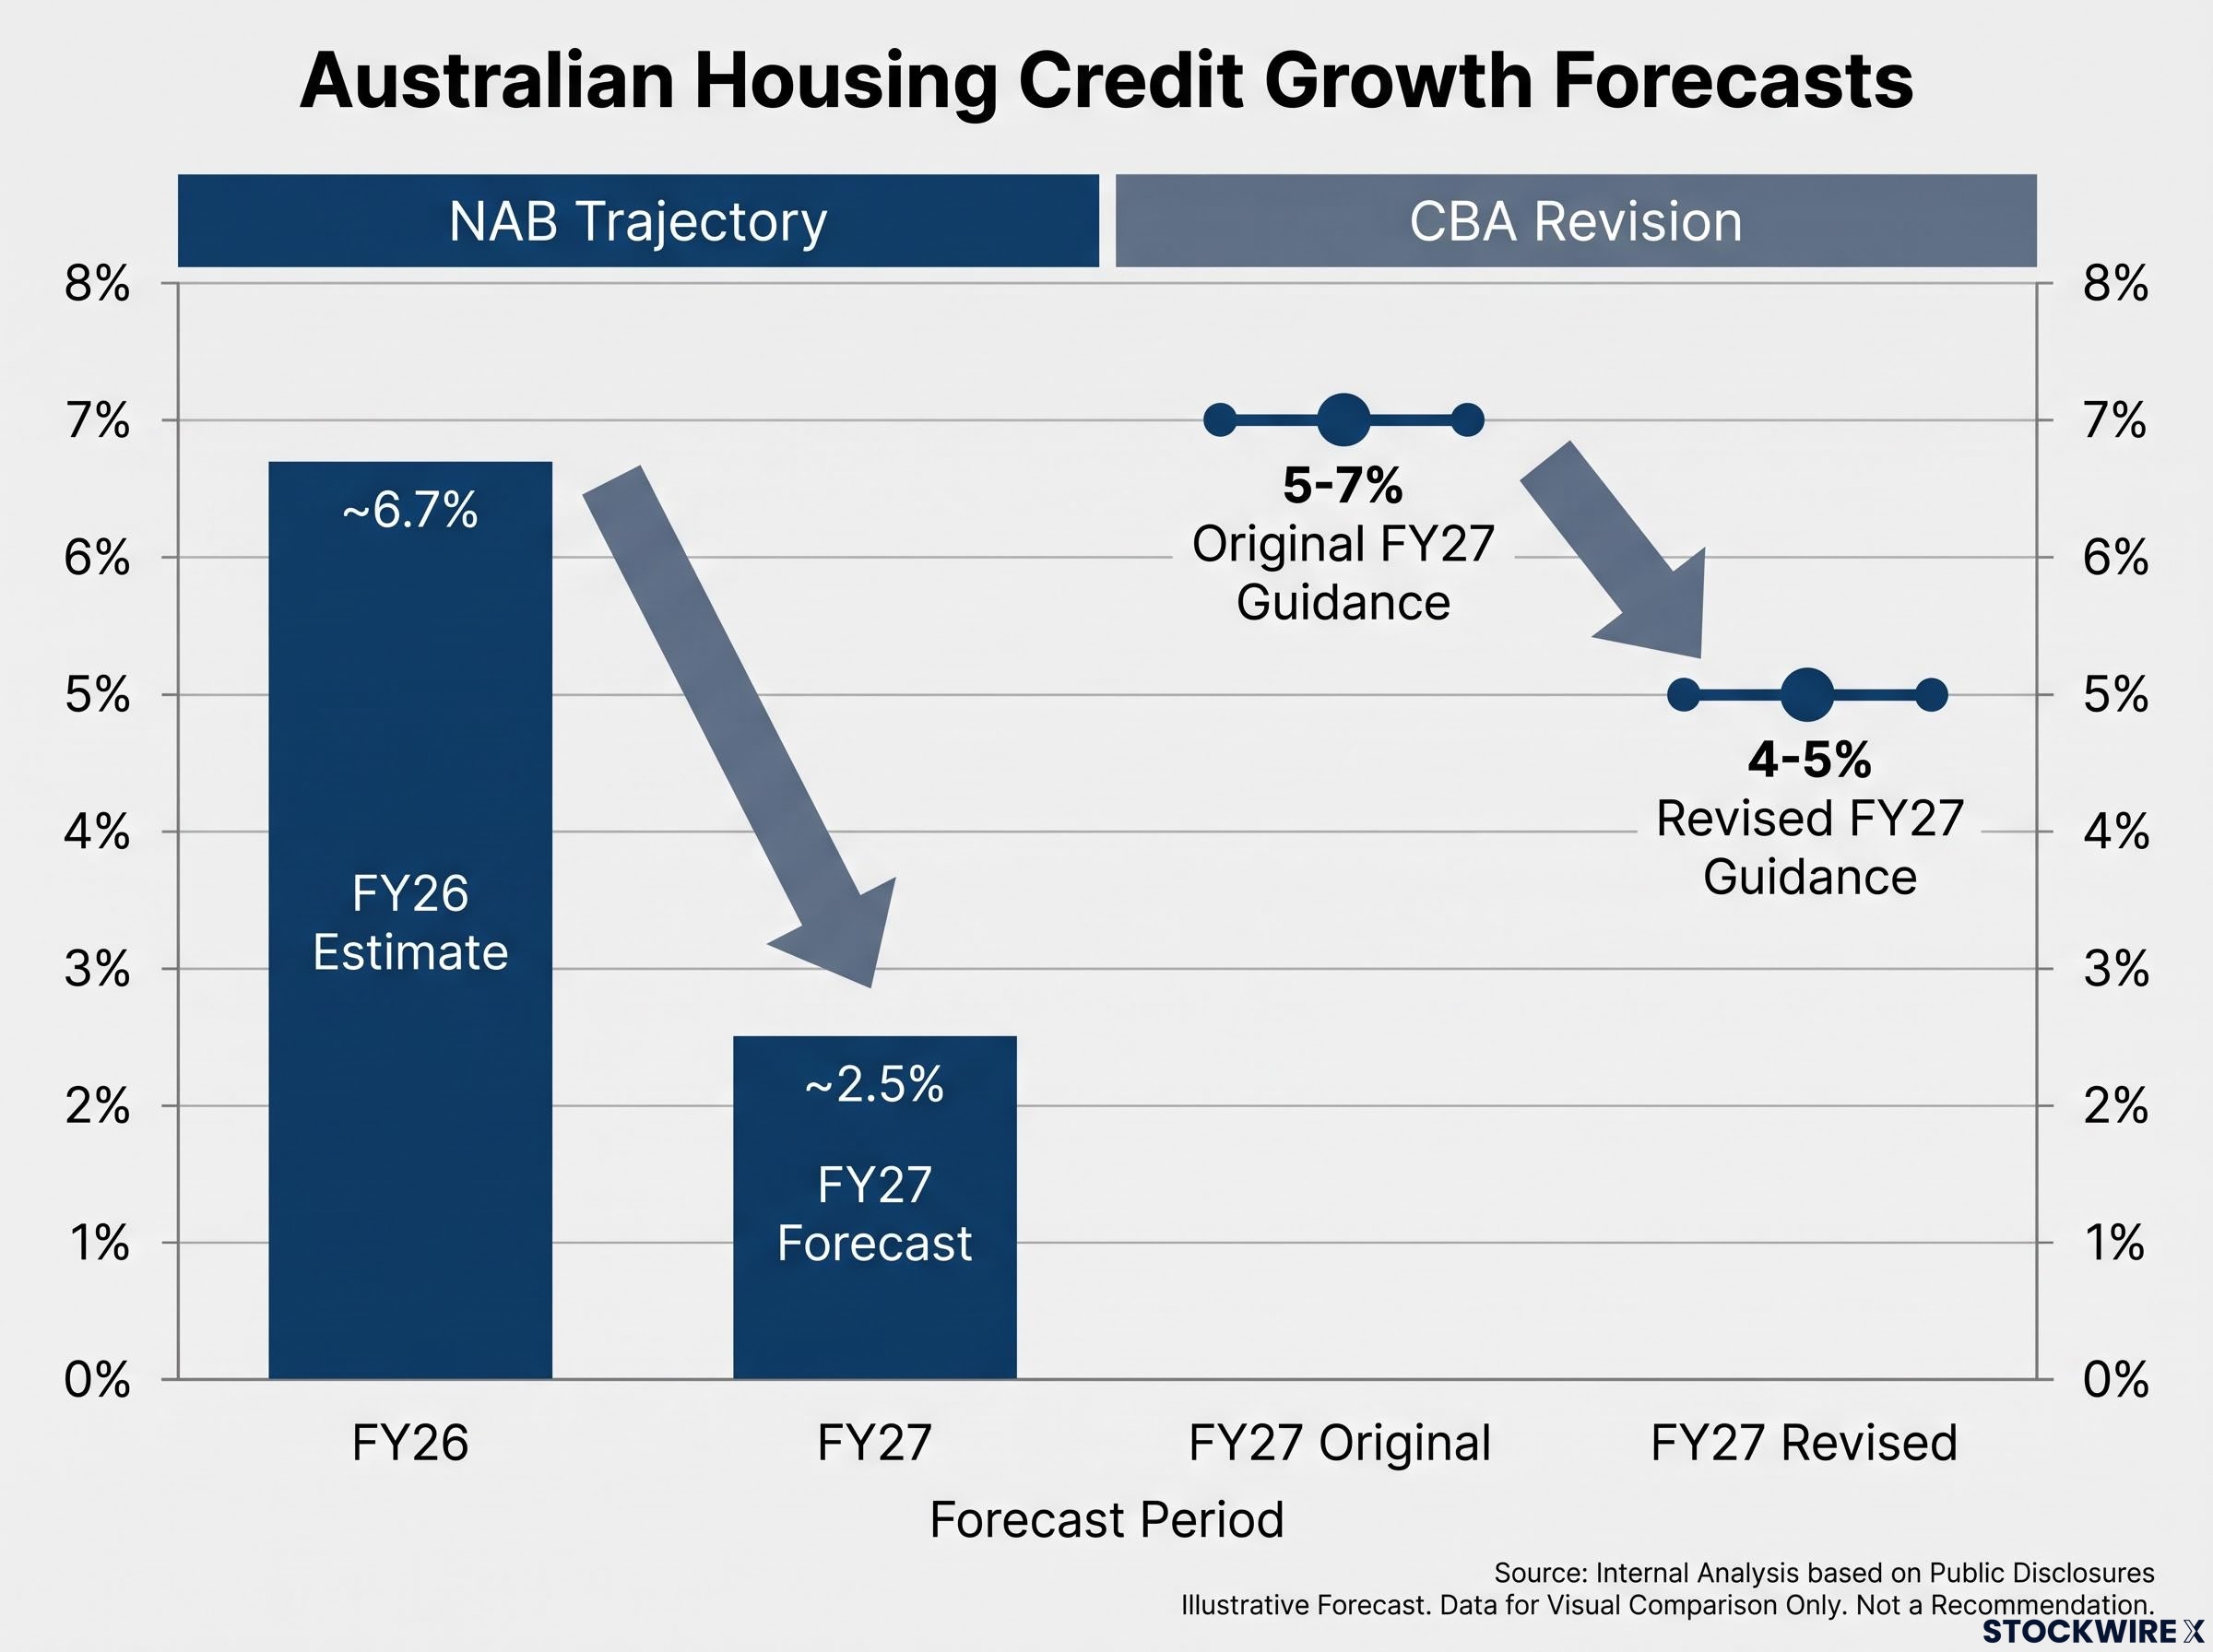
What stands out is that NAB‘s caution is concentrated in housing, not spread across the credit book. The bank’s outlook for business credit points to a gradual easing, from around 10.5% in FY26 to around 7% in FY27, which reads as a managed slowdown rather than anything more abrupt.
| Metric | NAB FY26 estimate | NAB FY27 forecast | CBA FY27 guidance (revised) |
|---|---|---|---|
| Housing credit growth | ~6.7% | 2.5% | ~4-5% |
| Business credit growth | ~10.5% | ~7% | Not specified |
If you are still anchored to CBA‘s original 5-7% figure, you are working with an outdated assumption. The consensus is moving in one direction.
When big ASX news breaks, our subscribers know first
Why NAB’s application pipeline is the most important data point in this story
Forecasts are views. Application volumes are data already in the system.
NAB‘s quarterly disclosures showed Australian home-loan applications dropping around 15% against the prior quarter in the June period and around 16% against the same quarter a year earlier. Comparable double-digit declines in application volumes were evident across the other major Australian banks reporting in the same period.
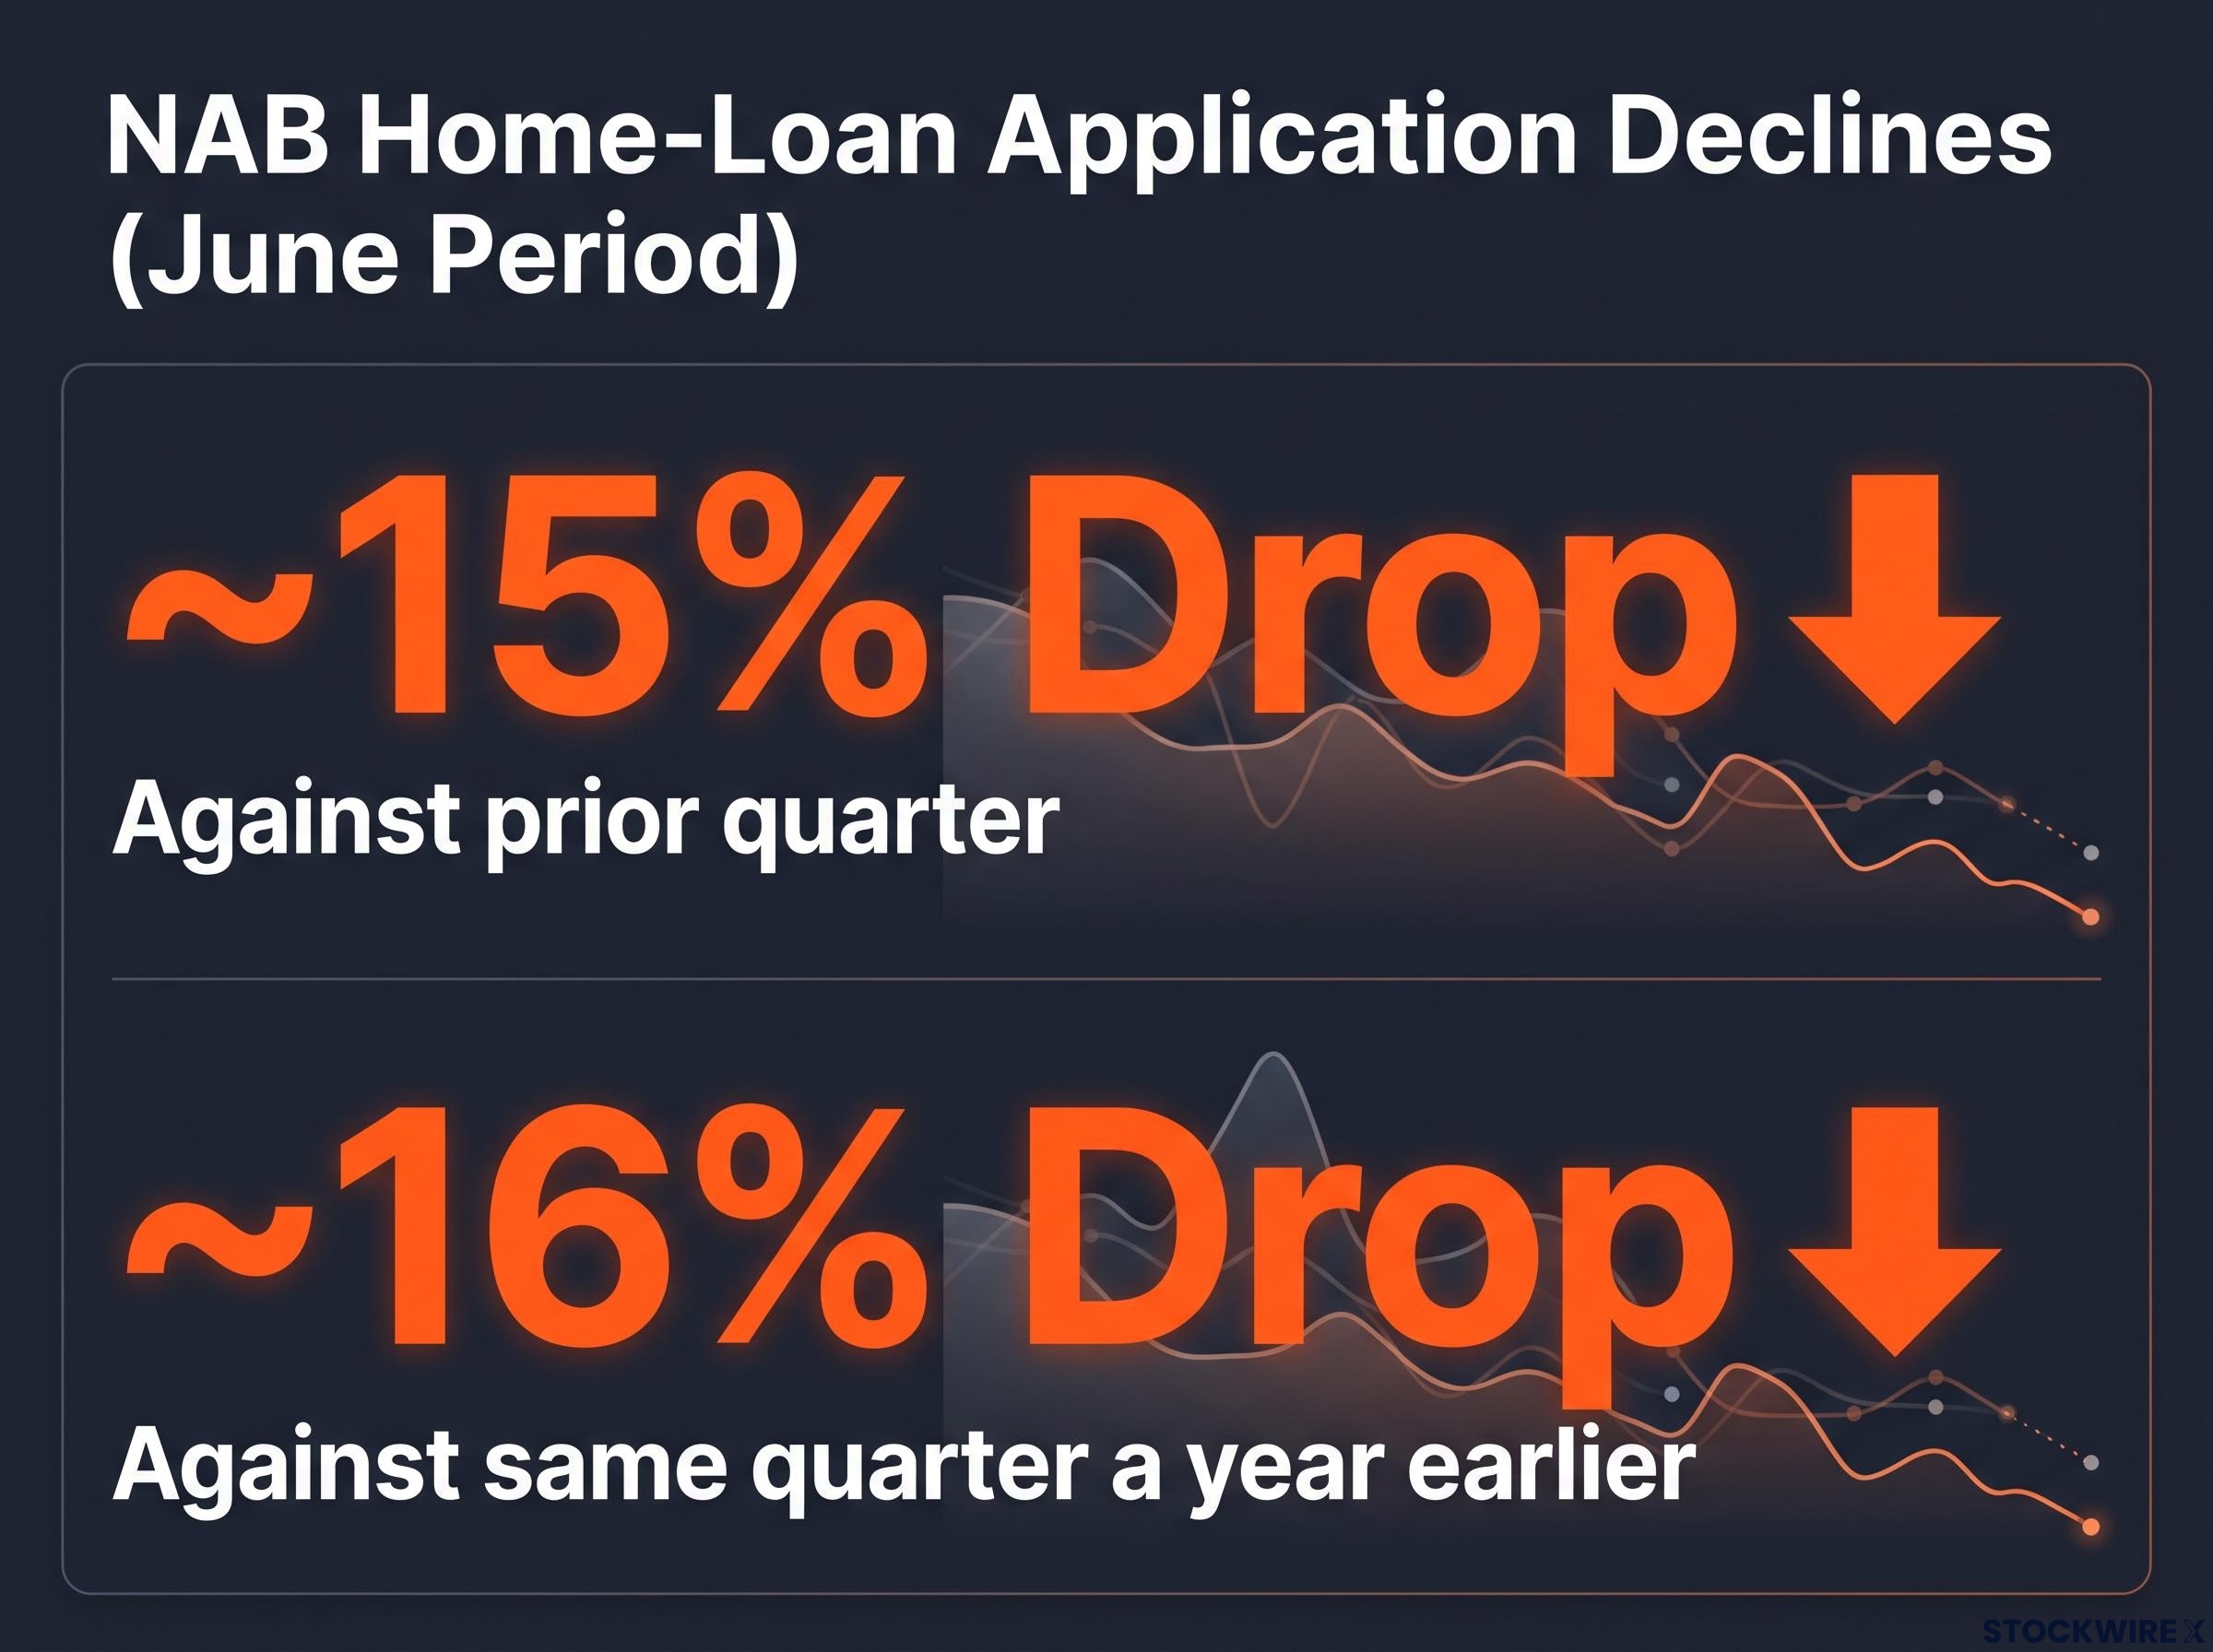
NAB CEO Andrew Irvine communicated these trends to the market, and the system-wide confirmation from rival lenders tells you this is not a NAB-specific problem. It is a read on the entire Australian housing demand pipeline.
Application data matters because it is a leading indicator, not a coincident one. The mechanics work in three stages:
- Application to settlement lag: New mortgage applications take weeks to months to convert to settled loans, meaning current application volumes forecast future settlement volumes.
- Settlement volumes drive credit stock growth: System-wide housing credit grows when new settlements exceed paydowns; a sharp fall in applications compresses future net growth.
- Momentum effects on refinance pipelines: Weaker application volumes reduce competitive refinance activity, which further dampens the credit growth rate.
A 15-16% fall in application volumes is not a soft signal. It is the kind of pipeline deterioration that makes a 2.5% FY27 housing credit forecast look like a rational response to observable data rather than institutional conservatism. If similar declines persist through Q4 FY26, the case for any outcome above the midpoint of the 3-5% consensus range weakens substantially.
What is driving the gap between the two banks’ views
The divergence is not a simple forecasting disagreement. It reflects different model inputs and different portfolio incentives. Understanding why the gap exists is more useful than knowing that it exists.
Macro assumptions and rate sensitivity
- NAB‘s economic scenarios embed slower GDP growth, a modest rise in unemployment, and lower house-price growth, all of which feed through to more conservative borrowing-capacity assumptions.
- CBA‘s base case still assumes enough resilience in employment, immigration, and household income to support mid-single-digit mortgage growth.
- Rate sensitivity of borrowing capacity is where these assumptions diverge most sharply: NAB‘s scenarios produce a lower ceiling on what borrowers can service, while CBA‘s assumptions allow for a higher one.
Portfolio incentives and credit quality signals
- CBA holds Australia’s largest mortgage franchise. That structural concentration creates a different incentive when communicating guidance: signalling confidence in housing credit supports the market’s perception of CBA‘s core revenue stream.
- NAB‘s more diversified credit book, with its deliberate tilt toward business lending, gives it less need to defend a bullish housing narrative.
- Emerging deterioration in performing loan quality within NAB‘s business book, alongside provisions being built ahead of potential stress, suggests the bank is preparing for a more difficult macro environment than its rivals are publicly acknowledging. When a bank starts seeing deterioration in the segment that has been its primary volume driver, it tends to adopt a more conservative cross-cycle stance across the board.
CBA’s credit quality signals were already deteriorating before the current guidance revision: Q3 2026 arrears rose across every major lending category, personal loan arrears spiked 30 basis points in a single quarter, and a $200 million collective provision top-up confirmed the bank’s own risk team was positioning for worsening conditions.
The divergence, then, is not about one bank being cautious and the other being confident. It reflects the fact that NAB and CBA have different structural exposures to the housing cycle, giving them different incentive structures when calibrating their public guidance. That distinction tells you something about whose forecast is more likely to be an honest near-term read versus a signal designed to maintain market confidence in a core revenue stream.
What the forecast gap means for the broader mortgage sector
With CBA revised to approximately 4-5% and NAB at 2.5%, the plausible FY27 system housing credit range has shifted to roughly 3-5%.
The earlier bullish scenario, where housing credit stayed at 5-7%, has been displaced. The new analytical anchor is a 3-5% range, and both banks’ updated guidance now sits within it.
For anyone assessing the Australian mortgage sector, three concrete implications flow from this narrowed range:
- Volume support for earnings is weaker than consensus assumed. Mortgage-heavy earnings models built on 5%+ housing credit growth need to be re-baselined. The volume tailwind that supported FY26 bank results is fading.
- Margin and competition pressure intensifies. Slower system credit growth means banks compete harder for every new origination and refinance, discounting more aggressively on prime mortgage cohorts and compressing front-book margins and fee income.
- Differential earnings exposure between banks. If FY27 housing credit lands at the NAB floor of 2.5-3%, CBA faces greater downside surprise risk given its mortgage concentration. NAB has partially de-risked by leaning on business credit, though that book carries its own emerging stress signals.
Morgan Stanley’s housing downgrade placed CBA last in its post-revision bank preference order precisely because of that mortgage concentration, forecasting housing credit decelerating from approximately 7.5% toward the same 3-4% range that the NAB-CBA divergence now brackets.
The question for investors in bank equities or mortgage-linked securities is not which forecast is right. It is whether current valuations have priced in the downside scenario where credit growth lands at the low end of the 3-5% range.
How to read Australian housing credit data as the FY27 cycle plays out
Rather than waiting for bank earnings releases to interpret what has already happened, you can track three leading indicators that will determine whether the FY27 outcome lands closer to NAB‘s 2.5% floor or CBA‘s revised 4-5% ceiling:
- Mortgage application volumes offer the highest-frequency leading signal, preceding ABS credit aggregates by several months. The 15-16% quarterly decline NAB disclosed is the benchmark to watch for stabilisation or further deterioration.
- ABS housing-finance commitments (Australian Bureau of Statistics data on new housing loan commitments) provide a system-wide settlement pipeline indicator at monthly frequency.
- RBA credit aggregates (Reserve Bank of Australia monthly credit data) confirm the actual credit stock growth with a lag, closing the loop between application data and realised outcomes.
The ABS housing-finance commitments data provides monthly figures on new loan volumes across owner-occupier and investor segments, giving a system-wide settlement pipeline read that sits several months ahead of the realised credit stock numbers reported in RBA aggregates.
| Indicator | Data source | Publication cadence | What to watch for |
|---|---|---|---|
| Mortgage application volumes | Bank quarterly disclosures | Quarterly | Stabilisation or continued double-digit declines |
| ABS housing-finance commitments | Australian Bureau of Statistics | Monthly | New commitment volumes versus 12-month average |
| RBA credit aggregates | Reserve Bank of Australia | Monthly | Housing credit growth rate trend (annualised) |
As a cross-check, business credit stress signals provide an independent read on whether the macro deterioration NAB is modelling is materialising. Stage 2 loans (where credit risk has increased materially since origination) and Stage 3 loans (where a default event has occurred or is probable) are the specific line items to monitor in bank disclosures. Rising migration from Stage 1 to Stage 2 would confirm that NAB‘s conservative assumptions are being borne out in practice.
Investors who track these indicators through late 2026 will have a materially better read on FY27 housing credit outcomes than those waiting for bank earnings releases to tell them what happened.
Positioning when the two largest banks are reading the same market differently
The right response to this forecast divergence is not to pick a winner between NAB and CBA. It is to stress-test portfolio exposures against the full 2.5-5% range that both banks’ updated guidance now defines.
- 2-3% housing credit growth: Volume support materially absent. Mortgage-heavy bank earnings face downside surprise risk. Competitive discounting erodes margins further. This is the scenario NAB‘s pipeline data most directly supports.
- 3-4% housing credit growth: A middling outcome where volume growth barely exceeds paydowns. Banks with diversified credit books outperform. Front-book margin pressure remains elevated but manageable.
- 4-5% housing credit growth: The upper bound of the revised consensus. Still below what CBA originally guided. Volume remains a modest contributor to earnings but does not provide the tailwind FY26 delivered.
CBA‘s downward revision from 5-7% to approximately 4-5% is the analytically significant event. The optimistic bank moved toward the pessimist, not the reverse. That directional signal carries weight independently of the precise number either bank settles on.
When differentiating between bank exposures, three variables matter most: portfolio mix (housing versus business concentration), margin management discipline under competitive pressure, and demonstrated credit-quality track record as origination volumes slow. These are the metrics that separate banks whose earnings can absorb a low-growth housing credit environment from those whose valuations are built on a scenario that has already been revised away.
NIM and bad-debt signals will carry more analytical weight than headline profit figures in August reporting season, with broker models projecting most results within 1-2% of consensus and forward guidance on margin trajectory the variable most likely to drive re-ratings across the sector.
When two institutional forecasters with full access to system-level data diverge this materially, it is a reliable signal that the outcome is path-dependent and that single-scenario positioning carries genuine risk.
Investors wanting to stress-test the macro deterioration scenario NAB is modelling against real-economy data will find our full explainer on Australia’s recession risk indicators, which covers the consumer sentiment collapse to 80.6, the June dwelling price decline, and what CBA’s own GDP forecast implies for the severity of the housing credit slowdown.
This article is for informational purposes only and should not be considered financial advice. Investors should conduct their own research and consult with financial professionals before making investment decisions. Past performance does not guarantee future results. Financial projections are subject to market conditions and various risk factors.