The Australian dollar regularly moves 1-2 per cent in a single session on data releases from a country thousands of kilometres away. That fact alone signals something unusual about this currency, something that separates it from most developed-market peers before you even understand the mechanics.
The AUD is shaped by at least five distinct forces operating simultaneously: Reserve Bank of Australia (RBA) policy, iron ore prices, Chinese economic conditions, global risk sentiment, and the trade balance. Reading any one of these in isolation produces systematically incomplete conclusions about where the currency is heading. The interaction between them is where the real explanatory power sits.
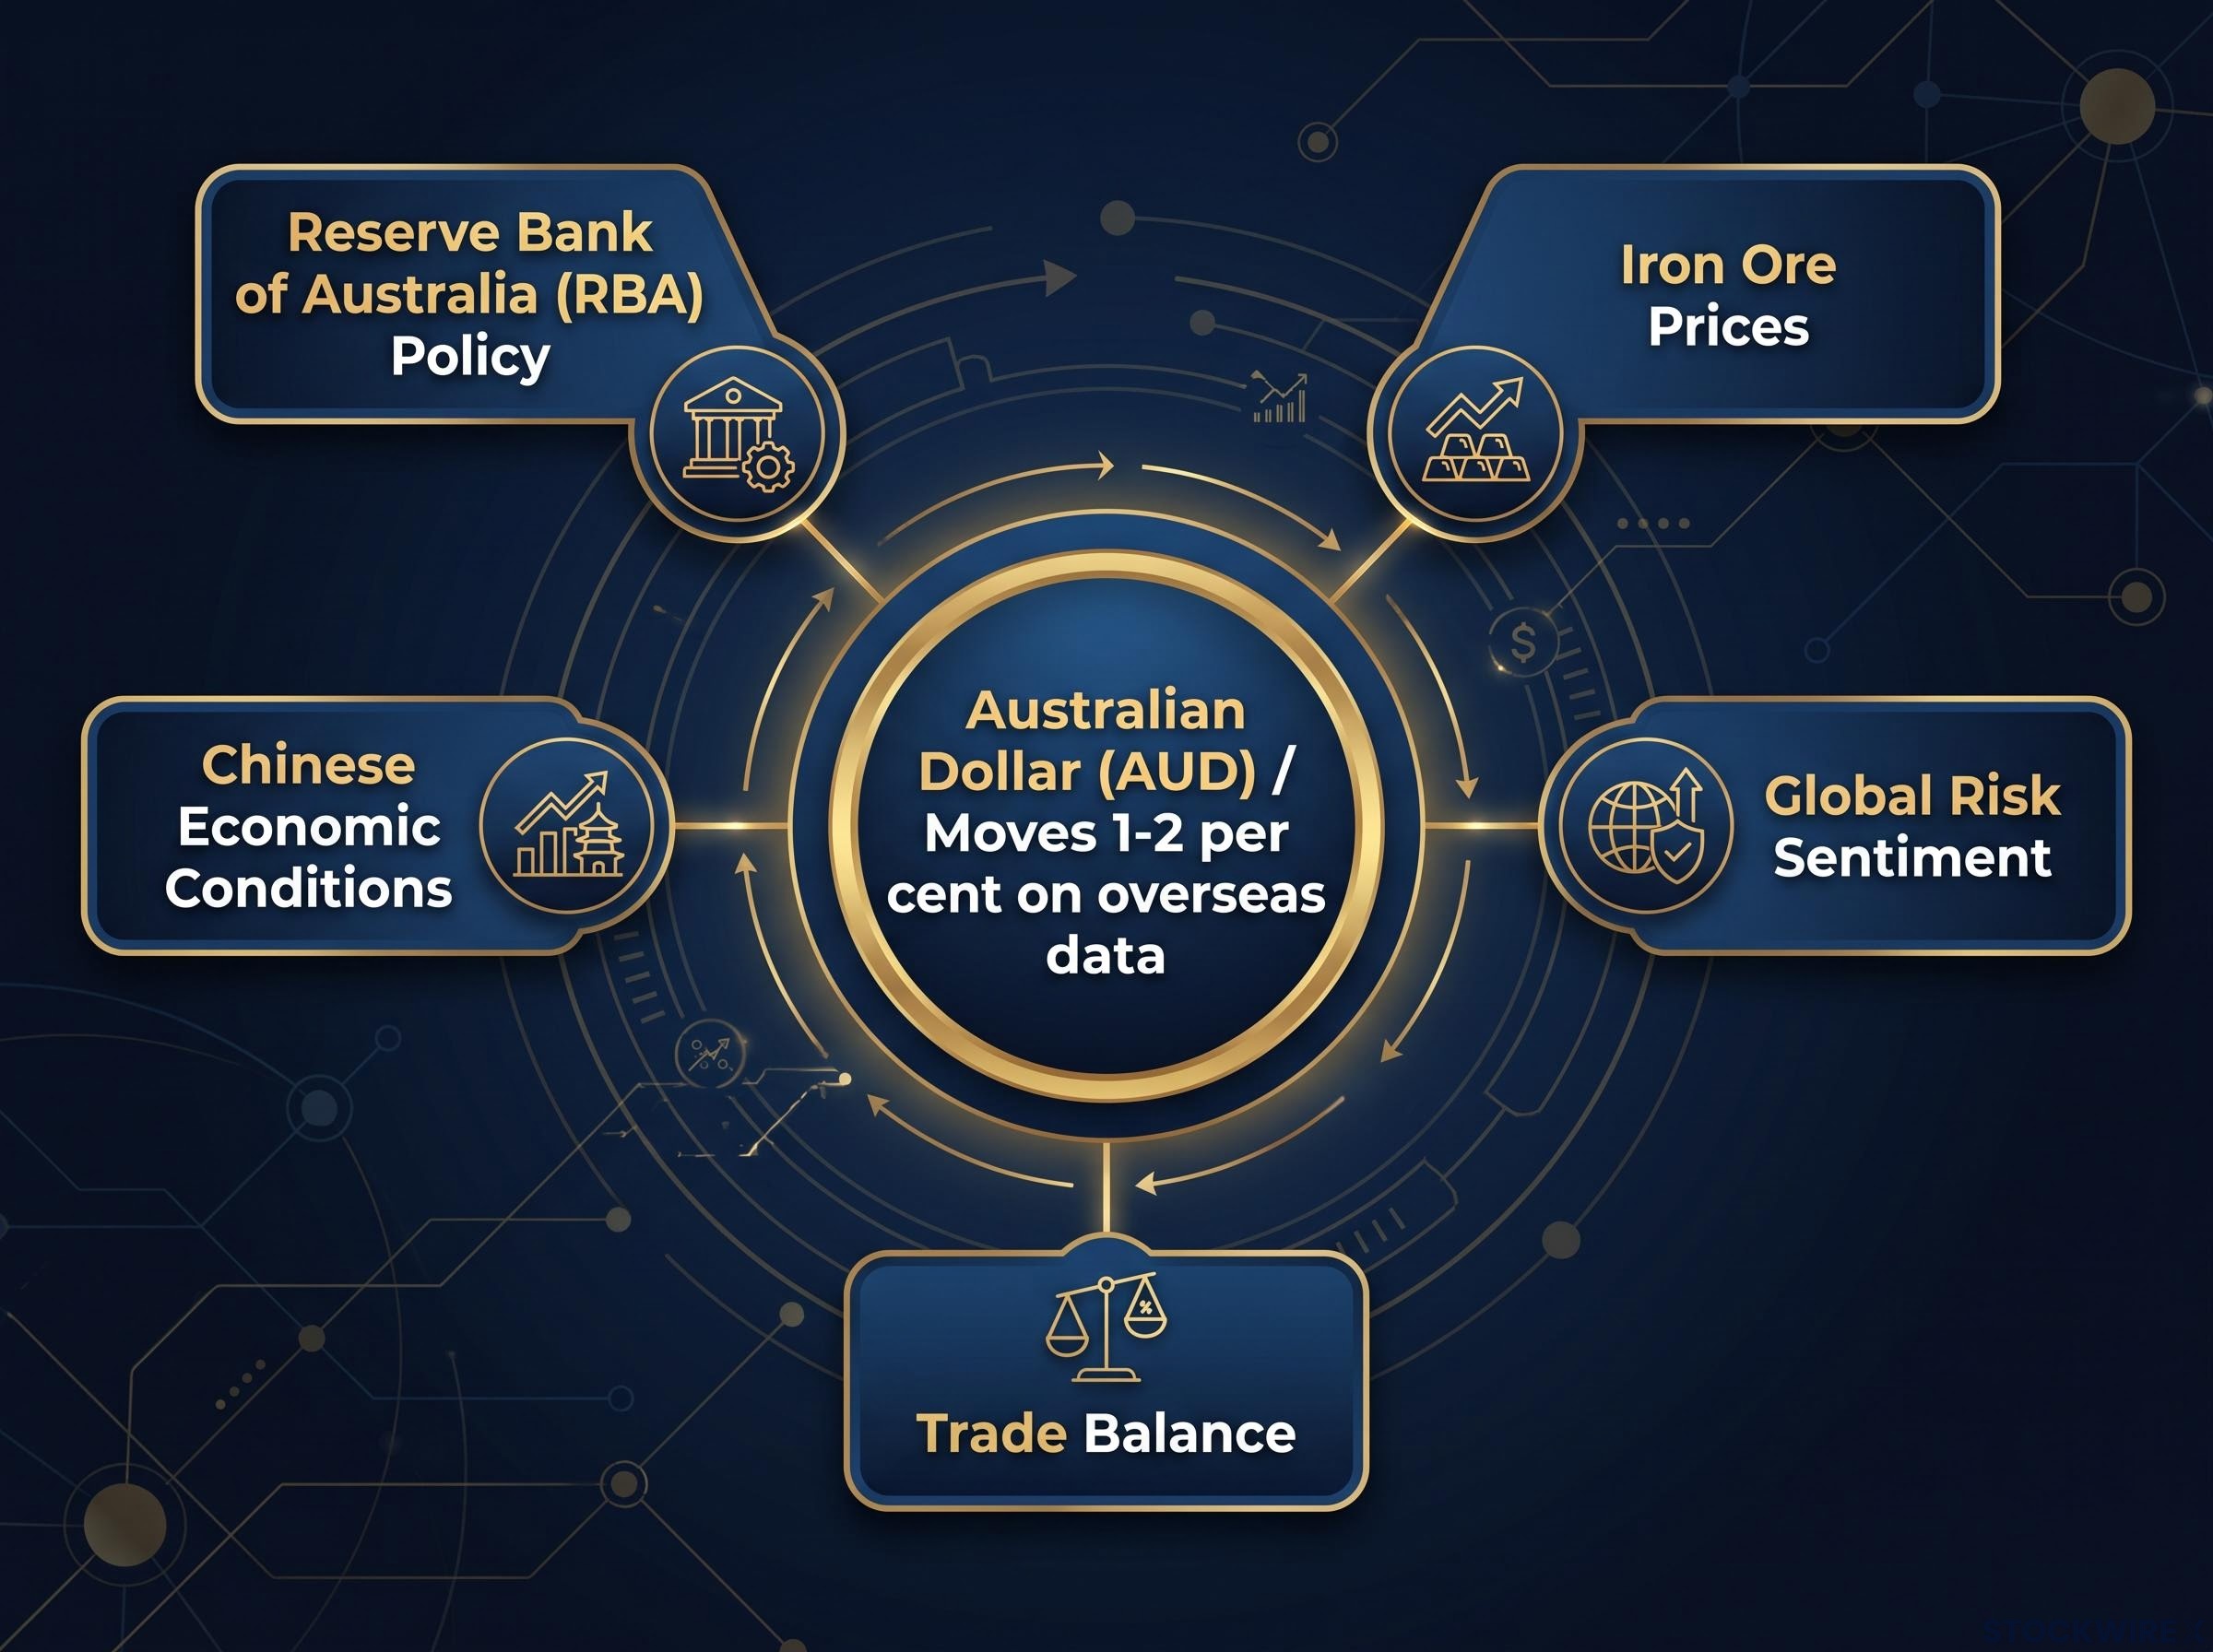
Here is the working framework for each of those forces, how they connect, and what you should actually be watching when the AUD moves and you want to understand why.
The RBA’s role: how interest rate policy shapes AUD demand
When a central bank raises interest rates, assets denominated in that currency become more attractive to global capital. Bonds pay more. Money-market instruments offer higher yields. Investors who want access to those returns must buy the currency first, creating direct demand. That is the mechanism, and it works the same way regardless of which central bank is involved.
For the AUD, this mechanism operates through two distinct channels:
- The cash rate level relative to peer central banks. When Australia’s rate sits above the US Federal Reserve, the European Central Bank, or the Bank of Japan, the yield differential draws capital into AUD-denominated assets. When the gap narrows, the incentive weakens and capital flows elsewhere.
- Forward guidance and market expectations. Markets often react more to what the RBA signals about the future rate path than to the current rate itself. A single phrase in a post-meeting statement, or a shift in tone from a senior official’s speech, can move bond yields and FX positioning before any policy change actually occurs.
RBA forward guidance operates through bond markets before any policy change occurs, with the 2-3 year Australian bond yield functioning as the most reliable real-time signal of whether the RBA’s hawkish or dovish message has actually landed with institutional investors.
The distinction between hawkish and dovish communication matters here. Hawkish language, where the RBA emphasises inflation concern and signals readiness to tighten, is generally AUD-positive. Dovish language, where growth risks dominate and openness to rate cuts enters the conversation, is AUD-negative. Beyond the cash rate, quantitative easing (where the central bank buys bonds to inject liquidity) tends to weigh on the AUD, while quantitative tightening (reducing the balance sheet) supports it.
RBA monetary policy decisions, published after each board meeting, are the primary source for tracking shifts in the cash rate target and the official language the board uses to characterise inflation and growth conditions, both of which directly shape AUD positioning.
Societe Generale analysts noted that the RBA’s latest policy communications carried a markedly hawkish tone, with the message reinforcing that policymakers remain prepared to respond to persistent inflation pressures.
What the current RBA stance means for the currency
As of mid-August 2026, the RBA cash rate sits at 4.35 per cent, with inflation remaining above the 2-3 per cent target band. RBA Assistant Governor Christopher Kent has signalled that the full effects of tighter monetary policy on economic activity are still working their way through the system, while RBA Governor Michele Bullock has made clear the central bank stands ready to move again should the situation demand it.
That is an explicitly hawkish posture. Comparatively elevated rates versus peer central banks provide structural support for the AUD, contingent on that stance holding. If you track currency direction, any shift in RBA tone toward dovishness is a meaningful signal to watch, not merely a footnote in macroeconomic coverage.
When big ASX news breaks, our subscribers know first
Iron ore and why one commodity can move a whole currency
Most developed-market currencies are not hostage to a single commodity. The AUD is different, and the reason is scale.
Start with the chain of causation. When iron ore prices rise, Australian miners earn more per tonne shipped. That creates larger export receipts flowing back into Australia. Foreign buyers, predominantly Chinese steel mills and trading houses, need Australian dollars to settle those transactions. The sequence plays out like this:
- Iron ore prices rise.
- Export receipts increase in value.
- Australia’s trade surplus widens.
- More foreign currency is converted to AUD to settle transactions.
- AUD demand strengthens, and the exchange rate typically follows.
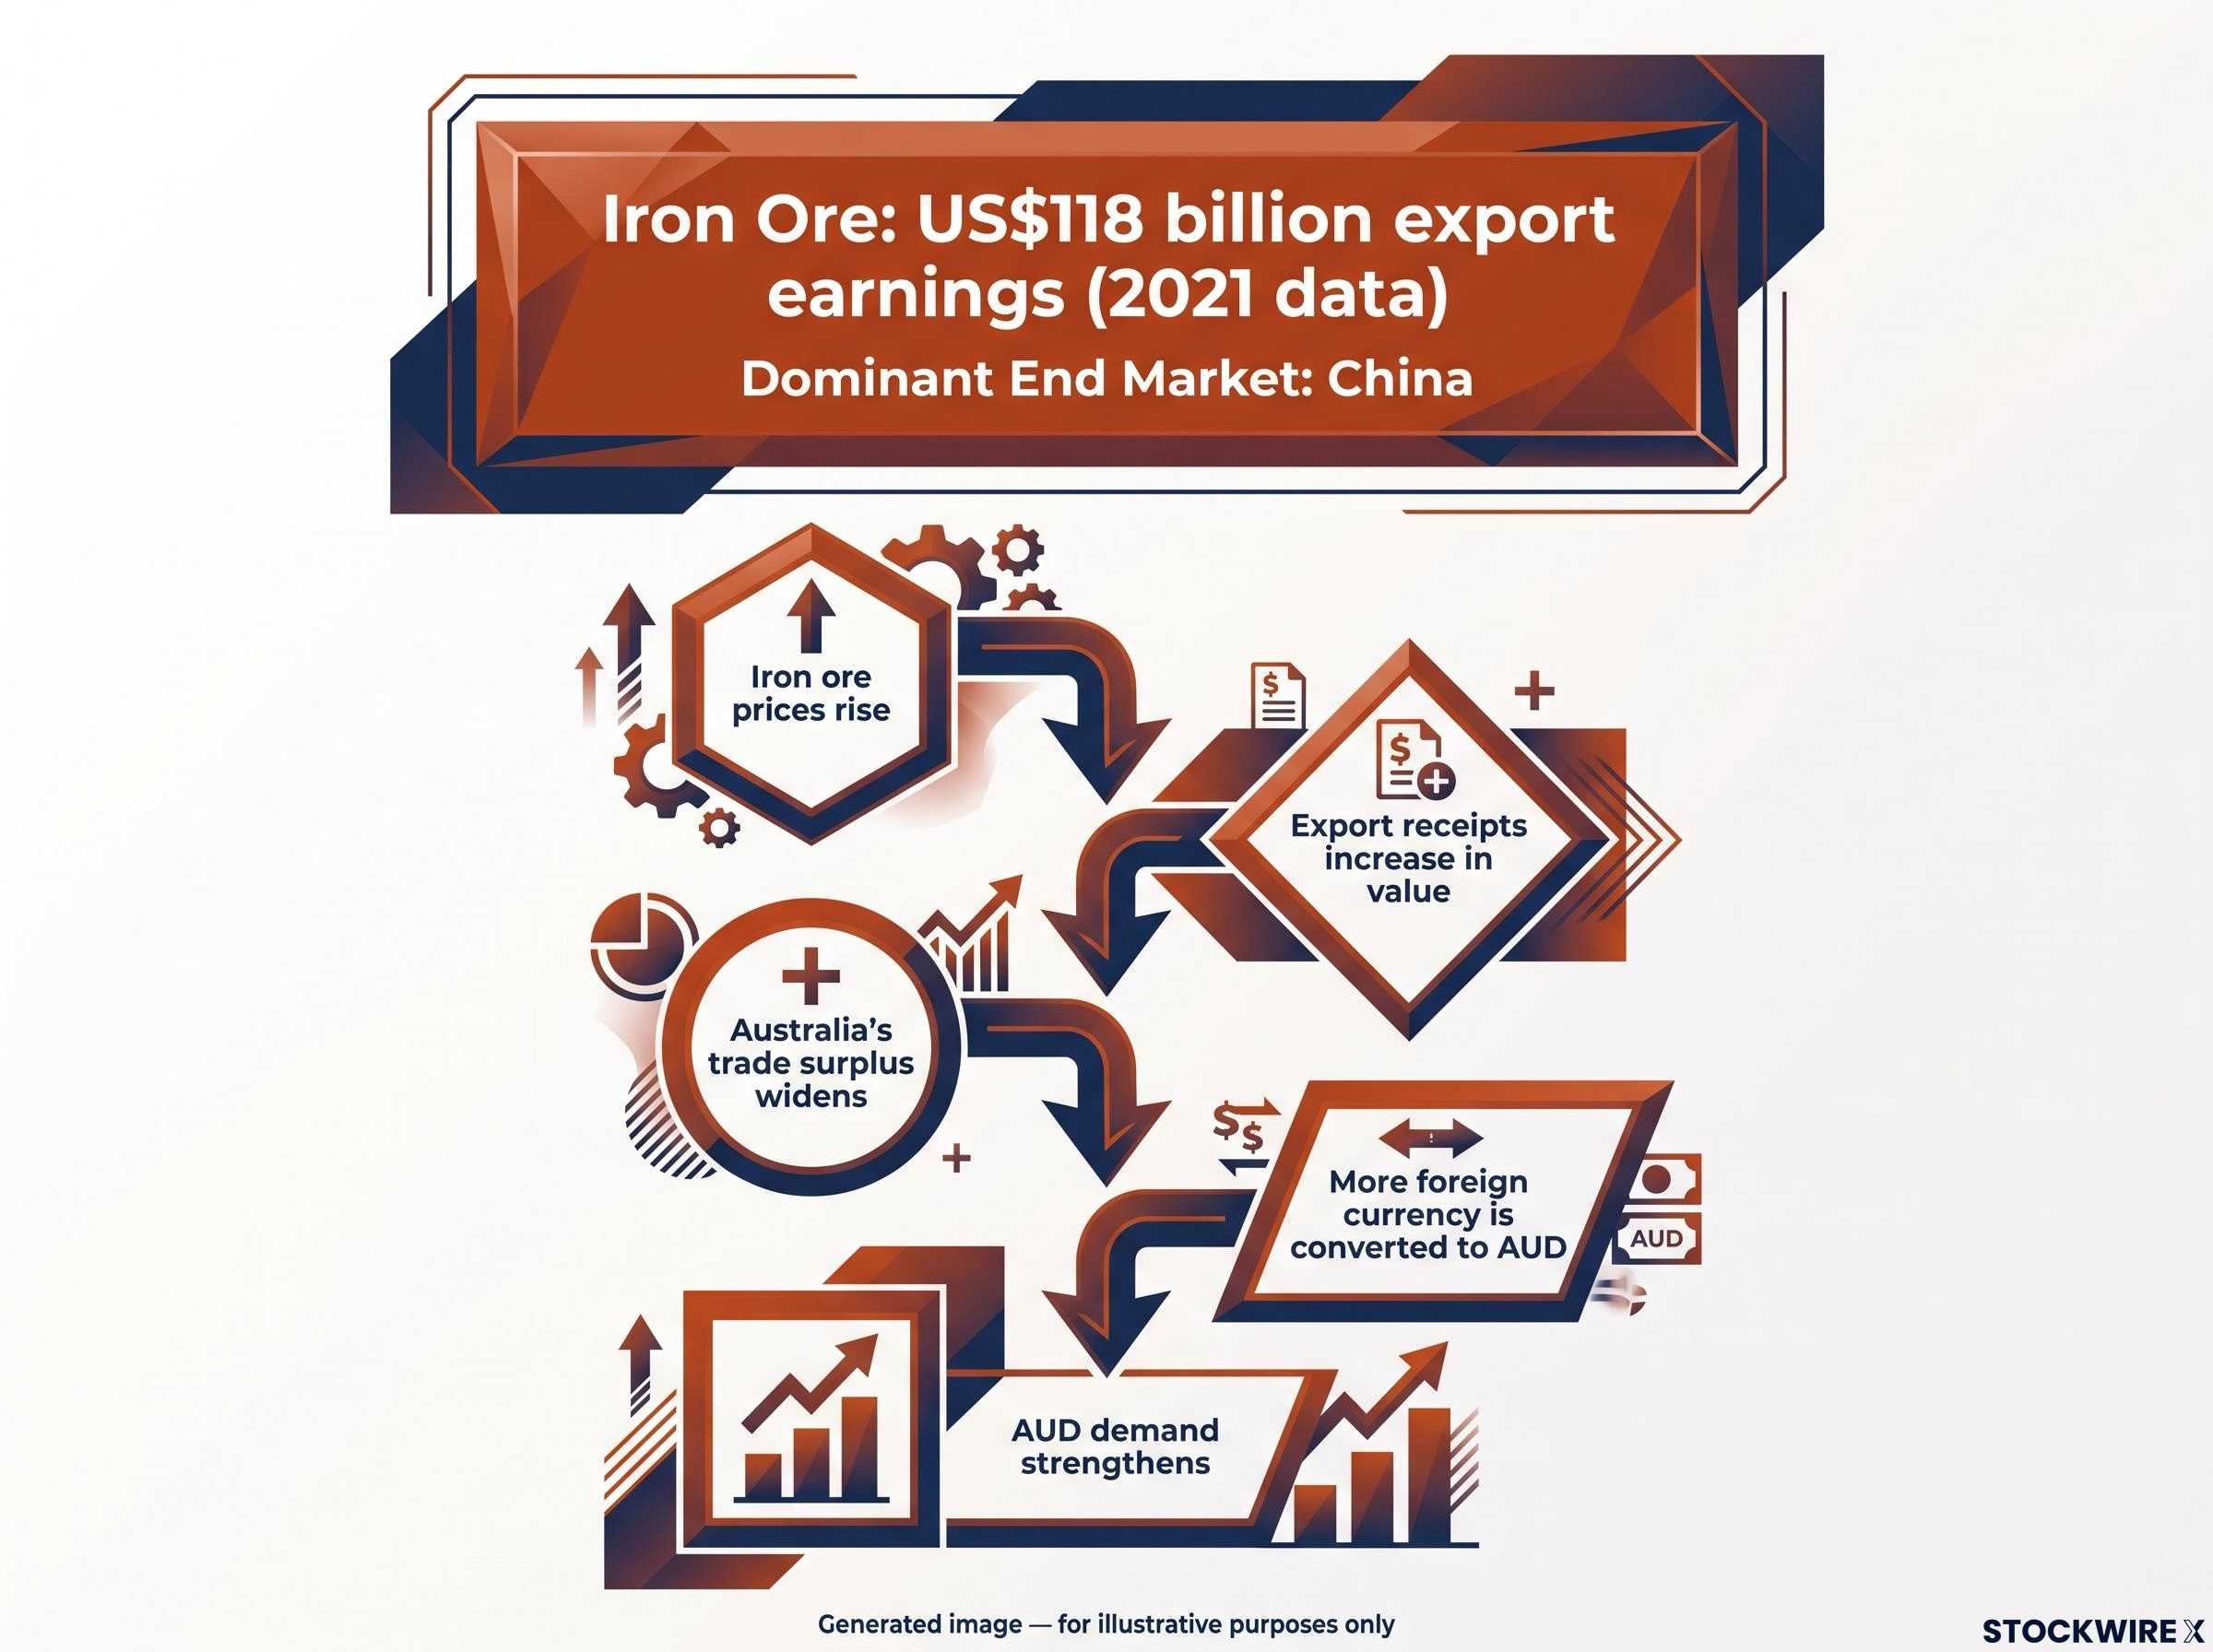
The numbers explain why this single commodity carries so much weight. According to 2021 data, iron ore contributed roughly US$118 billion per year to Australian export earnings, placing it comfortably at the top of the country’s export rankings. China absorbs the bulk of those shipments as the dominant end market.
| Iron Ore Price Direction | AUD Impact | Mechanism |
|---|---|---|
| Rising | Supportive | Larger export receipts widen the trade surplus and increase FX inflows into AUD |
| Falling | Negative | Compressed export receipts narrow the surplus and reduce FX demand for AUD |
Iron ore prices also carry a dual signal. They reflect global industrial activity, particularly Chinese construction and manufacturing demand. So when iron ore moves, it is telling you something about AUD inflows and about the broader growth outlook simultaneously. If you are tracking the AUD, iron ore is not just a mining metric; it is a real-time proxy for the currency inflows that underpin the AUD’s fundamental value.
China’s economy and why Australian dollar traders watch Beijing closely
The depth of the AUD-China relationship is what makes the Australian dollar behave differently from sterling, the euro, or the Canadian dollar under similar global conditions. China is Australia’s dominant bilateral trading partner across goods and services, and the concentration of that exposure is unusual among developed-market currencies.
That exposure transmits through three distinct channels:
- Goods trade. China is the primary buyer of Australian iron ore, coal, and liquefied natural gas (LNG). When Chinese industrial activity accelerates, demand for these inputs rises, supporting prices and AUD inflows. When it slows, the effect reverses.
- Services trade. Education and tourism from China represent significant foreign income sources. Shifts in Chinese household incomes, travel restrictions, or bilateral tensions can move the AUD via this channel independently of commodity prices.
- Chinese policy settings. Infrastructure stimulus and property-sector support lift steel and energy demand, benefiting Australian exports and the AUD. Deleveraging campaigns, regulatory crackdowns on construction, or deliberate diversification away from Australian suppliers can undermine both export volumes and currency sentiment.
China’s property sector is not a single risk factor for the AUD: the K-shaped divergence between a collapsing construction economy and a surging semiconductor export sector means aggregate Chinese GDP growth figures can be misleading about the actual demand trajectory for Australian iron ore and LNG.
Chinese data releases, including PMI, industrial output, credit data, and GDP, routinely trigger outsized AUD moves even when no Australian domestic data has changed.
That is the structural point worth emphasising. When Chinese PMI disappoints or property data weakens, the AUD typically reacts before any Australian domestic figure has moved. If you treat China as a leading indicator rather than a background factor, you will understand AUD moves that otherwise appear to have no local cause. The key releases to monitor are Chinese PMIs, industrial output, credit data, GDP, and any major policy announcements on infrastructure spending or property regulation.
Risk sentiment and the AUD’s pro-cyclical character
Here is the pattern: when global sharemarkets rise, the AUD tends to rise with them. When sharemarkets fall sharply, the AUD typically falls too. That correlation is not a coincidence. It reflects something structural about where the Australian dollar sits in the global currency hierarchy.
“Risk-on” and “risk-off” describe the prevailing appetite among global investors for growth-linked assets versus safe havens. In a risk-on environment, investors are comfortable holding currencies tied to commodity exports, global trade, and higher yields. In a risk-off environment, when recession fears spike, a banking crisis erupts, or geopolitical conflict escalates, capital rotates into safe-haven currencies: the US Dollar, Japanese Yen, and Swiss Franc.
The AUD sits firmly on the risk-sensitive side of that divide for two structural reasons. First, Australia is a small, open economy heavily exposed to global trade and commodity cycles, so its currency acts as a leveraged expression of global growth expectations. Second, historically higher Australian interest rates made the AUD popular in carry trades, and those positions unwind sharply when volatility spikes.
| Market Condition | AUD Typical Response | Key Indicators to Watch |
|---|---|---|
| Risk-On | AUD strengthens alongside equities and commodities | Rising equity indices, tight credit spreads, low VIX |
| Risk-Off | AUD weakens as flows rotate to USD, JPY, and CHF | Falling equities, widening credit spreads, elevated VIX |
For you as an Australian reader with exposure to AUD fluctuations, this has a practical consequence. The VIX (a widely followed volatility index) and US equity futures are often more useful early-warning indicators for AUD direction than most domestic Australian data releases. A falling AUD is not always a signal of Australian-specific weakness. It is frequently a global sentiment read that tells you more about investor fear than about anything happening in Australia.
Carry trades and why AUD falls faster than it rises in volatility spikes
A carry trade involves borrowing in a low-interest-rate currency, such as the Japanese yen, and investing the proceeds in a higher-yielding currency like the AUD. The trader earns the interest rate differential as profit while the exchange rate remains stable or moves in their favour.
The problem emerges when volatility spikes. Carry trades across the market unwind simultaneously as traders rush to close positions and repay borrowings. That creates concentrated selling pressure on the AUD that amplifies the downside beyond what the underlying news event appears to warrant.
This is a feature of the carry-trade structure, not a market overreaction. If you see the AUD falling faster and harder than the headlines seem to justify during a risk-off episode, carry-trade unwinding is very likely part of the explanation.
Risk-off AUD positioning unwinding in practice looked like this: the AUD/USD 98-pip drop across the Trump-Xi summit period showed how US inflation data, crude oil prices, and an unresolved trade truce combined to suppress the pair even when no Australian domestic data had shifted.
The trade balance: the structural floor beneath the AUD
The trade balance measures exports minus imports, but its significance for the AUD goes beyond accounting. It represents the net real-world demand for Australian dollars at any given time.
The directional logic is straightforward:
- Trade surplus: More foreign currency is being converted into AUD to buy Australian goods than AUD is being sold to fund imports. Net effect: AUD demand is supported.
- Trade deficit: The reverse, with more AUD being sold to purchase foreign goods. Net effect: AUD faces pressure.
Australia has generally run sizable trade surpluses over recent years, driven predominantly by resource exports: iron ore, coal, and LNG. The persistence of these surpluses helps explain something counterintuitive.
The trade surplus can keep the AUD fundamentally underpinned even during periods of domestic economic softness, so long as commodity prices and export volumes remain firm.
That structural support is why the AUD sometimes holds up better than domestic economic headlines would suggest. When iron ore prices are high and Chinese demand is firm, the surplus tends to widen, reinforcing AUD strength. When prices or demand weaken, the surplus narrows and the currency typically follows.
Monthly trade data functions as a confirmation mechanism rather than a primary driver. It validates or contradicts what iron ore prices and Chinese demand indicators are already suggesting. If you track the trade balance alongside commodity prices, you get a two-layer picture: the sentiment layer that drives daily moves, and the structural flow layer that determines whether those moves have lasting support or will reverse.
Reading the AUD when the signals conflict
Understanding each driver individually is the first step. The harder, more practical challenge is that these five forces routinely point in different directions simultaneously.
Consider a fully bullish scenario: the RBA maintains hawkish policy versus peers, strong Chinese growth pushes iron ore prices higher, global risk appetite is firm with active carry trades, and the trade surplus is widening. All five channels aligned. That produces sustained AUD appreciation.
Now consider the opposite: a Chinese slowdown compresses iron ore prices, a risk-off episode redirects flows to the US dollar and yen, the RBA pivots toward easing to support growth, and the trade surplus narrows as export receipts fall. Multiple headwinds compounding. The AUD can depreciate quickly and sharply under those conditions.
In practice, you rarely get full alignment. The RBA might be hawkish while China is slowing. Iron ore might be firm while a global risk-off episode is pulling capital into safe havens. The most common mistake in interpreting AUD moves is over-explaining them with a single driver. A conflicting signal you are not watching can be doing more work than the signal you are focused on.
Competing external headwinds can overwhelm even a supportive domestic rate differential: the AUD’s extended period near 0.7000 in mid-2026 showed how geopolitical risk and USD safe-haven demand suppress the currency even when the RBA’s cash rate sits above the Fed’s target range.
| Driver | Bullish AUD Signal | Bearish AUD Signal | Where to Monitor |
|---|---|---|---|
| RBA Policy | Hawkish tone, rates above peers | Dovish pivot, rate cuts signalled | RBA statements, minutes, speeches |
| Iron Ore and Commodities | Rising prices, strong export volumes | Falling prices, compressed margins | Spot iron ore price, miner guidance |
| China | Strong growth, infrastructure stimulus | Slowdown, deleveraging, supplier diversification | PMI, industrial output, credit data, GDP |
| Global Risk Sentiment | Risk-on, rising equities, low VIX | Risk-off, equity sell-off, elevated VIX | Equity indices, credit spreads, VIX |
| Trade Balance | Widening surplus, strong export receipts | Narrowing surplus, falling commodity revenues | Monthly ABS trade data, terms of trade |
The five-lens framework gives you a checklist for assessing net balance rather than overweighting whichever headline is loudest:
- RBA rate decisions, minutes, speeches, and inflation data relative to the 2-3 per cent target.
- Iron ore and key commodity prices, plus earnings guidance from major miners.
- Chinese macro releases (PMIs, industrial output, credit data, GDP) and policy announcements.
- Global risk sentiment via equity indices, credit spreads, and the VIX.
- Australian trade balance, current account data, and terms-of-trade trends.
Five variables, one currency: building your AUD monitoring framework
The AUD is not difficult to understand. It requires holding five lenses simultaneously rather than relying on a single leading indicator, and that is what makes it different from currencies driven predominantly by one factor.
Return to the opening observation: the AUD moving 1-2 per cent on overseas data. With the full framework, you can now identify the forces responsible. Global risk sentiment and the China channel explain why data releases from thousands of kilometres away regularly move the Australian dollar before any domestic figure has shifted.
The specific balance of these five forces will shift over time as Chinese growth cycles, global risk appetite ebbs and flows, and the RBA adjusts policy in response to domestic conditions. The framework itself, however, remains stable. The drivers do not change. Their relative weight does.
This article is for informational purposes only and should not be considered financial advice. Investors should conduct their own research and consult with financial professionals before making investment decisions.