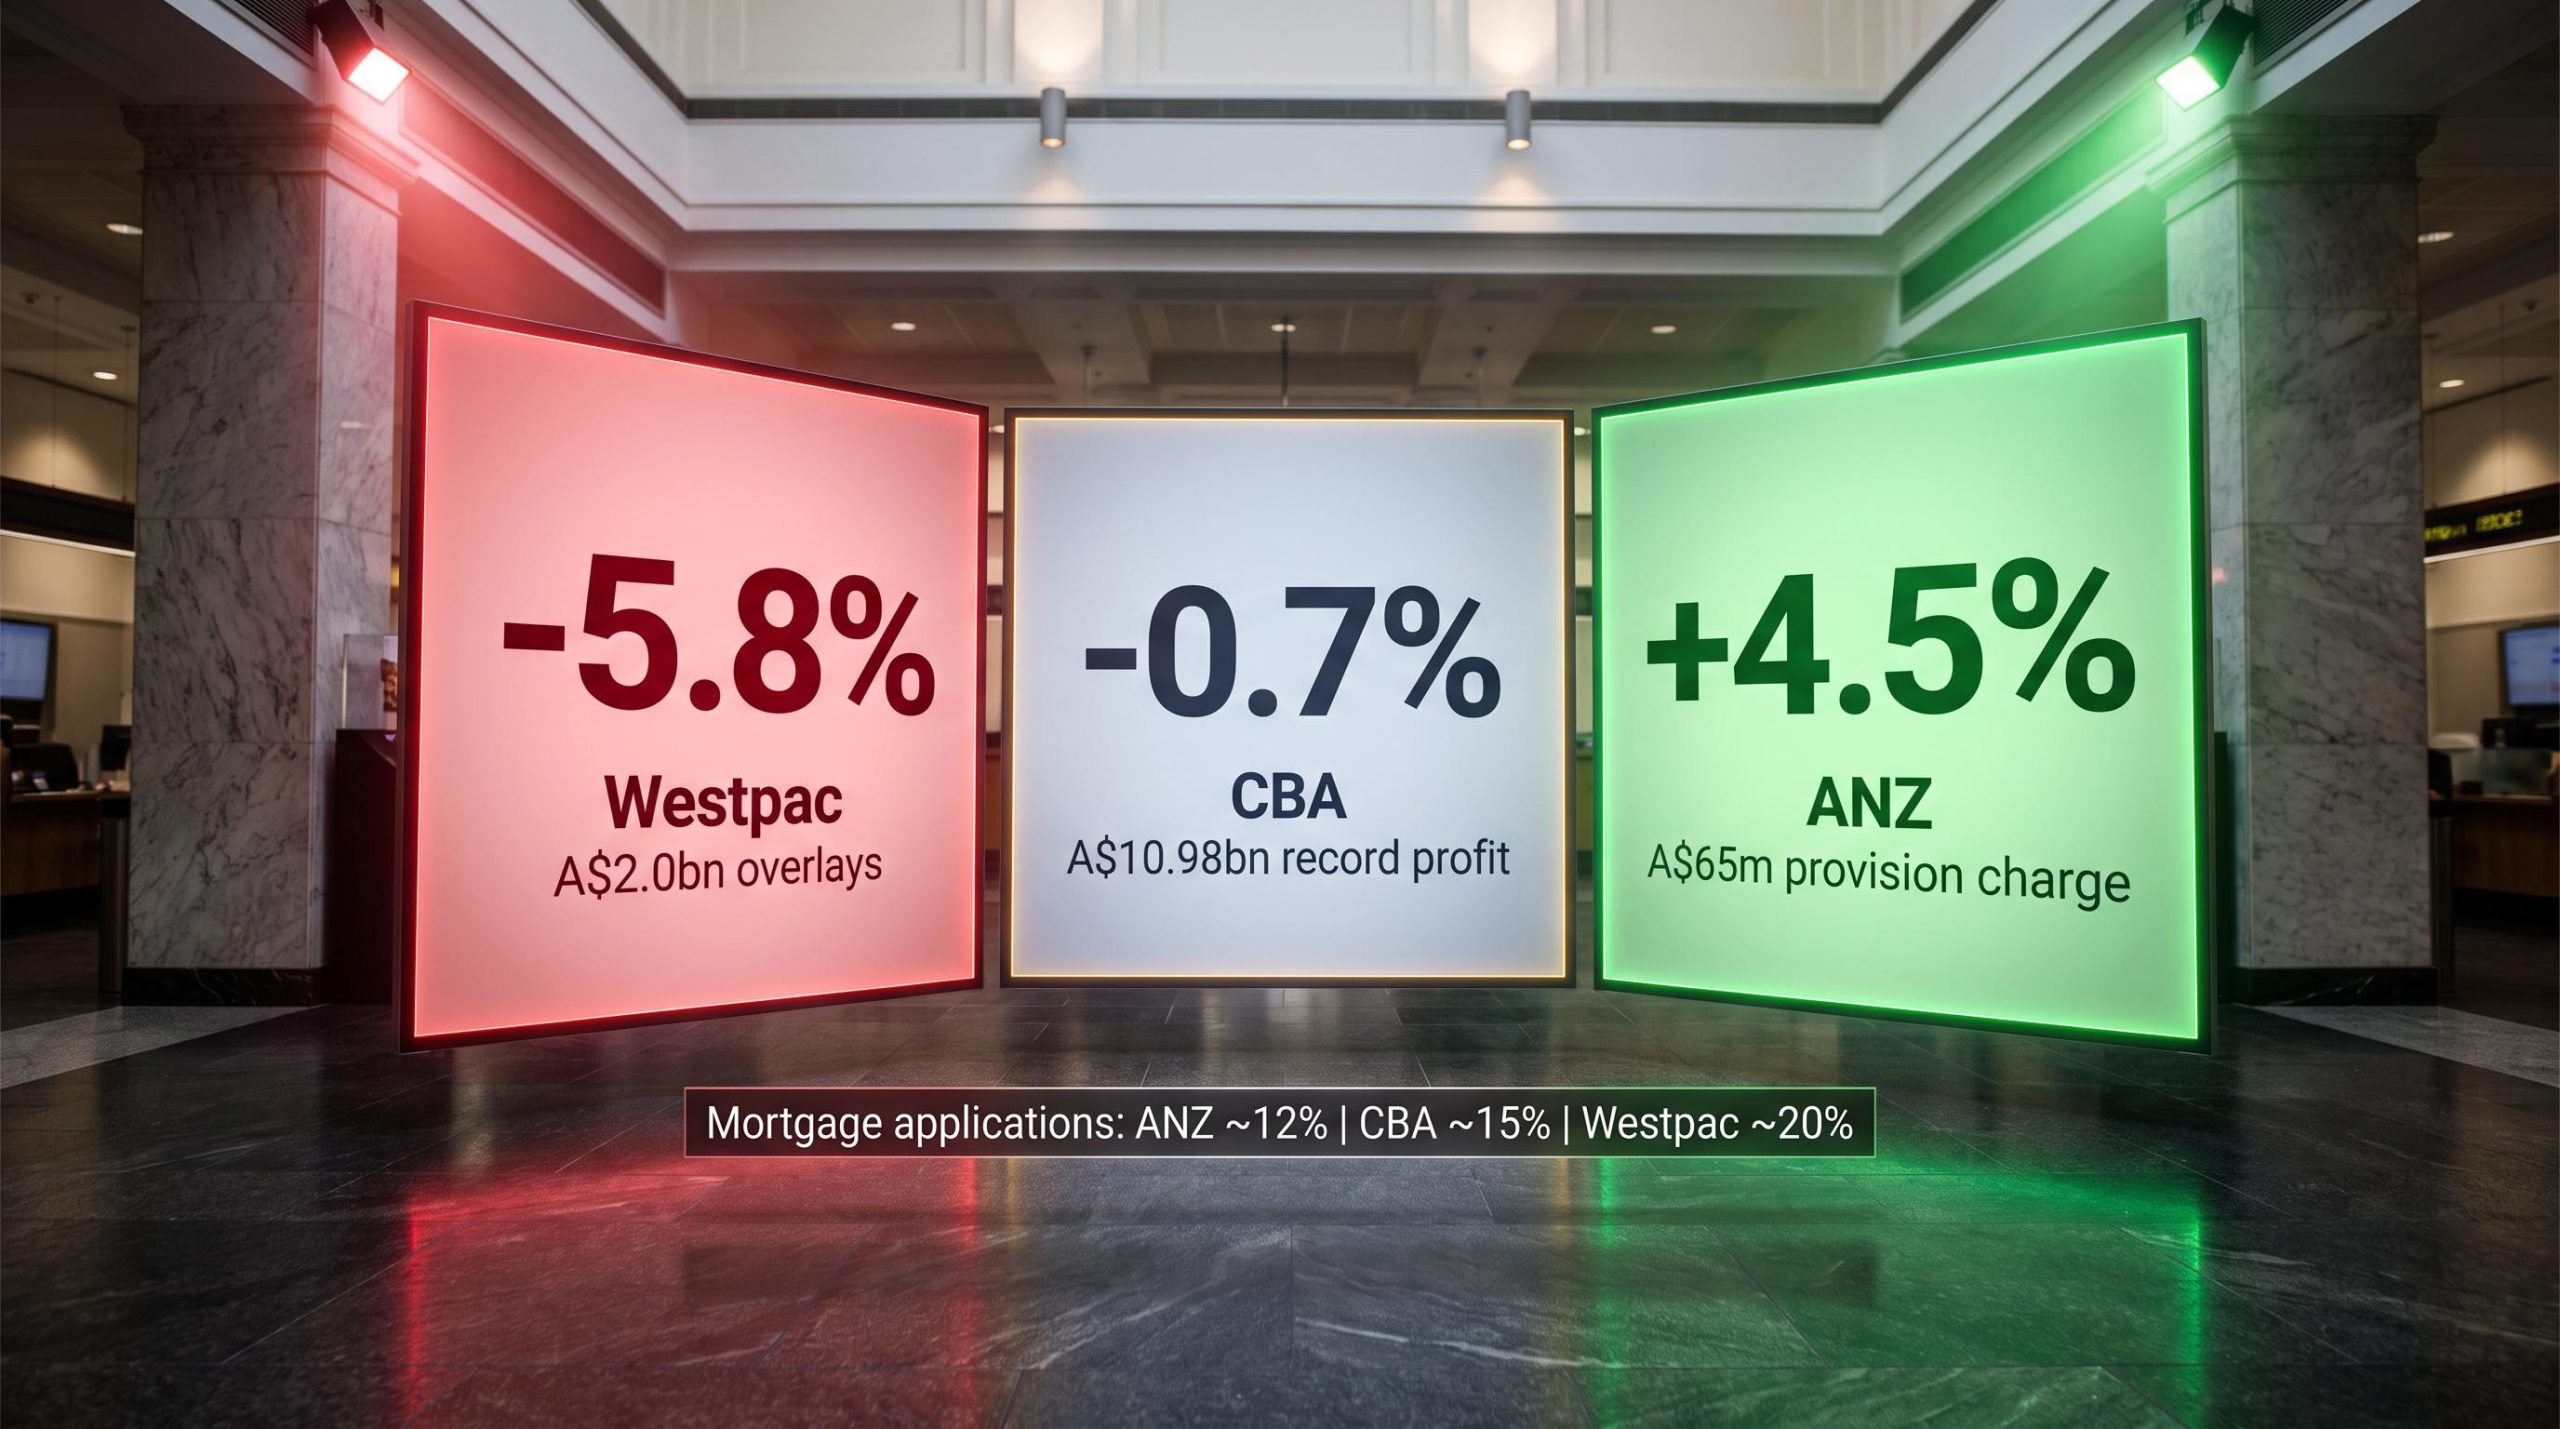
Mortgage application volumes just posted their worst post-budget decline on record across all three major banks. Yet in the same week that Westpac shares fell 5.8% and CBA dipped 0.7%, ANZ rose 4.5%. Same macro headwinds, same reporting window, opposite outcomes.
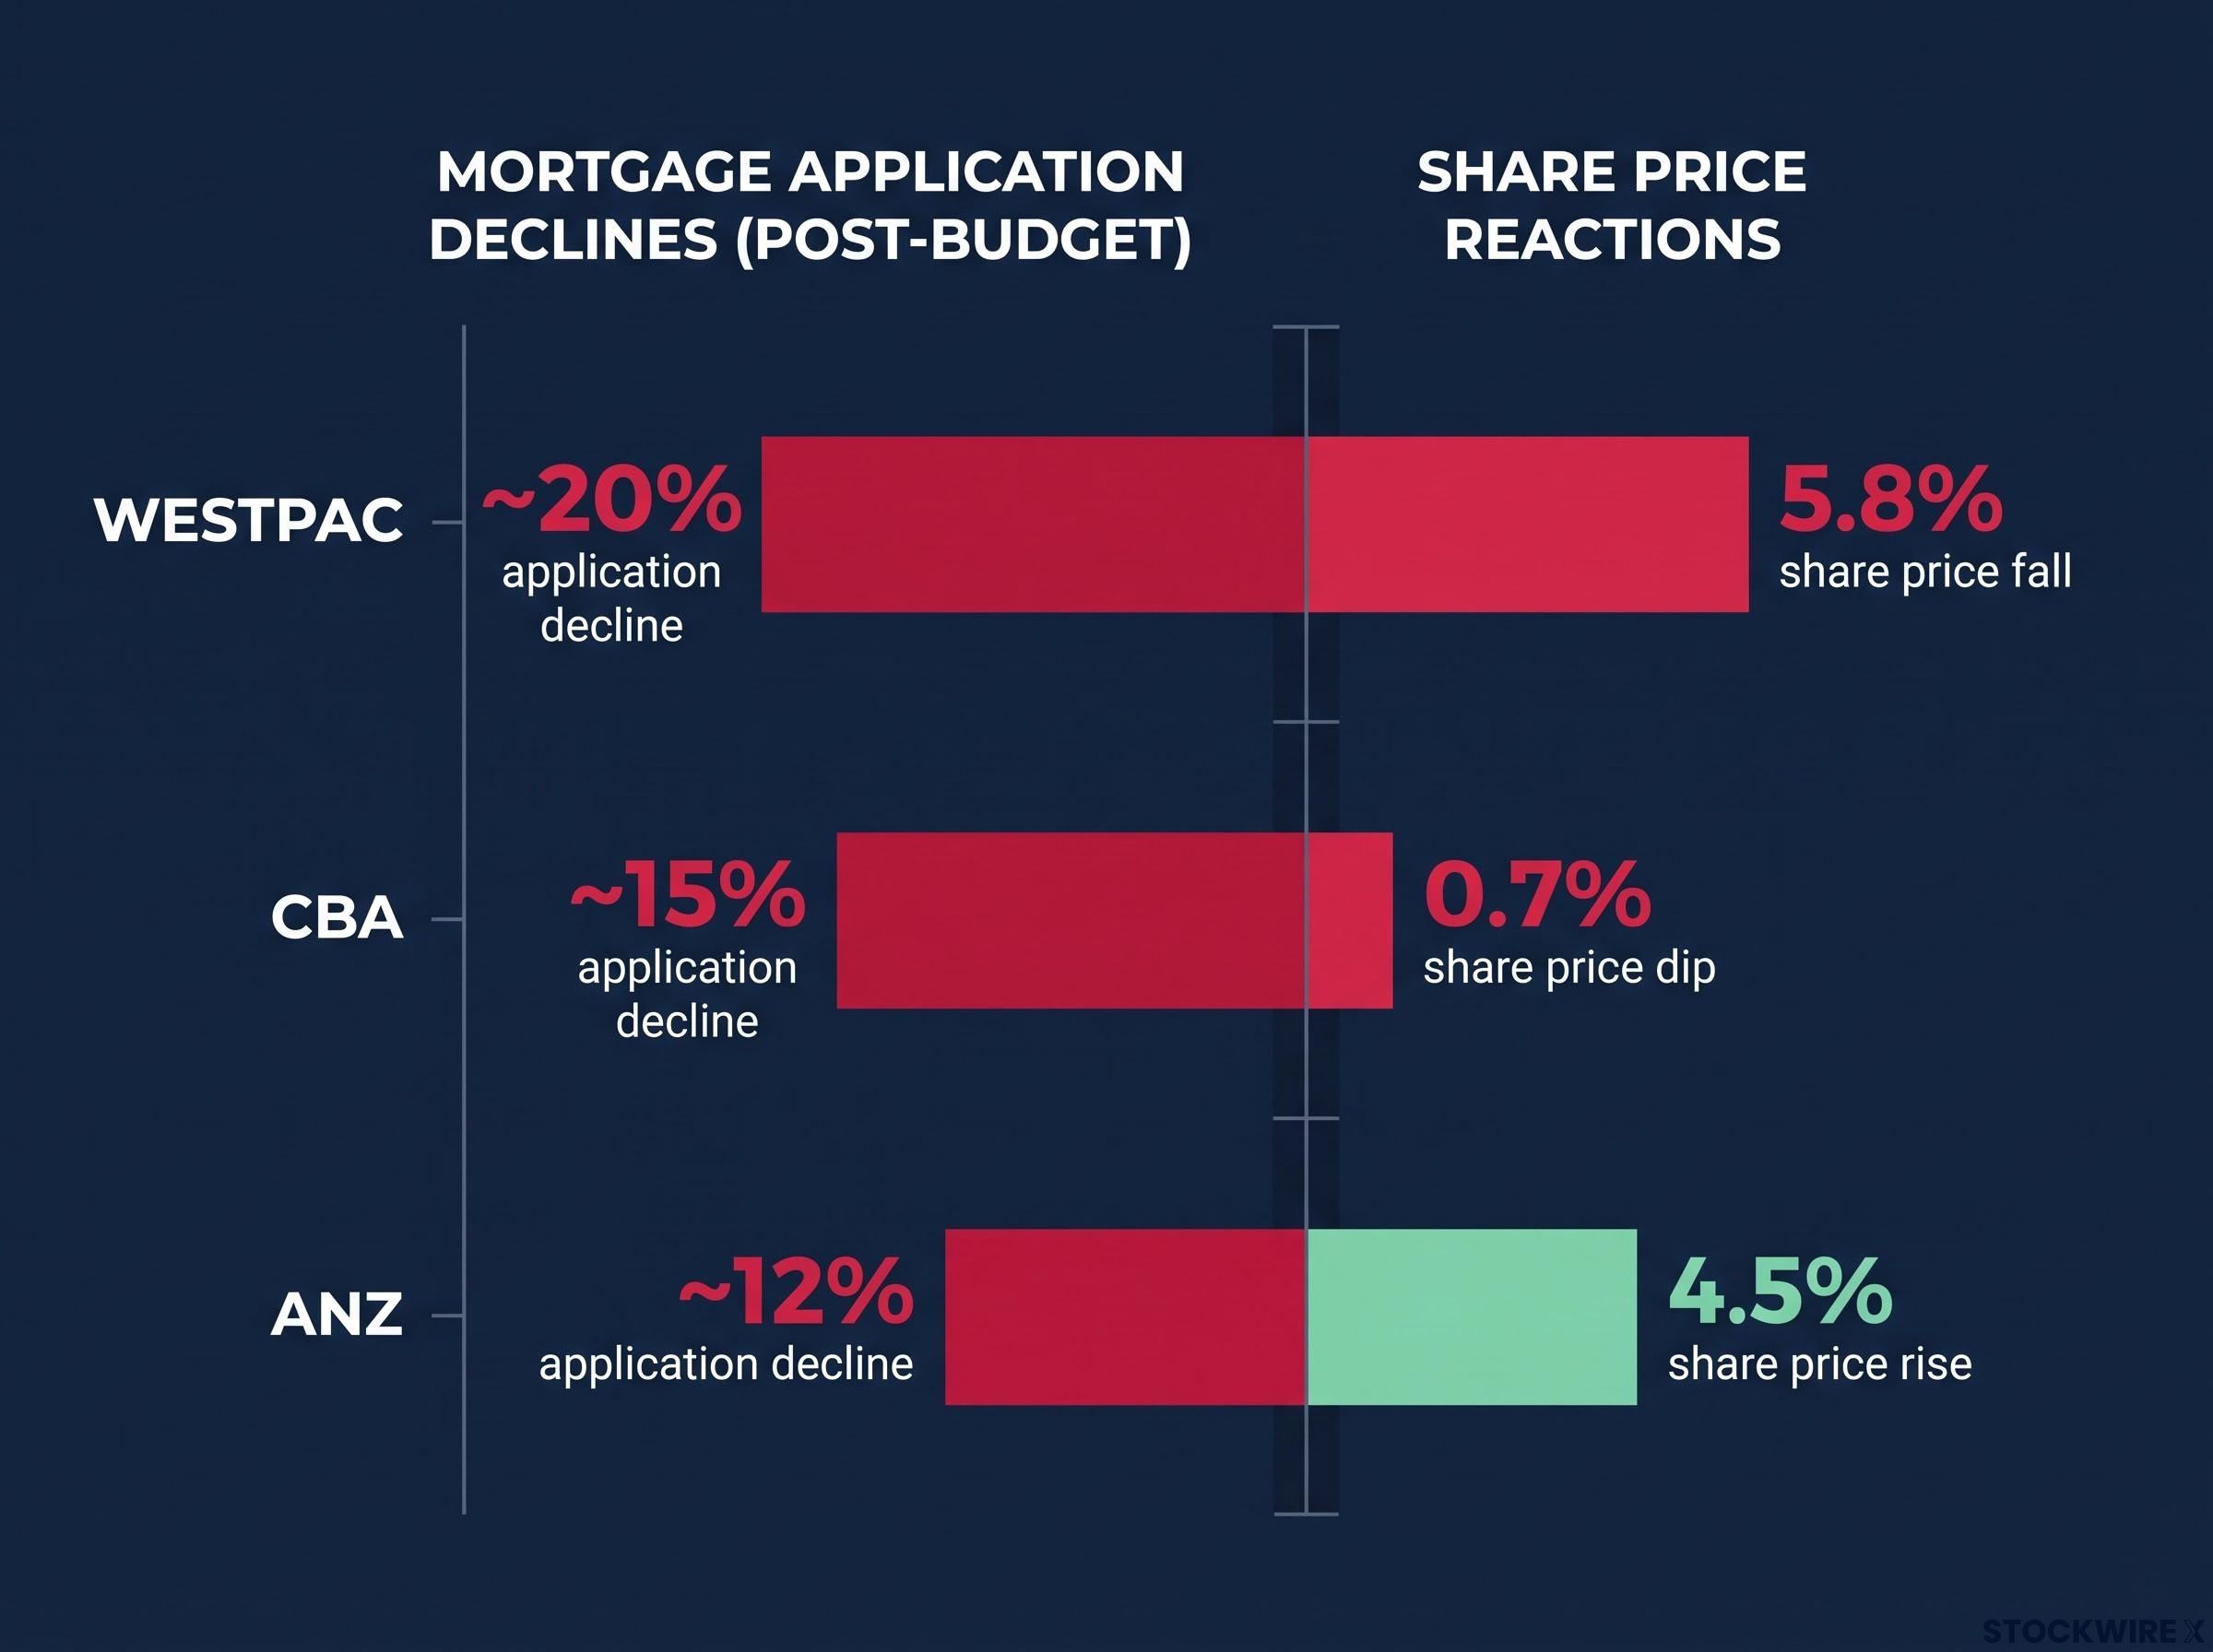
The August 2026 earnings week exposed a sector that is no longer moving in lockstep. Three banks facing the same set of pressures, the May budget’s property tax changes, the February 2026 rate increase, and a broad pullback in investor credit demand, produced three distinct share price reactions. The gap between Westpac’s sell-off and ANZ’s rally is not noise. It is the market telling you that different provisioning stances and different mortgage book compositions are producing different risk profiles within what most retail investors still treat as a single trade.
Here is a framework for reading what each bank’s result actually reveals about its FY27 risk-reward position, and which of the three signals matters most for the portfolio decision you are likely weighing right now.
Why mortgage applications fell sharply after the May budget
The mortgage slowdown did not arrive in a single blow. It stacked up over nine months, with each new pressure compounding the one before it.
CBA management attributed the decline to six distinct forces:
- Affordability constraints that had been accumulating since at least October 2025
- The February 2026 interest rate increase
- Taxation changes introduced in the May federal budget targeting property investors
- Uncertainty in the global economic environment
- The effect of an oil shock on household confidence
- Expectations of higher future inflation
Those six pressures landed on three mortgage books with different compositions, and produced three different volume outcomes.
| Bank | Overall application decline (post-budget) | Investor application decline | Owner-occupier application decline |
|---|---|---|---|
| ANZ | ~12% | Not disclosed | Not disclosed |
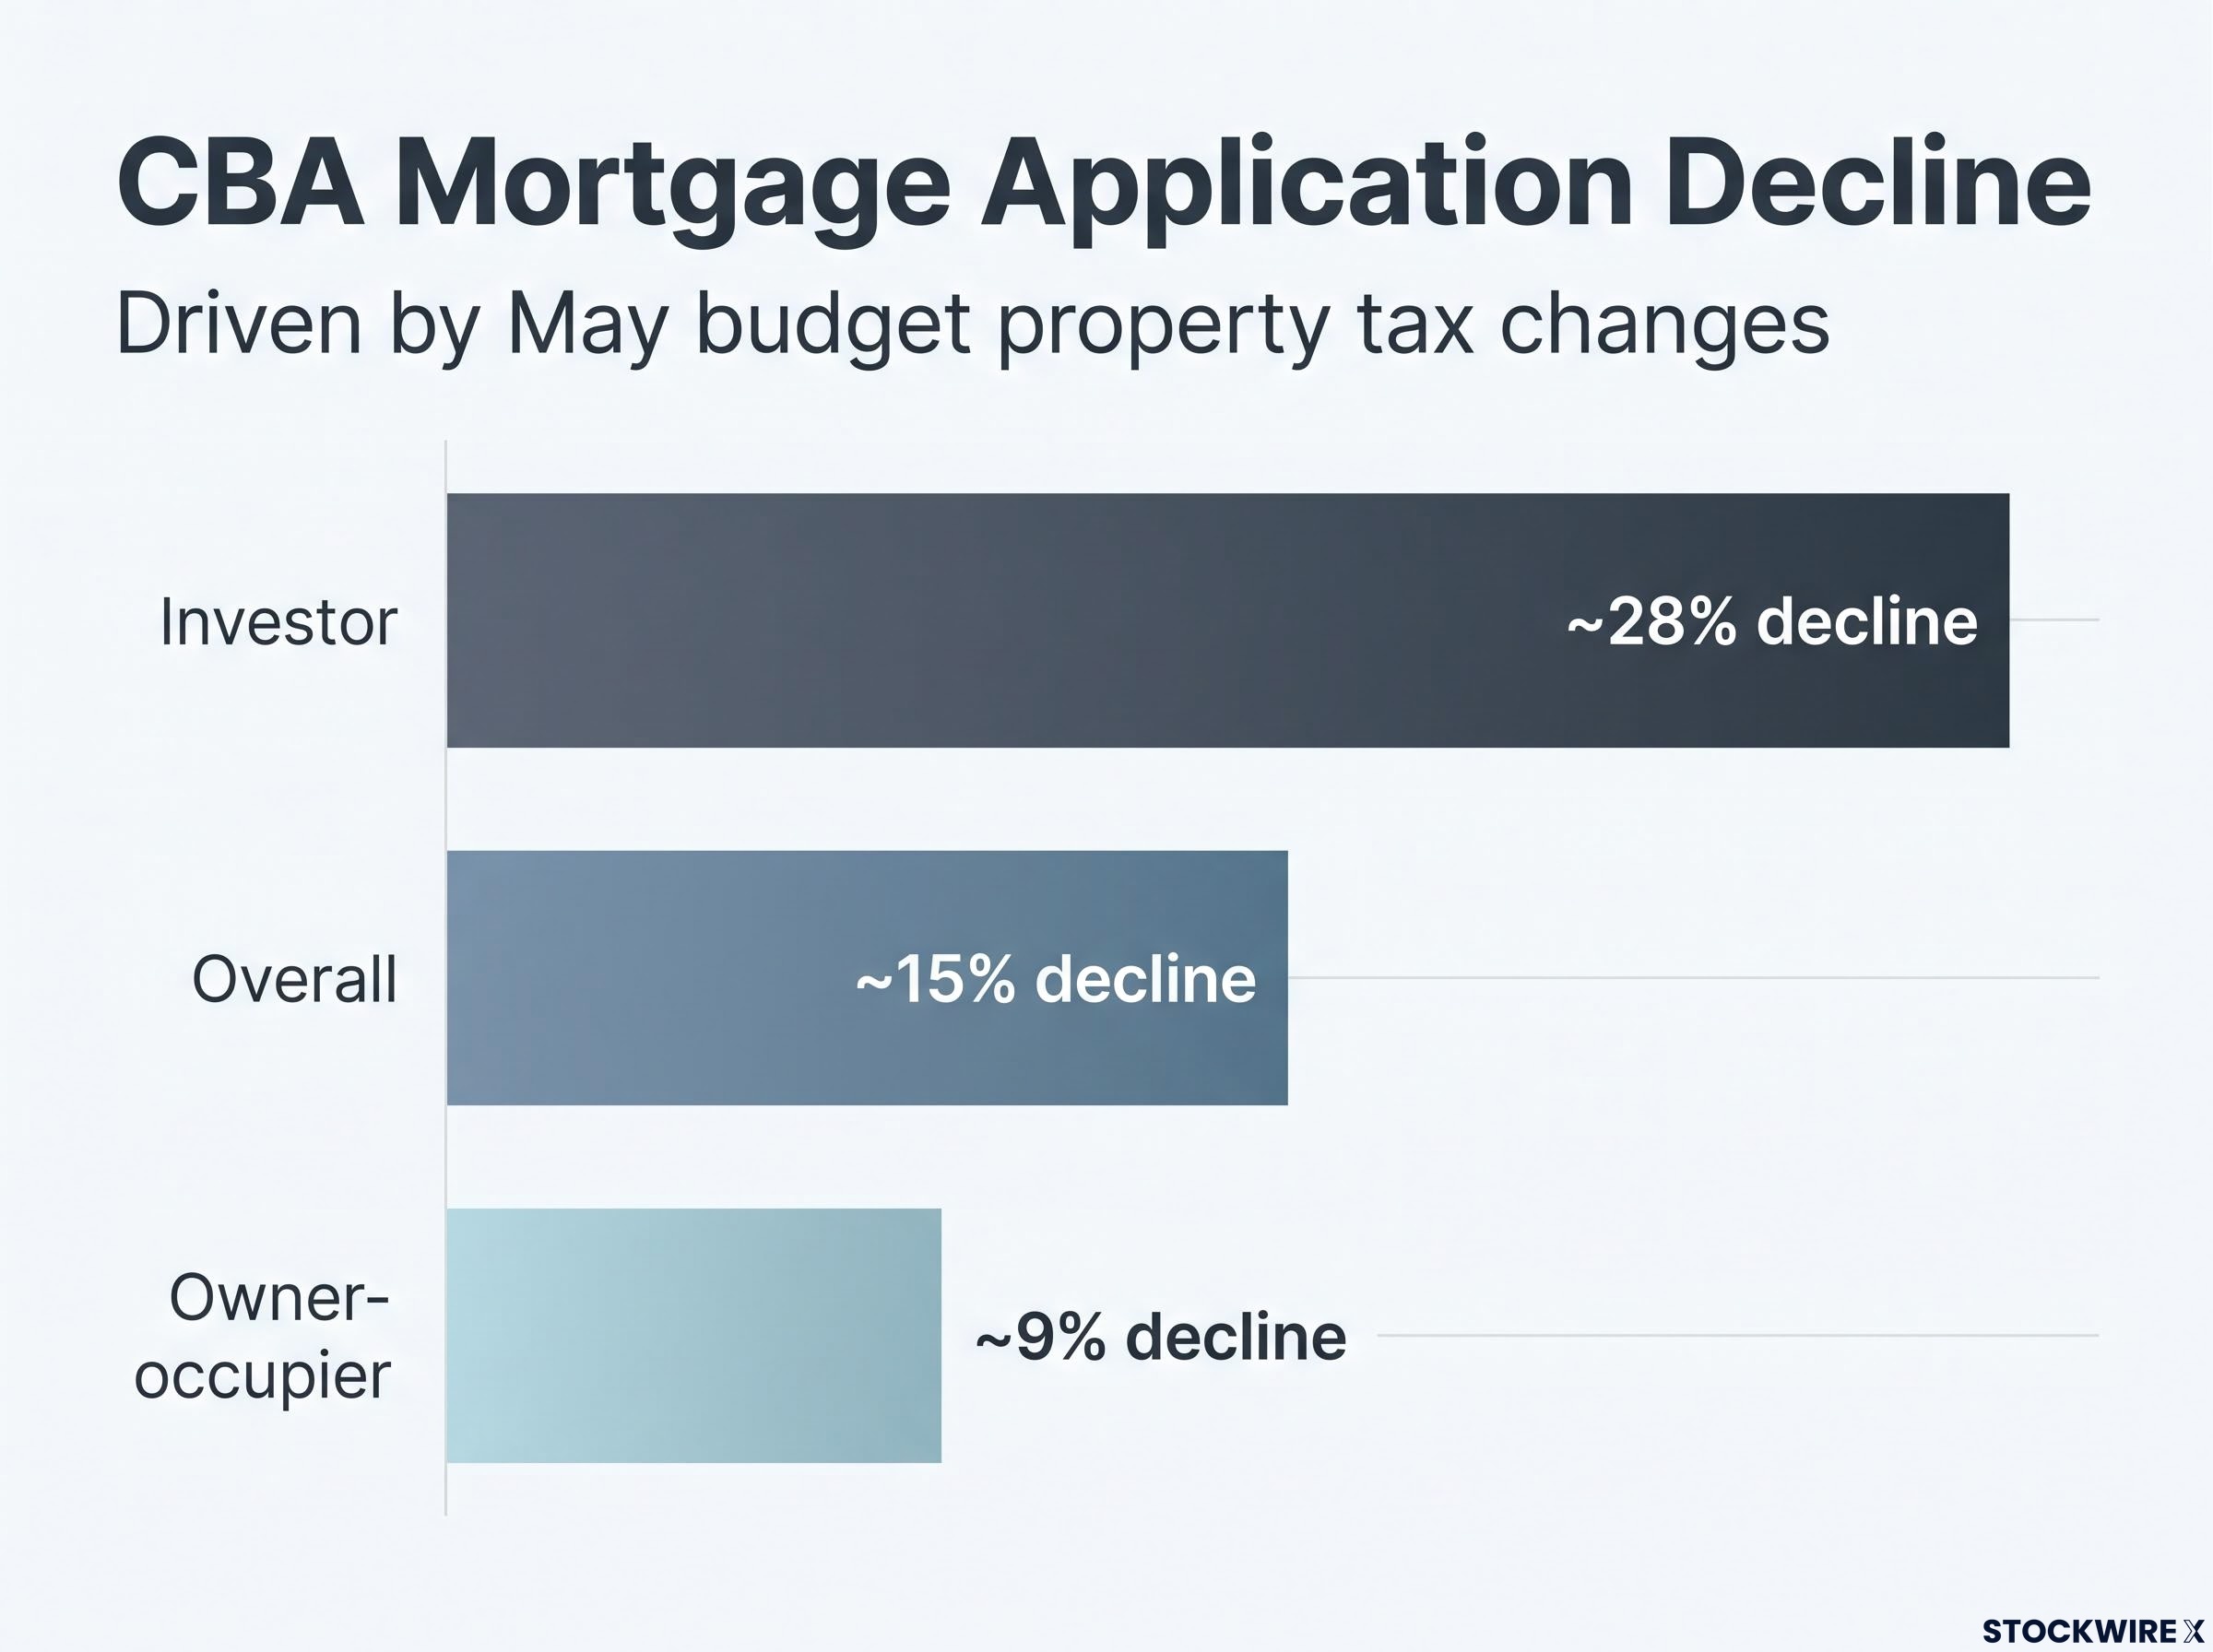
| CBA | ~15% | ~28% | ~9% |
| Westpac | ~20% | Not disclosed | Not disclosed |
The split in CBA’s data is where the signal sharpens. Investor applications fell approximately 28% while owner-occupier applications dropped only about 9%. That gap tells you the budget’s property tax changes are creating a two-speed mortgage market. Banks carrying heavier investor mortgage exposure face more volume risk than the headline application numbers suggest, and the decline is policy-driven, which means it will persist for as long as the tax settings remain in place.
The budget’s property tax changes extend well beyond a short-term confidence shock; the removal of negative gearing on existing dwellings and the replacement of the 50% CGT discount both take effect from 1 July 2027, meaning the structural investor demand headwind the banks are absorbing in FY26 results will persist as a policy overhang through at least the first half of FY28.
When big ASX news breaks, our subscribers know first
What CBA’s record profit actually signals about the sector
CBA delivered a record FY26 cash profit of approximately A$10.98 billion, up 7.1% year on year, with return on equity climbing to 14.0%. On its own, that is a franchise performing at the top of its range.
The number that matters more sits underneath it.
CBA achieved market-matching or above-market growth across all five of its core domestic segments, home lending, business lending, consumer finance, household deposits, and business deposits, at the same time. According to management, this breadth of simultaneous growth across every major category had not been recorded in approximately 15 years.
That five-category result is the clearest signal of competitive positioning in this reporting season. It tells you CBA is not reliant on a single earnings engine. Its diversification is not theoretical; it showed up in the same year that mortgage demand weakened.
The share price declined just 0.7% on 12 August 2026. That contained reaction tells you the market is treating the mortgage slowdown as a managed headwind for this bank, not a threat to the franchise. CBA’s premium valuation is an active bet on its ability to keep arrears and margins tight as volumes slow.
The guidance gap between FY26 achievement and FY27 outlook
The forward picture is less comfortable. CBA’s management indicated mortgage credit growth is likely to settle in the 4-5% range across FY27, with any meaningful improvement expected only toward the back half of the financial year. Applications are running approximately 15% below pre-budget levels and about 17% below year-ago volumes.
That means the first half of FY27 will reflect the full force of the slowdown before any recovery materialises. Modest rises in mortgage arrears have been disclosed. No dramatic new provisioning overlays have been added, which is consistent with CBA’s read that this is a cyclical soft patch rather than a full credit cycle turn, but it also means there is limited cushion if arrears accelerate faster than expected.
ANZ’s credit quality result and what the market rewarded
ANZ reported 3Q26 cash profit of A$1.90 billion and the smallest post-budget application decline among the three majors at approximately 12%. Its mortgage book still expanded around 2% over the June quarter despite the demand slowdown.
Those were solid numbers. They were not the reason the share price rose 4.5%.
ANZ’s individual provision charge for the quarter was approximately A$65 million, around half the A$130 million the market had pencilled in, pointing to an annualised individual loss rate of only about 3 basis points.
That provision result is the single strongest near-term credit quality signal in this reporting season. Total provision charges (individual plus collective) came in below the first-half quarterly average, and the collective provision balance remained broadly stable as a share of credit risk-weighted assets. ANZ’s existing mortgage and business borrowers are holding up significantly better than the market had priced in.
The trade-off is forward-dated. Weaker application flows today will suppress interest income into early FY27. The three watchpoints for the next two quarters:
- Arrears trajectory as lagged rate and tax effects flow through borrowers
- Whether the individual provision charge stays at or near these low levels in 1Q27
- Pace of mortgage and business lending volume recovery
For retail investors who tend to anchor to revenue and profit headlines, ANZ’s result is a reminder that in bank stocks, the provision line is where forward risk actually gets priced.
Westpac’s provisioning stance as a macro bet
Westpac recorded the steepest post-budget contraction in mortgage applications among the three, at approximately 20%, and reported soft margins alongside 90-plus day mortgage delinquencies running a little above 1%. Shares fell 5.8% on 10 August 2026, the largest decline of the three.
The headline reaction framed it as the weakest result. The provisioning detail tells a more nuanced story.
Westpac holds total credit provisions of approximately A$5.3 billion, with provisions to gross loans steady around 58 basis points. Roughly A$2.0 billion of that sits above base-case modelled losses in the form of overlays, with management adding a new overlay targeting stress in household discretionary spending.
That A$2.0 billion overlay figure tells you that management is explicitly betting current delinquency metrics understate where the consumer cycle is heading. They have increased the severity of their downside scenarios and added a new category of risk, discretionary spending stress, that neither CBA nor ANZ has separately provisioned for.
Two scenarios and what each means for the Westpac thesis
If macro conditions stabilise and consumer stress undershoots those overlays, Westpac delivers meaningful earnings upgrades as provisions are unwound. The A$2.0 billion cushion becomes a tailwind rather than a drag, and the current share price discount narrows.
If conditions deteriorate and delinquencies rise toward or beyond current overlay levels, Westpac enters the downturn with the thickest cushion of the three. Near-term earnings carry more downside sensitivity than peers, but the balance sheet absorbs more punishment before capital comes under pressure.
Either way, Westpac functions as the high-beta, macro-directional call in the sector. For investors with a specific view on the Australian consumer cycle, it is the bank where that conviction translates most directly into share price outcome.
| Metric | CBA | ANZ | Westpac |
|---|---|---|---|
| Total provisions | Not separately disclosed | Below 1H quarterly average | ~A$5.3 billion |
| Provisions / gross loans | Not disclosed | Not disclosed | ~58 bps |
| Overlays above base case | No dramatic new overlays | Stable collective provision as % of credit RWA | ~A$2.0 billion |
| 90+ day delinquencies | Modestly rising | Rising in some buckets | A little above 1% |
How the three banks differ on provisions, and why that is the FY27 investment question
Step back from the individual profiles and a structural pattern emerges. These three banks have not simply produced different results. They have taken three different bets on the same uncertain macro environment.
Provisioning overlays are not a standardised metric across the Big Four; each bank sets its own overlay methodology, meaning a direct dollar comparison between Westpac’s A$2.0 billion above-base-case cushion and ANZ’s stable collective provision balance requires adjusting for differences in credit risk-weighted asset bases and internal loss models.
| Bank | Provisioning stance | Macro view implied | Near-term earnings risk | Potential FY27 catalyst |
|---|---|---|---|---|
| Westpac | Large overlays, A$2.0bn above base case | More consumer and credit stress ahead | Highest (volume decline + overlay drag) | Provision releases if stress undershoots |
| ANZ | Individual charge ~half of expectations | Benign credit outcomes for existing borrowers | Moderate (volume risk, not credit risk) | Sustained low loss rates validating valuation |
| CBA | No dramatic overlays, modest arrears | Mid-cycle slowdown, not a full turn | Lower (diversified earnings buffer) | Mortgage volume recovery in 2H FY27 |
None of these stances is objectively right or wrong. The provisioning divergence is a signal that the reader needs to form their own view on the Australian consumer cycle before the right bank share becomes obvious. Slower mortgage growth and lingering margin pressure mean earnings upgrades are unlikely across the sector without a clearer turn in housing activity or a positive surprise on bad debts. Capital positions are solid across all three, which supports dividends but does not fully insulate share prices from an extended period of low credit growth.
Australian bank shares are no longer a pure yield-plus-steady-growth trade. They are differentiated macro and management bets, and FY27 investors need to evaluate them accordingly.
Matching each bank’s risk profile to an investment thesis for FY27
The three profiles below are not a ranking from best to worst. They are three different entry points for three different investor views on where Australian credit and housing are heading. Your own macro assumptions should drive which profile fits your portfolio.
CBA: quality and diversification at a premium
- Thesis: quality core holding
- Key metric: Record profit of approximately A$10.98 billion, return on equity of 14.0%, five-category simultaneous growth for the first time in roughly 15 years
- Watchpoint: Arrears trajectory and whether mortgage volumes recover in the second half of FY27 as guided; the orderly 0.7% share price decline signals the market is comfortable, but that comfort assumes CBA delivers on the back-half recovery
CBA’s valuation premium entering August reporting season was already a point of broker contention, with the stock trading at roughly 27-28x forward earnings against a long-run sector average closer to 18x, a gap that compresses the margin for error if mortgage volume recovery in the second half of FY27 arrives later than guided.
ANZ: near-term credit quality with a revenue lag
- Thesis: credit-quality and execution story
- Key metric: Individual provision charge of approximately A$65 million versus A$130 million expected; smallest application decline among the three at approximately 12%; mortgage book growth of approximately 2% in the June quarter
- Watchpoint: Whether the low loss rate holds as lagged rate and tax effects flow through borrowers in early FY27; today’s credit quality advantage could narrow if arrears normalise upward
Westpac: macro conviction required
- Thesis: high-beta, provisioning-optionality play
- Key metric: A$2.0 billion overlays above base case; largest application decline at approximately 20%; new discretionary consumer spending overlay
- Watchpoint: Whether consumer stress materialises to validate the overlays, or whether conditions stabilise and provision releases deliver earnings upgrades; the 5.8% share price discount creates upside leverage if Westpac’s caution proves excessive
What the next two quarters will confirm or contradict
The August results did not produce a definitive verdict on the Australian credit cycle. They produced three different management bets on the same uncertain outcome. The next quarterly reporting cycle in late 2026 will be the first real test of which bet was right.
Three specific forward signals will resolve the current ambiguity:
- Mortgage application volume recovery trajectory: whether the post-budget decline stabilises, deepens, or begins to reverse across the three banks
- Individual provision charge trends in 1Q27 results: whether ANZ’s benign credit signal holds, and whether Westpac’s overlays begin to be drawn upon or remain excess cushion
- Westpac’s discretionary consumer overlay: whether the new category proves prescient or conservative in light of actual consumer behaviour data
HomeCo Daily Needs REIT reported that while May and June experienced softness across retailers, the recovery in July was significant and broad-based, spanning both discretionary and non-discretionary categories. Management expressed expectations of retail spending surprising to the upside over the following six months.
Set that against Amotiv, which flagged that fourth-quarter exit rates in the 4WD market represented the sharpest deterioration seen during the year, with FY27 planning assuming new vehicle sales remain subdued. The gap between these two signals is not contradictory. It tells you the Australian consumer is under differentiated stress, and that Westpac’s discretionary consumer overlay may be tracking exactly the right risk even if aggregate spending looks mixed.
For investors holding Australian bank shares, the next two quarterly updates are not routine check-ins. They are the data points that will either validate or unwind the provisioning decisions these three management teams have just made, with direct implications for which bank’s share price has the most upside from current levels.
For investors wanting to understand the share price levels from which August earnings delivered these reactions, our full explainer on the July 2026 bank rally details how 5-8% gains across the Big Four in the preceding month set up the valuation context that made Westpac’s 5.8% sell-off and ANZ’s 4.5% rise so significant.
This article is for informational purposes only and should not be considered financial advice. Investors should conduct their own research and consult with financial professionals before making investment decisions. Past performance does not guarantee future results. Financial projections are subject to market conditions and various risk factors.