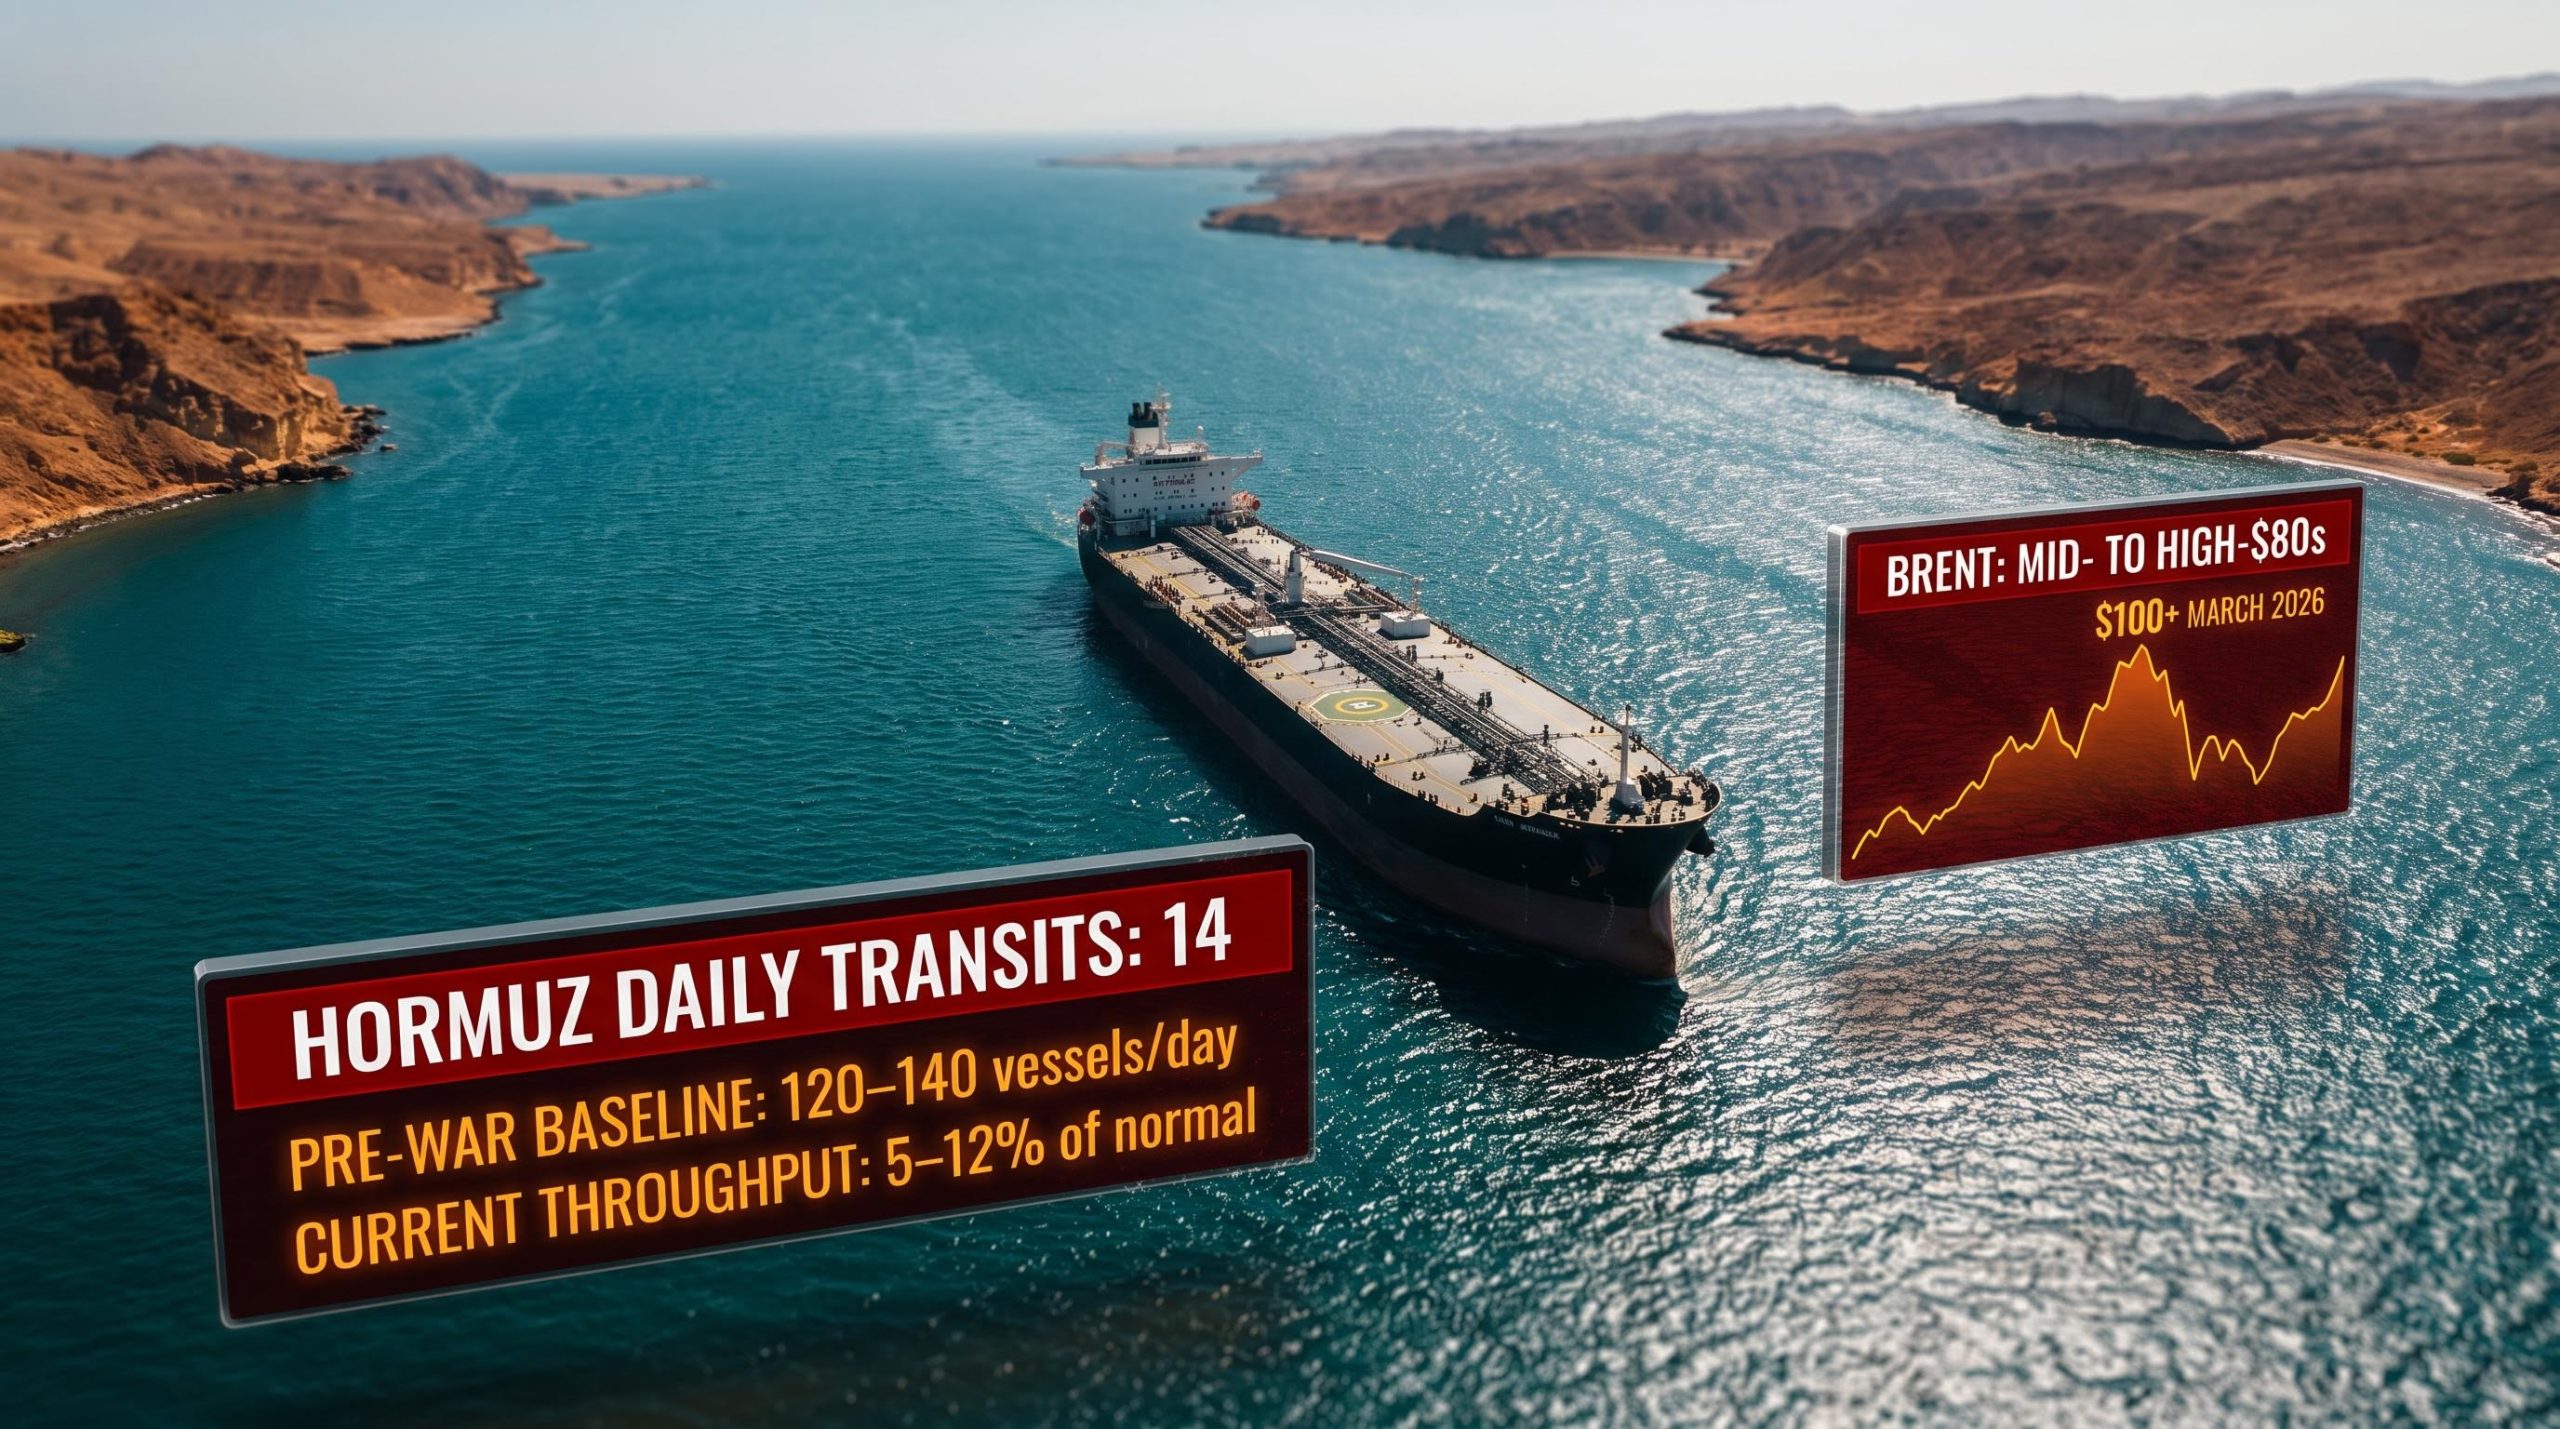
Strait of Hormuz transit data recorded just 14 commercial vessels making the crossing within a single 24-hour window this week. Before the conflict began in late February 2026, that number averaged 120-140 per day. Iran has declared the waterway “completely open.” The traffic data says otherwise.
That gap between declaration and reality is the story of mid-August 2026. Six months into a crisis that has produced the most severe disruption to global oil shipping in modern memory, Brent crude is trading in the mid- to high-$80s, vessel counts are hovering at 5-12% of pre-war norms, and the conditions required for genuine normalisation remain unmet across every measurable dimension.
Here is what the traffic data, the price trajectory, and the structural barriers actually tell you about where oil goes from here, and what specific thresholds would need to clear before anyone can credibly call this crisis resolved.
The numbers that tell the real story of the strait
The collapse is not subtle. Recent 24-hour transit counts have fluctuated between 3 and 14 commercial vessels. Multi-day averages have settled around 6-11. Against a pre-war baseline of 120-140 vessels per day, that puts the strait’s current clearance rate at roughly 5-12% of normal capacity.
The backlog behind those numbers is staggering. At various points during the crisis, between 299 and 427 vessels have been recorded waiting at anchor offshore, unable to transit.
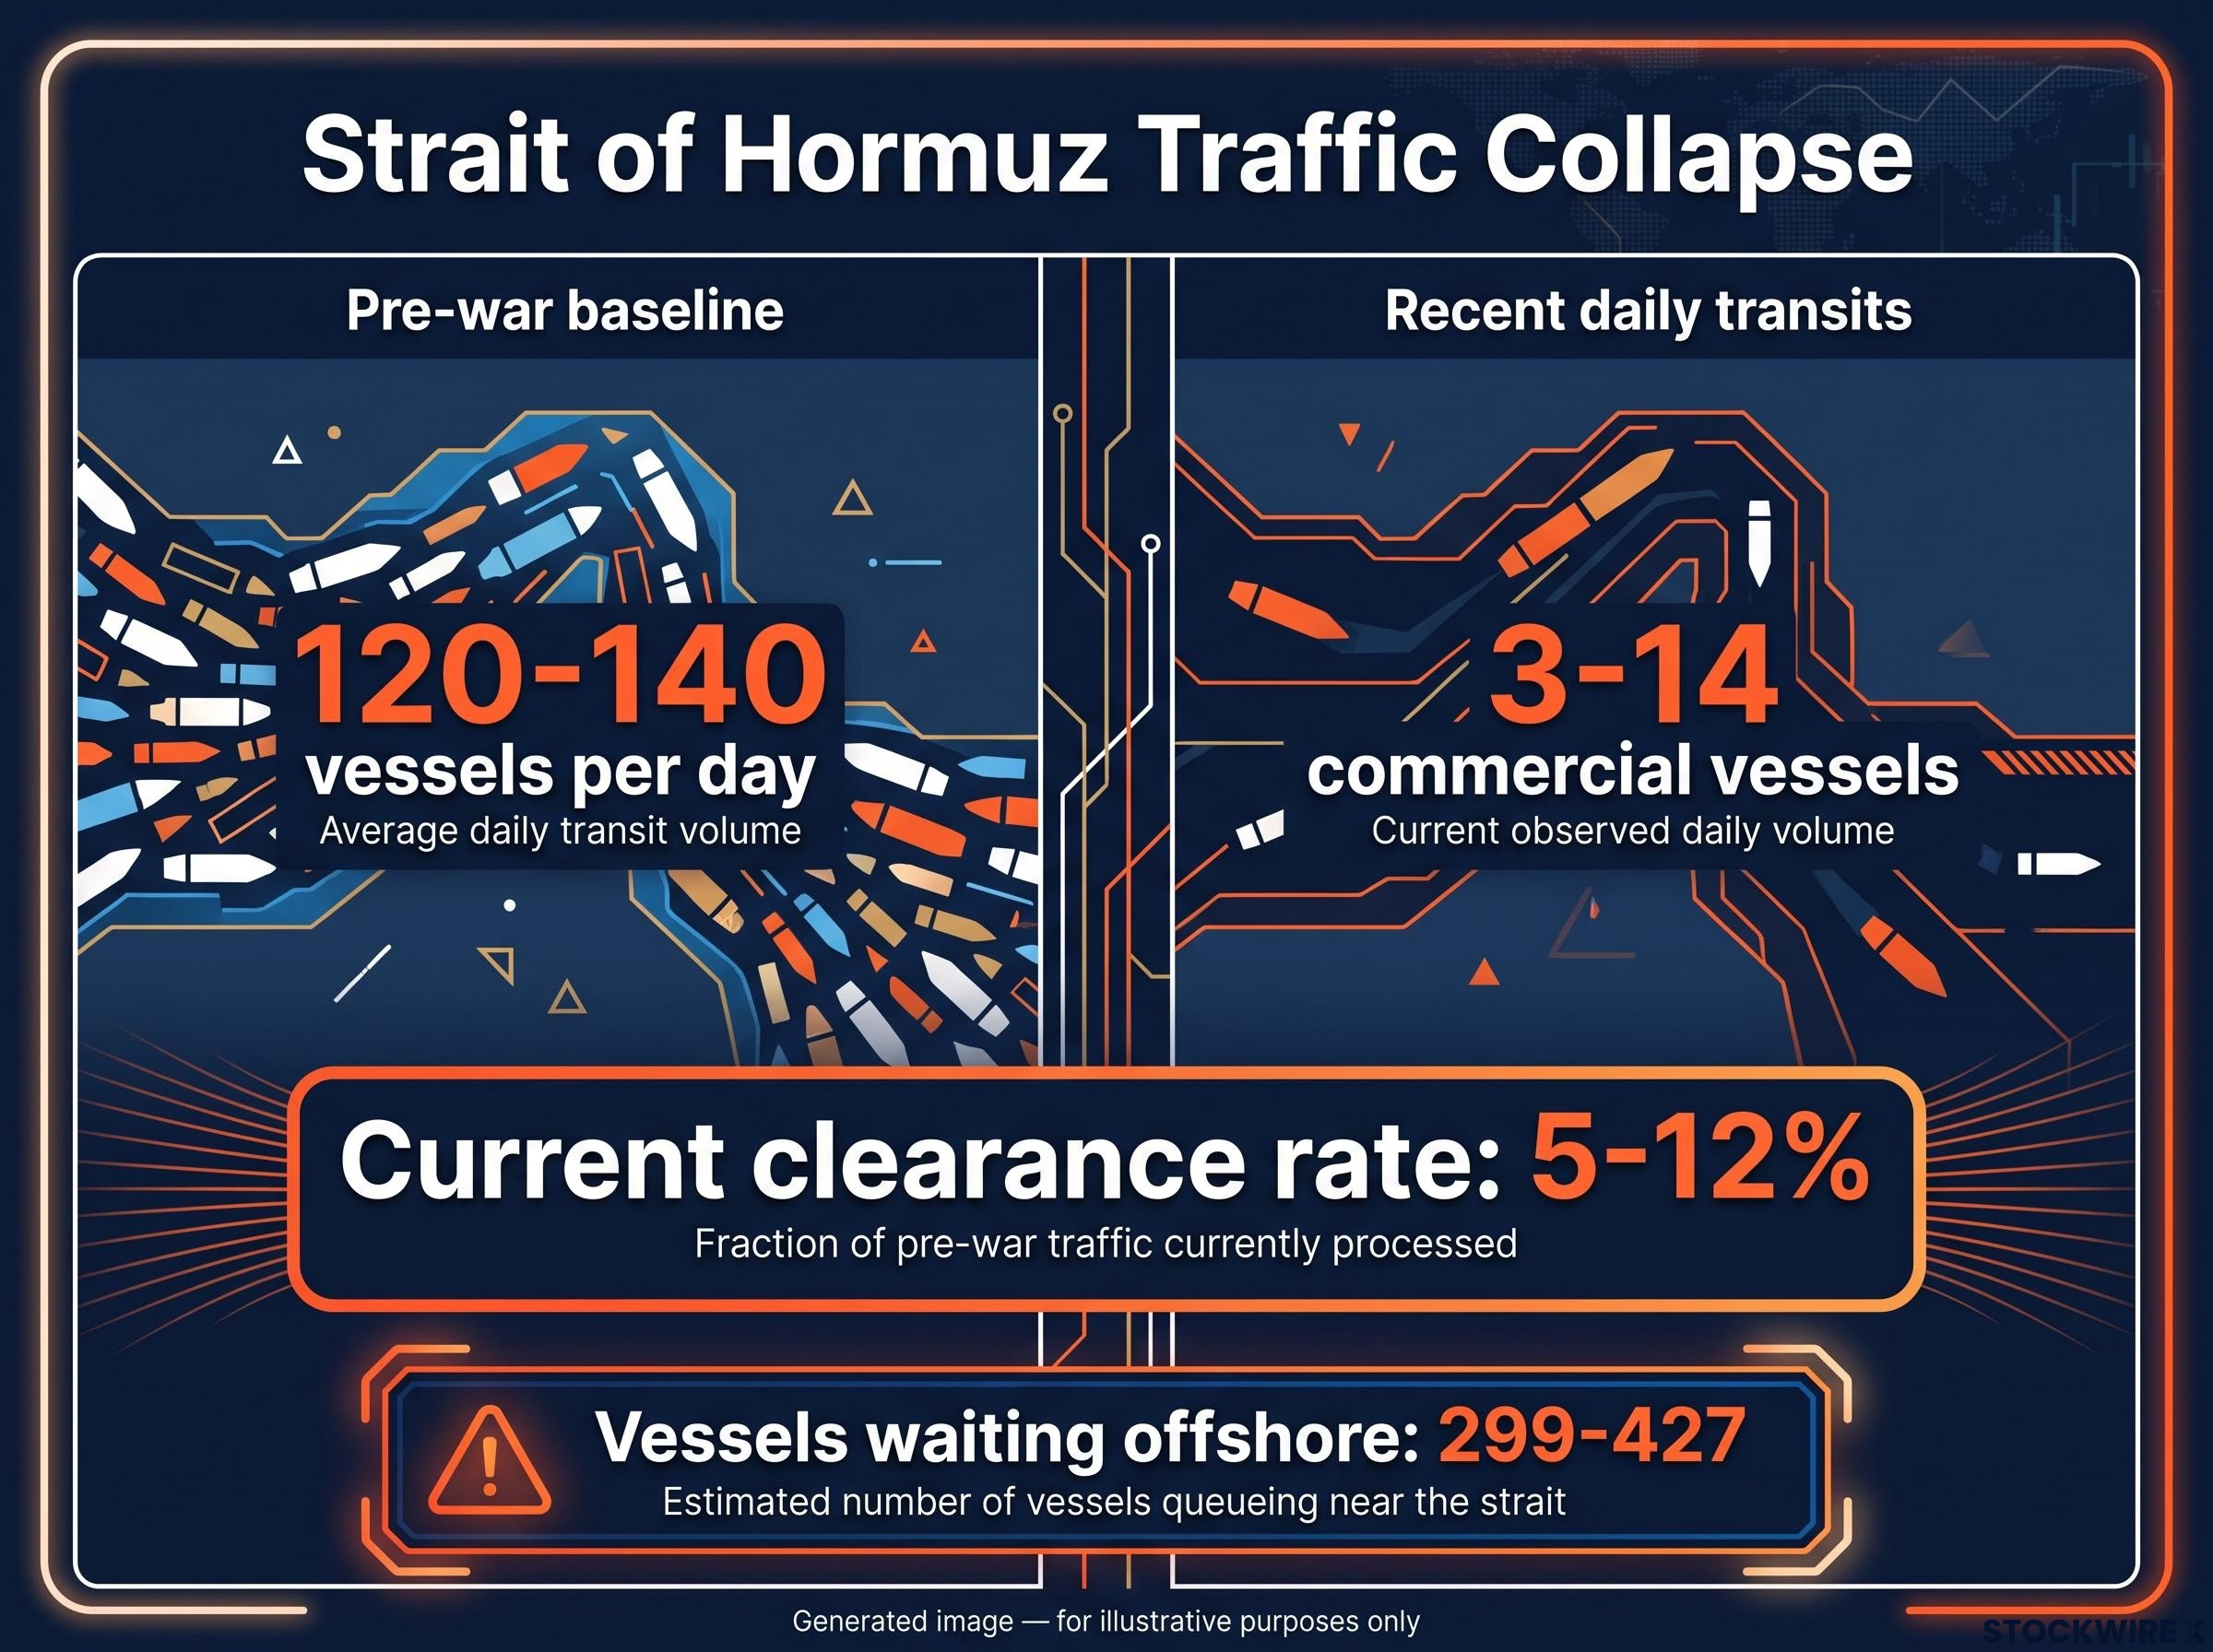
The key traffic metrics:
- Recent daily transits: 3-14 commercial vessels
- Pre-war daily baseline: 120-140 vessels
- Current clearance rate: approximately 5-12% of pre-crisis levels
- Vessels waiting offshore: 299-427 at various points during the crisis
Traffic through the Strait of Hormuz has collapsed to a fraction of its pre-conflict level, with as few as 14 vessels completing the crossing on a given day against a pre-war norm of 120-140. The waterway carries an official “open” status. In practice, meaningful commercial throughput has not returned.
A methodological note: some real-time trackers report a “normal” baseline of 60-73 vessels per day, which reflects a narrower vessel category. The 120-140 range is the standard industry benchmark for full commercial traffic.
At 5-12% throughput, no price model treating this disruption as contained can rest comfortably on the current data. The strait is not functioning as a global oil artery in any meaningful operational sense.
When big ASX news breaks, our subscribers know first
Why the world’s most critical oil lane cannot simply be declared open
A political declaration of “open” and an operationally normal shipping lane are separated by four distinct friction layers, each operating on a different timeline and responding to different signals. All four must resolve before sustained normalisation is possible.
- War-risk insurance premiums. These are currently running at approximately 30 times normal rates. War-risk insurance is the additional premium shipowners must pay to cover vessels transiting conflict zones. At current levels, the cost alone is sufficient to keep older or less well-insured tonnage off the strait entirely.
The near-total war-risk insurance withdrawal from Gulf routes in May 2026 effectively closed the strait to standard commercial traffic even when physical passage was technically possible, a dynamic that VLCC hire rates tracking around $110,000 per day confirmed in real time.
- Crew safety and maritime union classification. Maritime unions have classified Hormuz as an active war zone following sustained periods of drone, missile, and mine threats. Seafarers and their unions operate independently of diplomatic statements; until the classification changes, crew availability for Hormuz transits remains constrained.
MARAD war risk zone classifications for the Persian Gulf and Strait of Hormuz underpin the insurance and crew-availability constraints that commercial operators face, providing the regulatory basis on which maritime unions and flag states issue their own precautionary guidance.
- Physical lane clearance. After months of conflict, traffic controllers and flag states require verified mine clearance, restoration of navigational aids, and confirmation that shipping lanes are physically safe. This is a staged process that cannot be accelerated by declaration.
- Commercial re-routing inertia. Consuming countries have established alternative supply chains, drawing on strategic reserves and sourcing Atlantic Basin crude while Hormuz has been impaired. Once those emergency logistics are in place, traders do not instantly revert. Contracts, freight arrangements, and inventory positions all take time to unwind.
For anyone with exposure to energy markets or shipping equities, this layered reality means that any single positive headline, whether a ceasefire declaration or a diplomatic statement, is unlikely to be sufficient to move the needle on actual flows. Each layer must clear independently, and the slowest sets the pace.
Twenty percent of global oil flows through a bottleneck 33 kilometres wide
The strait’s strategic weight is best understood through arithmetic, not abstraction.
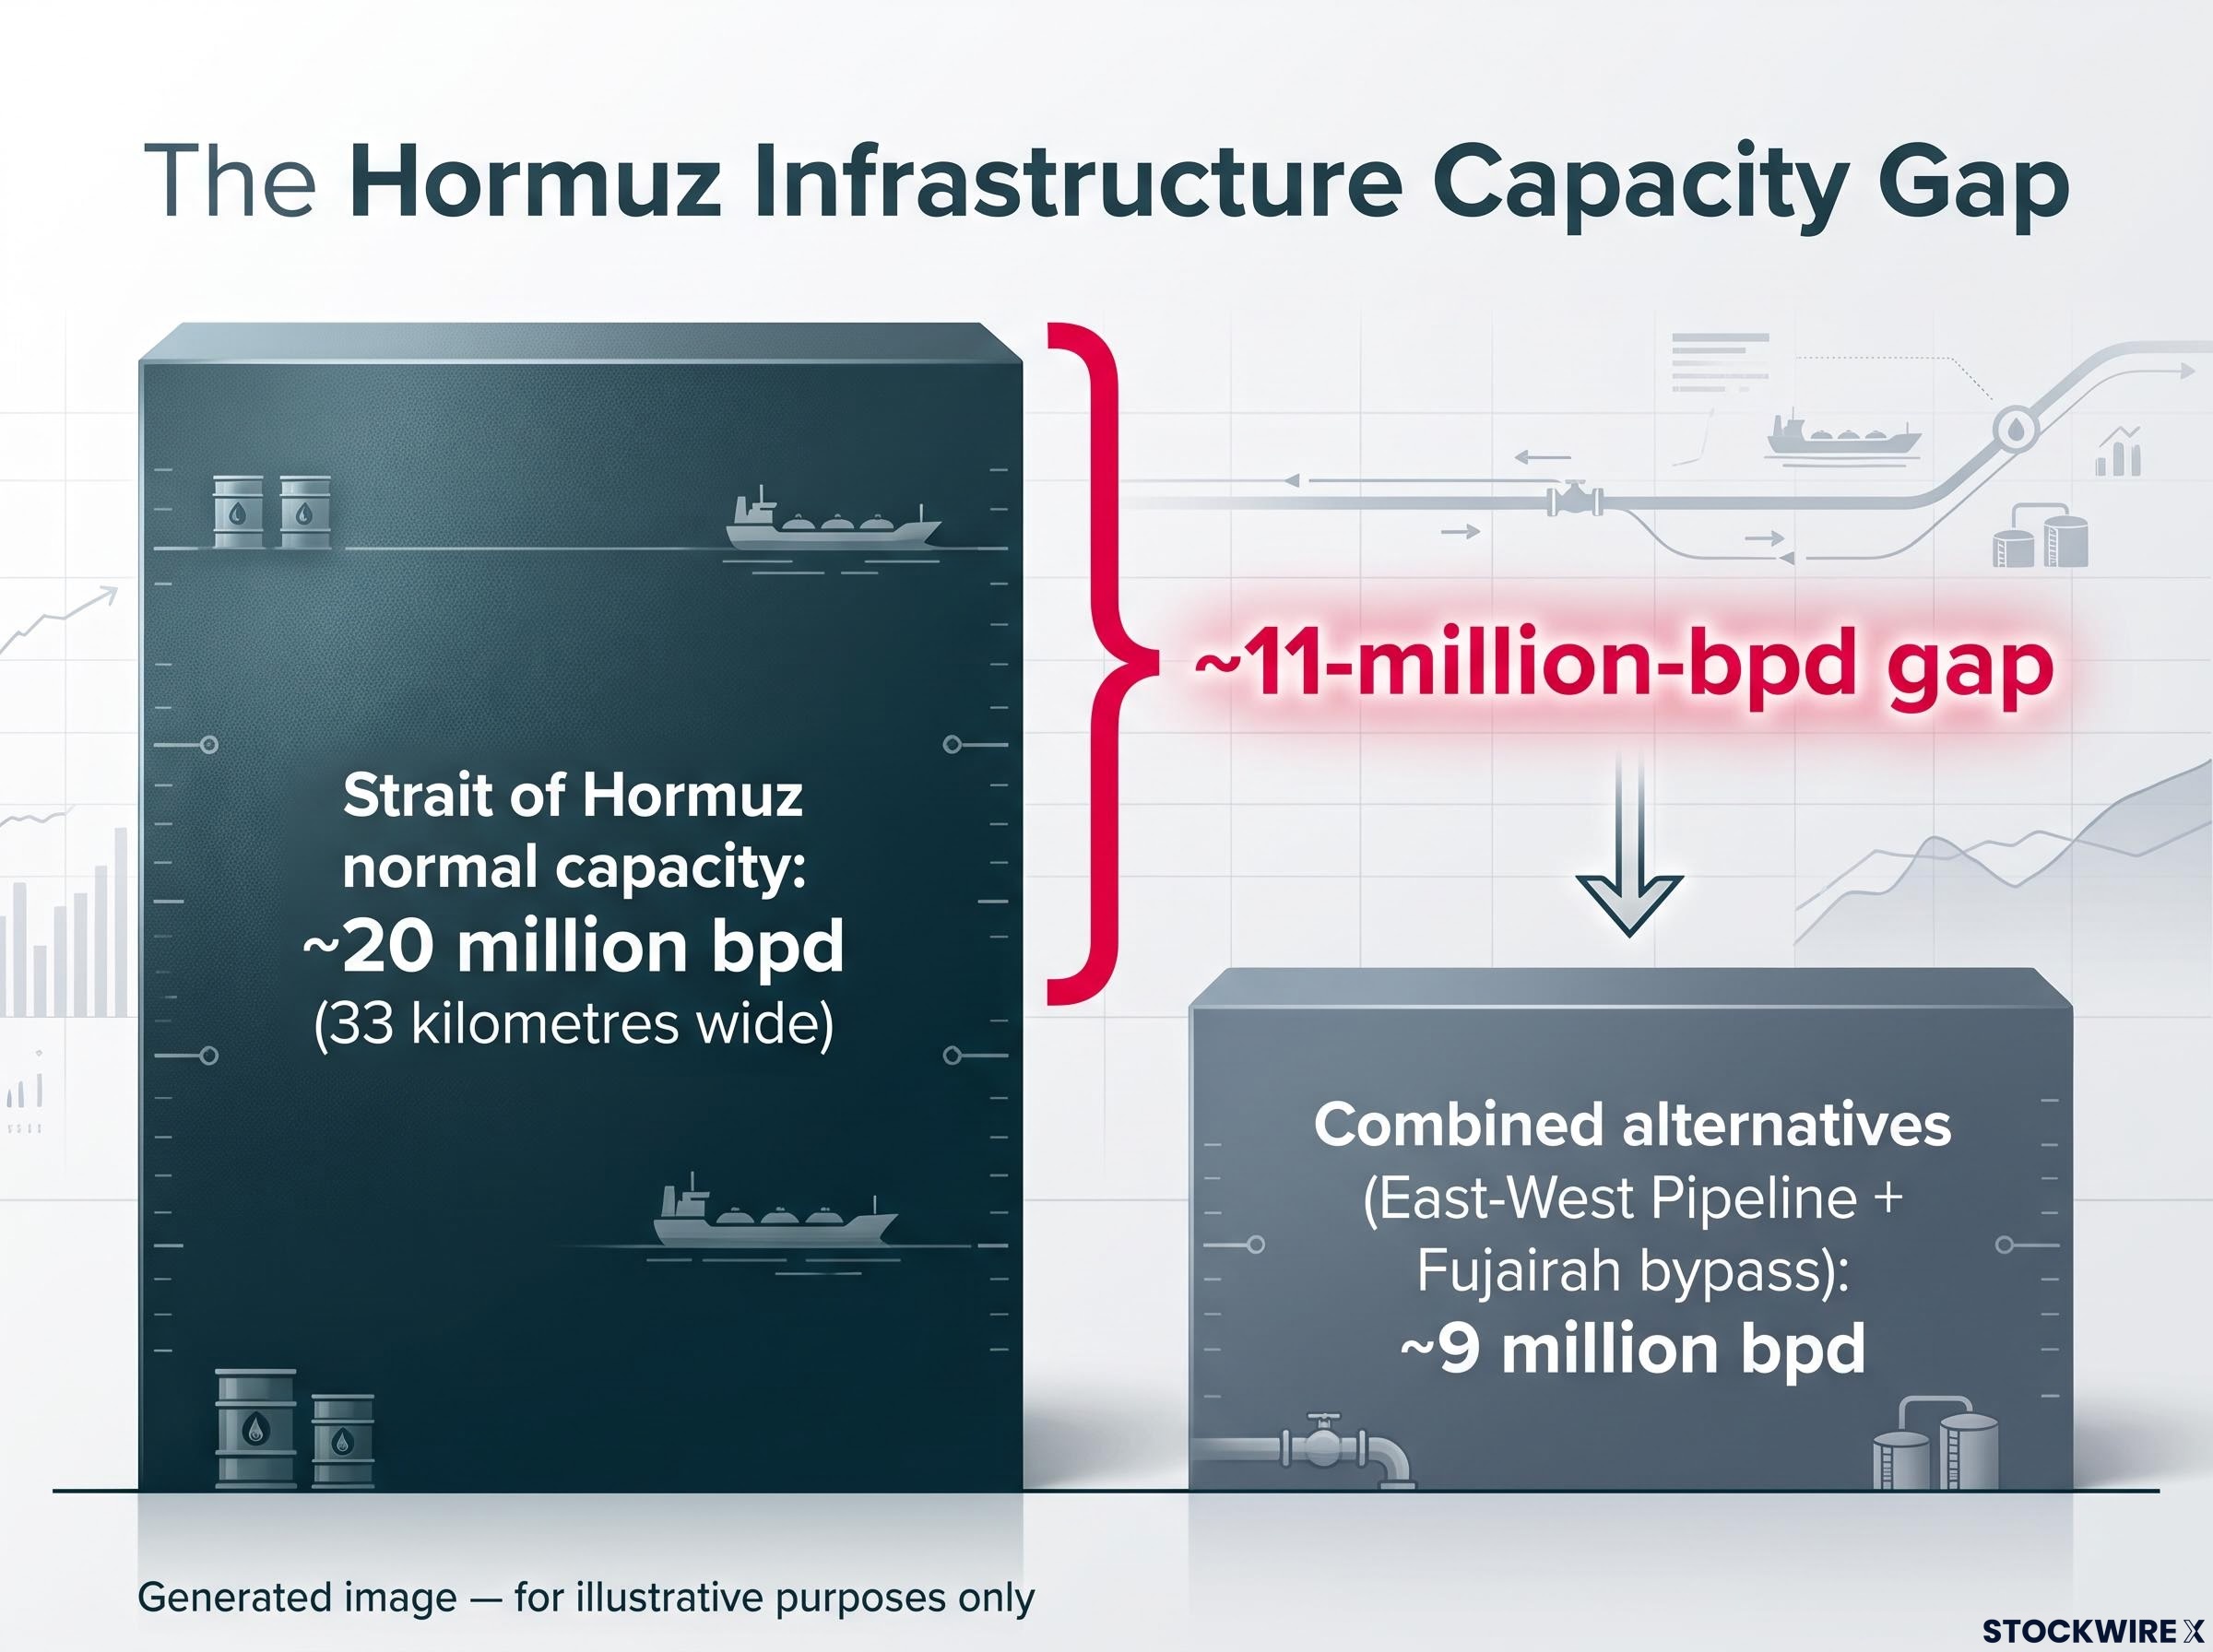
Before the conflict, approximately 20 million barrels per day of crude and condensate transited the Strait of Hormuz. That represents roughly 20% of all seaborne oil and liquefied natural gas (LNG) globally. LNG is natural gas cooled to liquid form for shipping.
Approximately 20% of the world’s seaborne oil and LNG moved through the Strait of Hormuz before the conflict. No alternative infrastructure comes close to replacing that capacity.
The strait itself is 33 kilometres wide at its narrowest navigable point, with usable shipping lanes considerably narrower still. Alternative infrastructure exists, but it cannot substitute for Hormuz at scale.
| Route | Normal capacity (bpd) | Current operational status |
|---|---|---|
| Strait of Hormuz | ~20 million | 5-12% of normal throughput |
| Combined alternatives (East-West Pipeline + Fujairah bypass) | ~9 million | Operational, but less than half of Hormuz capacity |
The roughly 11-million-bpd gap between what Hormuz normally carries and what alternatives can handle is the number that anchors every supply-risk premium currently baked into crude prices. Hold that figure in mind when evaluating how much further prices could move if conditions deteriorate rather than improve.
The bypass pipeline capacity available through Saudi Arabia’s East-West line and the UAE’s Habshan-Fujairah pipeline has been running at or near full utilisation, with eight supertankers tracked heading to Egypt’s Sidi Kerir terminal as evidence that workaround routes have become primary conduits rather than supplementary ones.
How oil prices have moved through six months of disruption
The price arc since February 2026 has not been a straight line, and each inflection point reveals something about how markets process geopolitical risk in real time.
| Period | Brent price | WTI price | Primary driver |
|---|---|---|---|
| March 2026 (peak) | Above $100 | Near $94 | Acute supply shock as Iran effectively closed the strait |
| Late June 2026 (trough) | Low- to mid-$70s | ~$70 | Partial war premium unwinding on temporary ceasefire |
| Mid-July 2026 (recovery) | Mid-$80s | ~$79-80 | U.S. naval blockade reimposition; flows constrained again |
| Mid-August 2026 (current) | Mid- to high-$80s | Low- to mid-$80s | Iran signalling ongoing restrictions; traffic at single-digit counts |
Prices have drifted lower even as traffic remains at 5-12% of pre-war norms. That is not complacency. It is markets balancing an already-embedded war premium against weakening demand and macro headwinds.
The mechanism is straightforward. Much of the geopolitical risk premium was embedded during the acute March 2026 phase, when Brent breached $100. The subsequent pullback reflects not a resolution of the disruption but the market’s partial absorption of it, combined with countervailing forces: softer global demand, macro uncertainty, and strategic reserve releases that have temporarily buffered the supply shortfall.
The near-term calendar carries no major oil-specific data releases, based on market reporting from FXStreet and Trading Economics. Accordingly, price direction in the short run is likely to be driven by geopolitical developments rather than fundamentals data.
Before concluding that the market has mispriced this disruption, consider that the paradox of softening prices alongside severely depressed traffic is the market doing two things at once: acknowledging the disruption is real while pricing the countervailing forces that have, so far, prevented a sustained move above $100.
What genuine traffic recovery would mean for energy markets
Genuine normalisation means a sustained return to approximately 120-140 vessels per day. Not sporadic transits by a handful of ships. Current traffic is achieving 5-12% of that target.
Six conditions would need to align simultaneously:
- Confirmed mine clearance and lane verification
- Sustained cessation of drone, missile, and mine threats
- War-risk insurance premiums returning toward normal levels
- Flag states and traffic controllers lifting extraordinary precautionary requirements
- Maritime unions and seafarers reclassifying Hormuz as a standard transit zone
- Unwinding of emergency Atlantic Basin supply arrangements
If those conditions align and traffic genuinely returns to pre-war levels, the market implications are directionally clear:
- Brent’s geopolitical risk premium would compress, exerting mild downward pressure on both benchmarks
- The Brent-WTI spread would narrow as Gulf barrels flow freely again
- Asian refiner margins, particularly for Japan, South Korea, India, and China, would benefit from cheaper, more predictable Gulf crude, reducing reliance on higher-cost Atlantic Basin alternatives
The asymmetry is worth understanding. Genuine normalisation would compress the premium modestly. Re-escalation toward full closure could push Brent back above $100. The tail risks are not balanced; the downside scenario reprices sharply, while the upside scenario offers only gradual relief. That asymmetry shapes the risk calculus for anyone with energy exposure right now.
A crisis in its quieter phase, but far from its final chapter
The strait is officially open. Vessel counts are running at 5-12% of pre-war norms. Prices have partially absorbed the shock, with Brent in the mid- to high-$80s. None of the six conditions required for genuine normalisation are yet in place.
Mid-August 2026 is a quieter phase, not a resolved one. Lower headline intensity does not equal lower risk. The variables that will determine how this resolves are specific and observable: vessel counts trending toward or away from the 120-140 per day threshold, the trajectory of insurance premiums, and the durability of Iran’s signalling on ongoing restrictions.
You now have the framework to read the next Hormuz headline with precision: to know whether a declaration of “open” reflects anything happening at the level of actual ship movements, and to assess what genuine recovery or genuine deterioration would mean for energy prices.
For readers wanting to understand why recovery may extend well beyond 2026, our dedicated guide to the 2027 supply normalisation timeline covers Saudi Aramco’s executive warnings, the structural weekly supply deficit the IEA emergency release cannot bridge, and what a multi-year recovery path means for crude price forecasts.
This article is for informational purposes only and should not be considered financial advice. Investors should conduct their own research and consult with financial professionals before making investment decisions. Forward-looking statements regarding oil prices and market conditions are speculative and subject to change based on geopolitical developments and market dynamics.