A report that was supposed to confirm stabilisation just became something more complicated. The University of Michigan’s August 2026 preliminary Consumer Sentiment Index drops today at 10:00 a.m. ET, and the data pipeline leading into it, covering oil prices, payrolls, and inflation expectations, points in one direction.
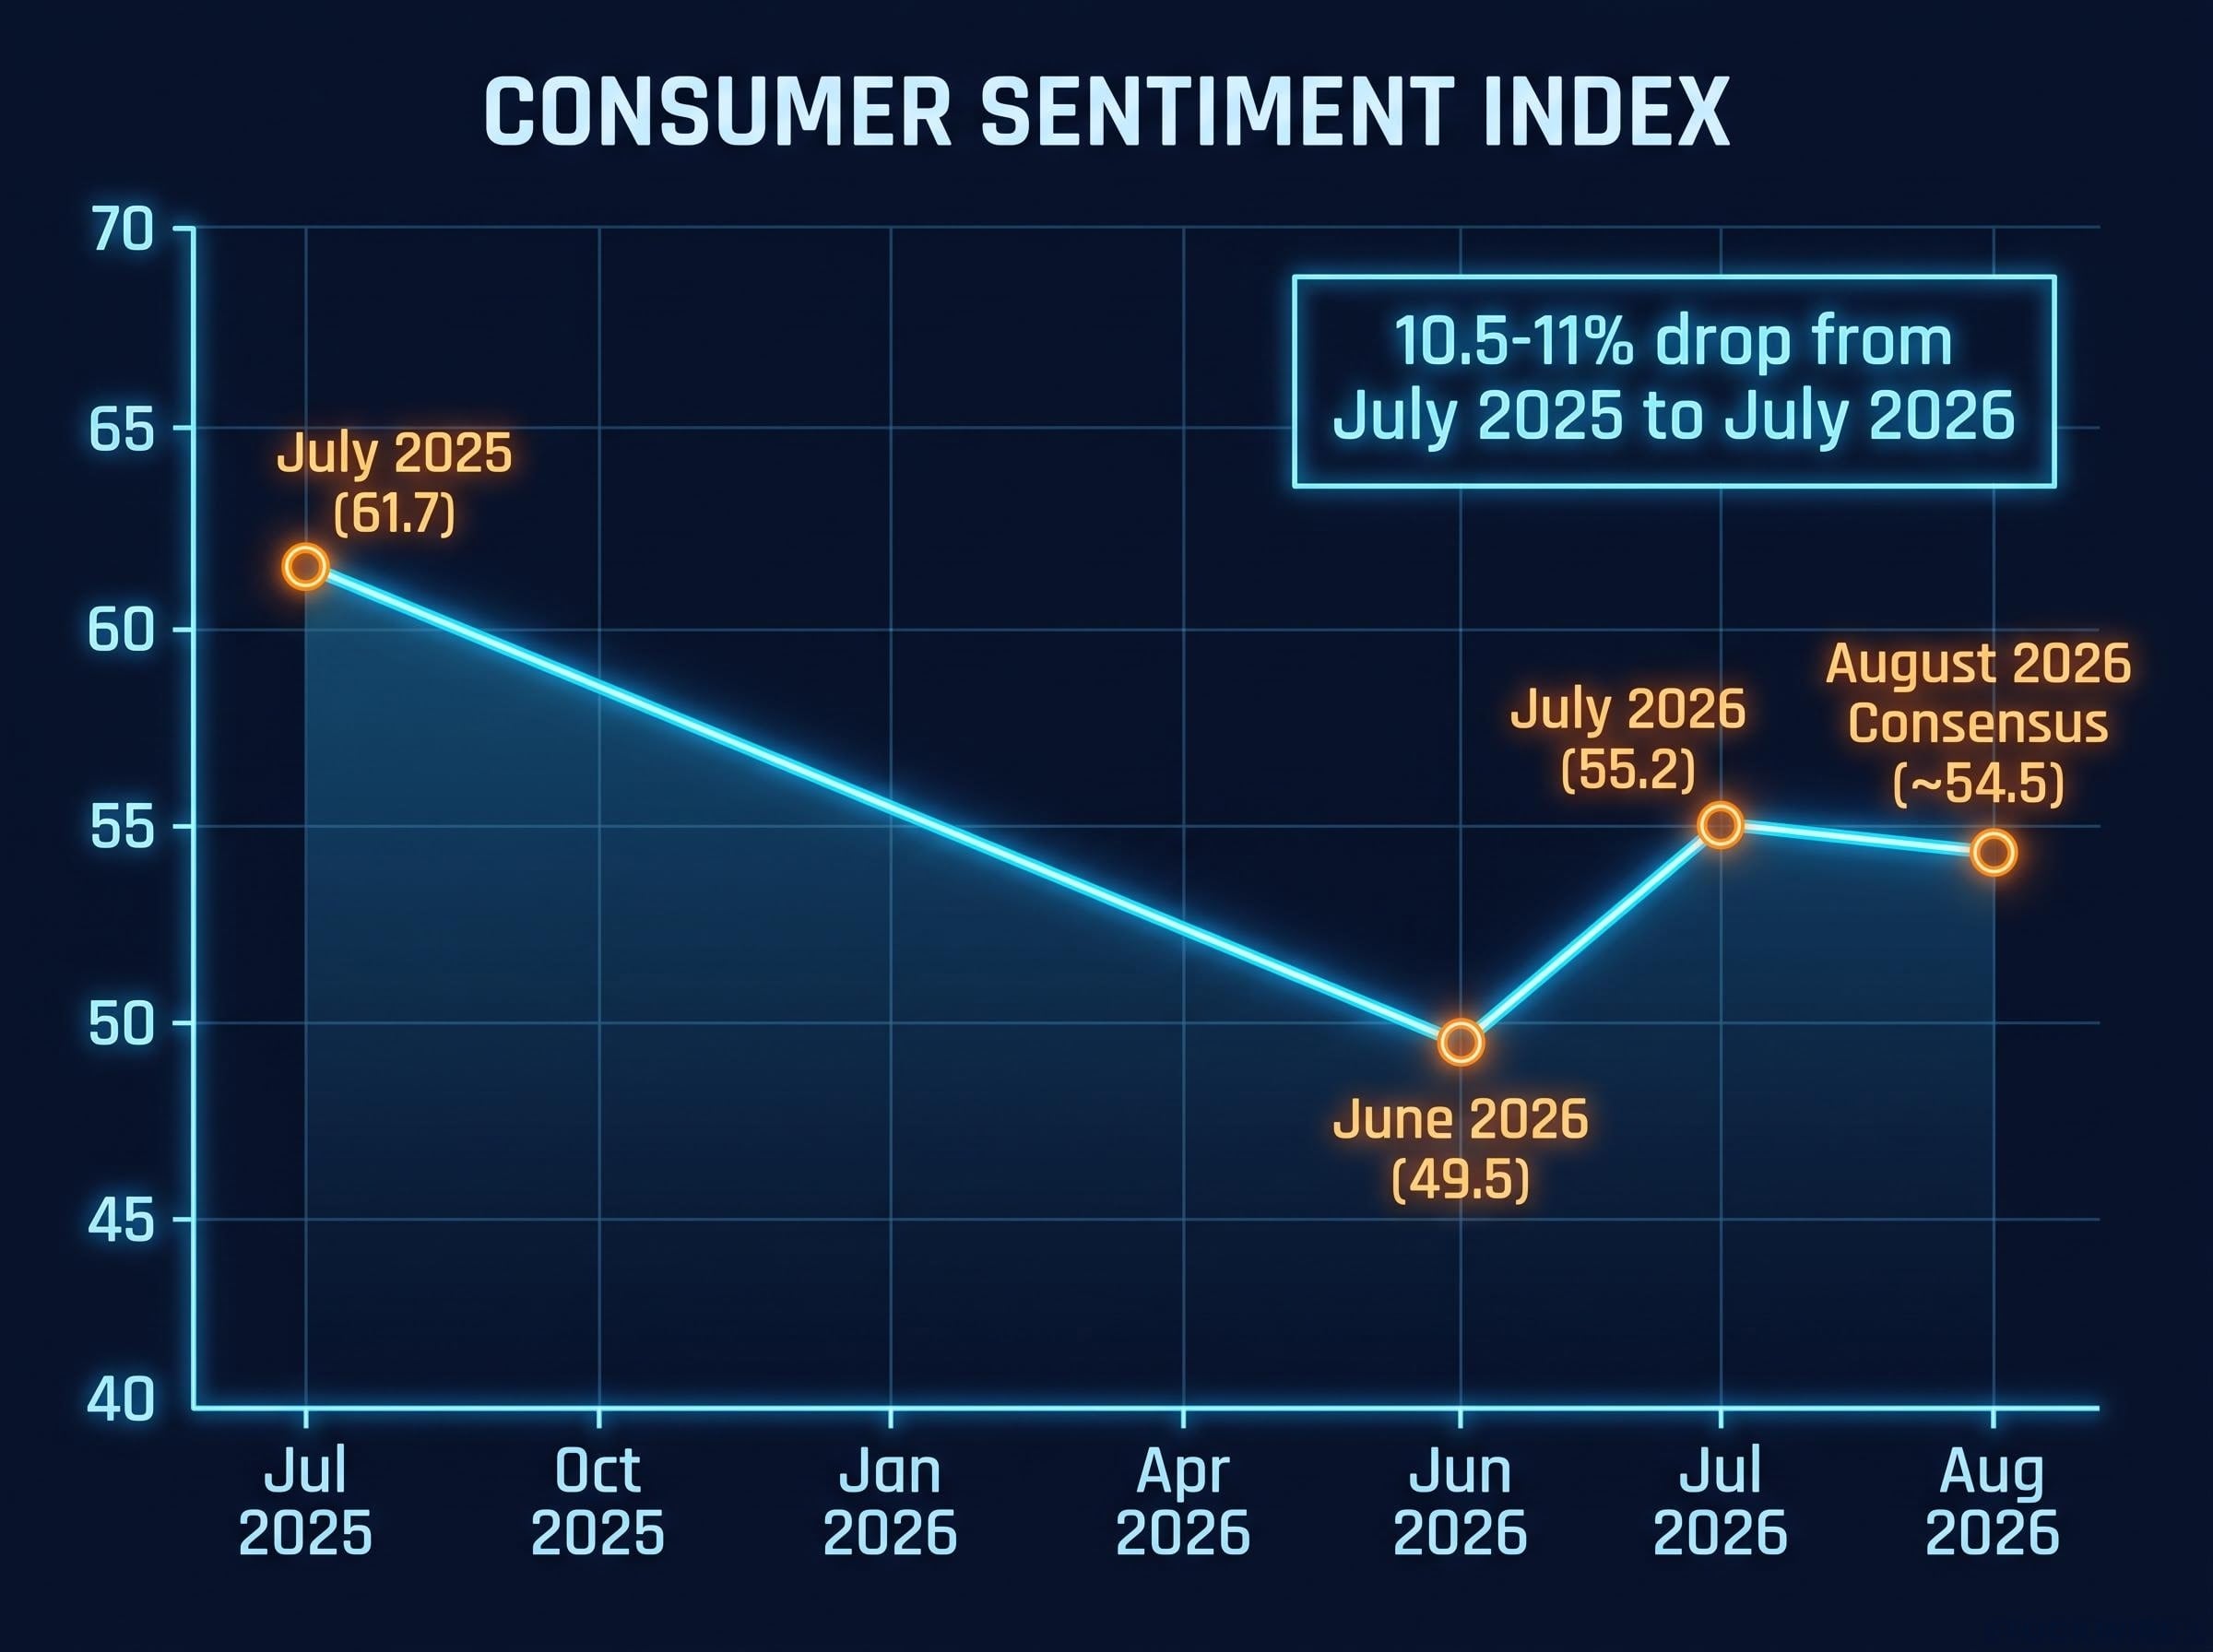
July’s final reading of 55.2 was itself only a partial recovery from June’s 49.5, which represented one of the worst sentiment prints in years. Energy prices have surged more than 15% since early July, July nonfarm payrolls recorded an unexpected net contraction, and short-term inflation expectations remain elevated. The August reading arrives with the consumer already under stress, not approaching stress from a comfortable baseline.
Here is what is driving the expected decline, what the specific numbers to watch at 10:00 a.m. ET actually mean, and how to think about positioning across equities, bonds, and commodities given a macro backdrop that is starting to look like stagflation in early form.
Key figures from the August sentiment report
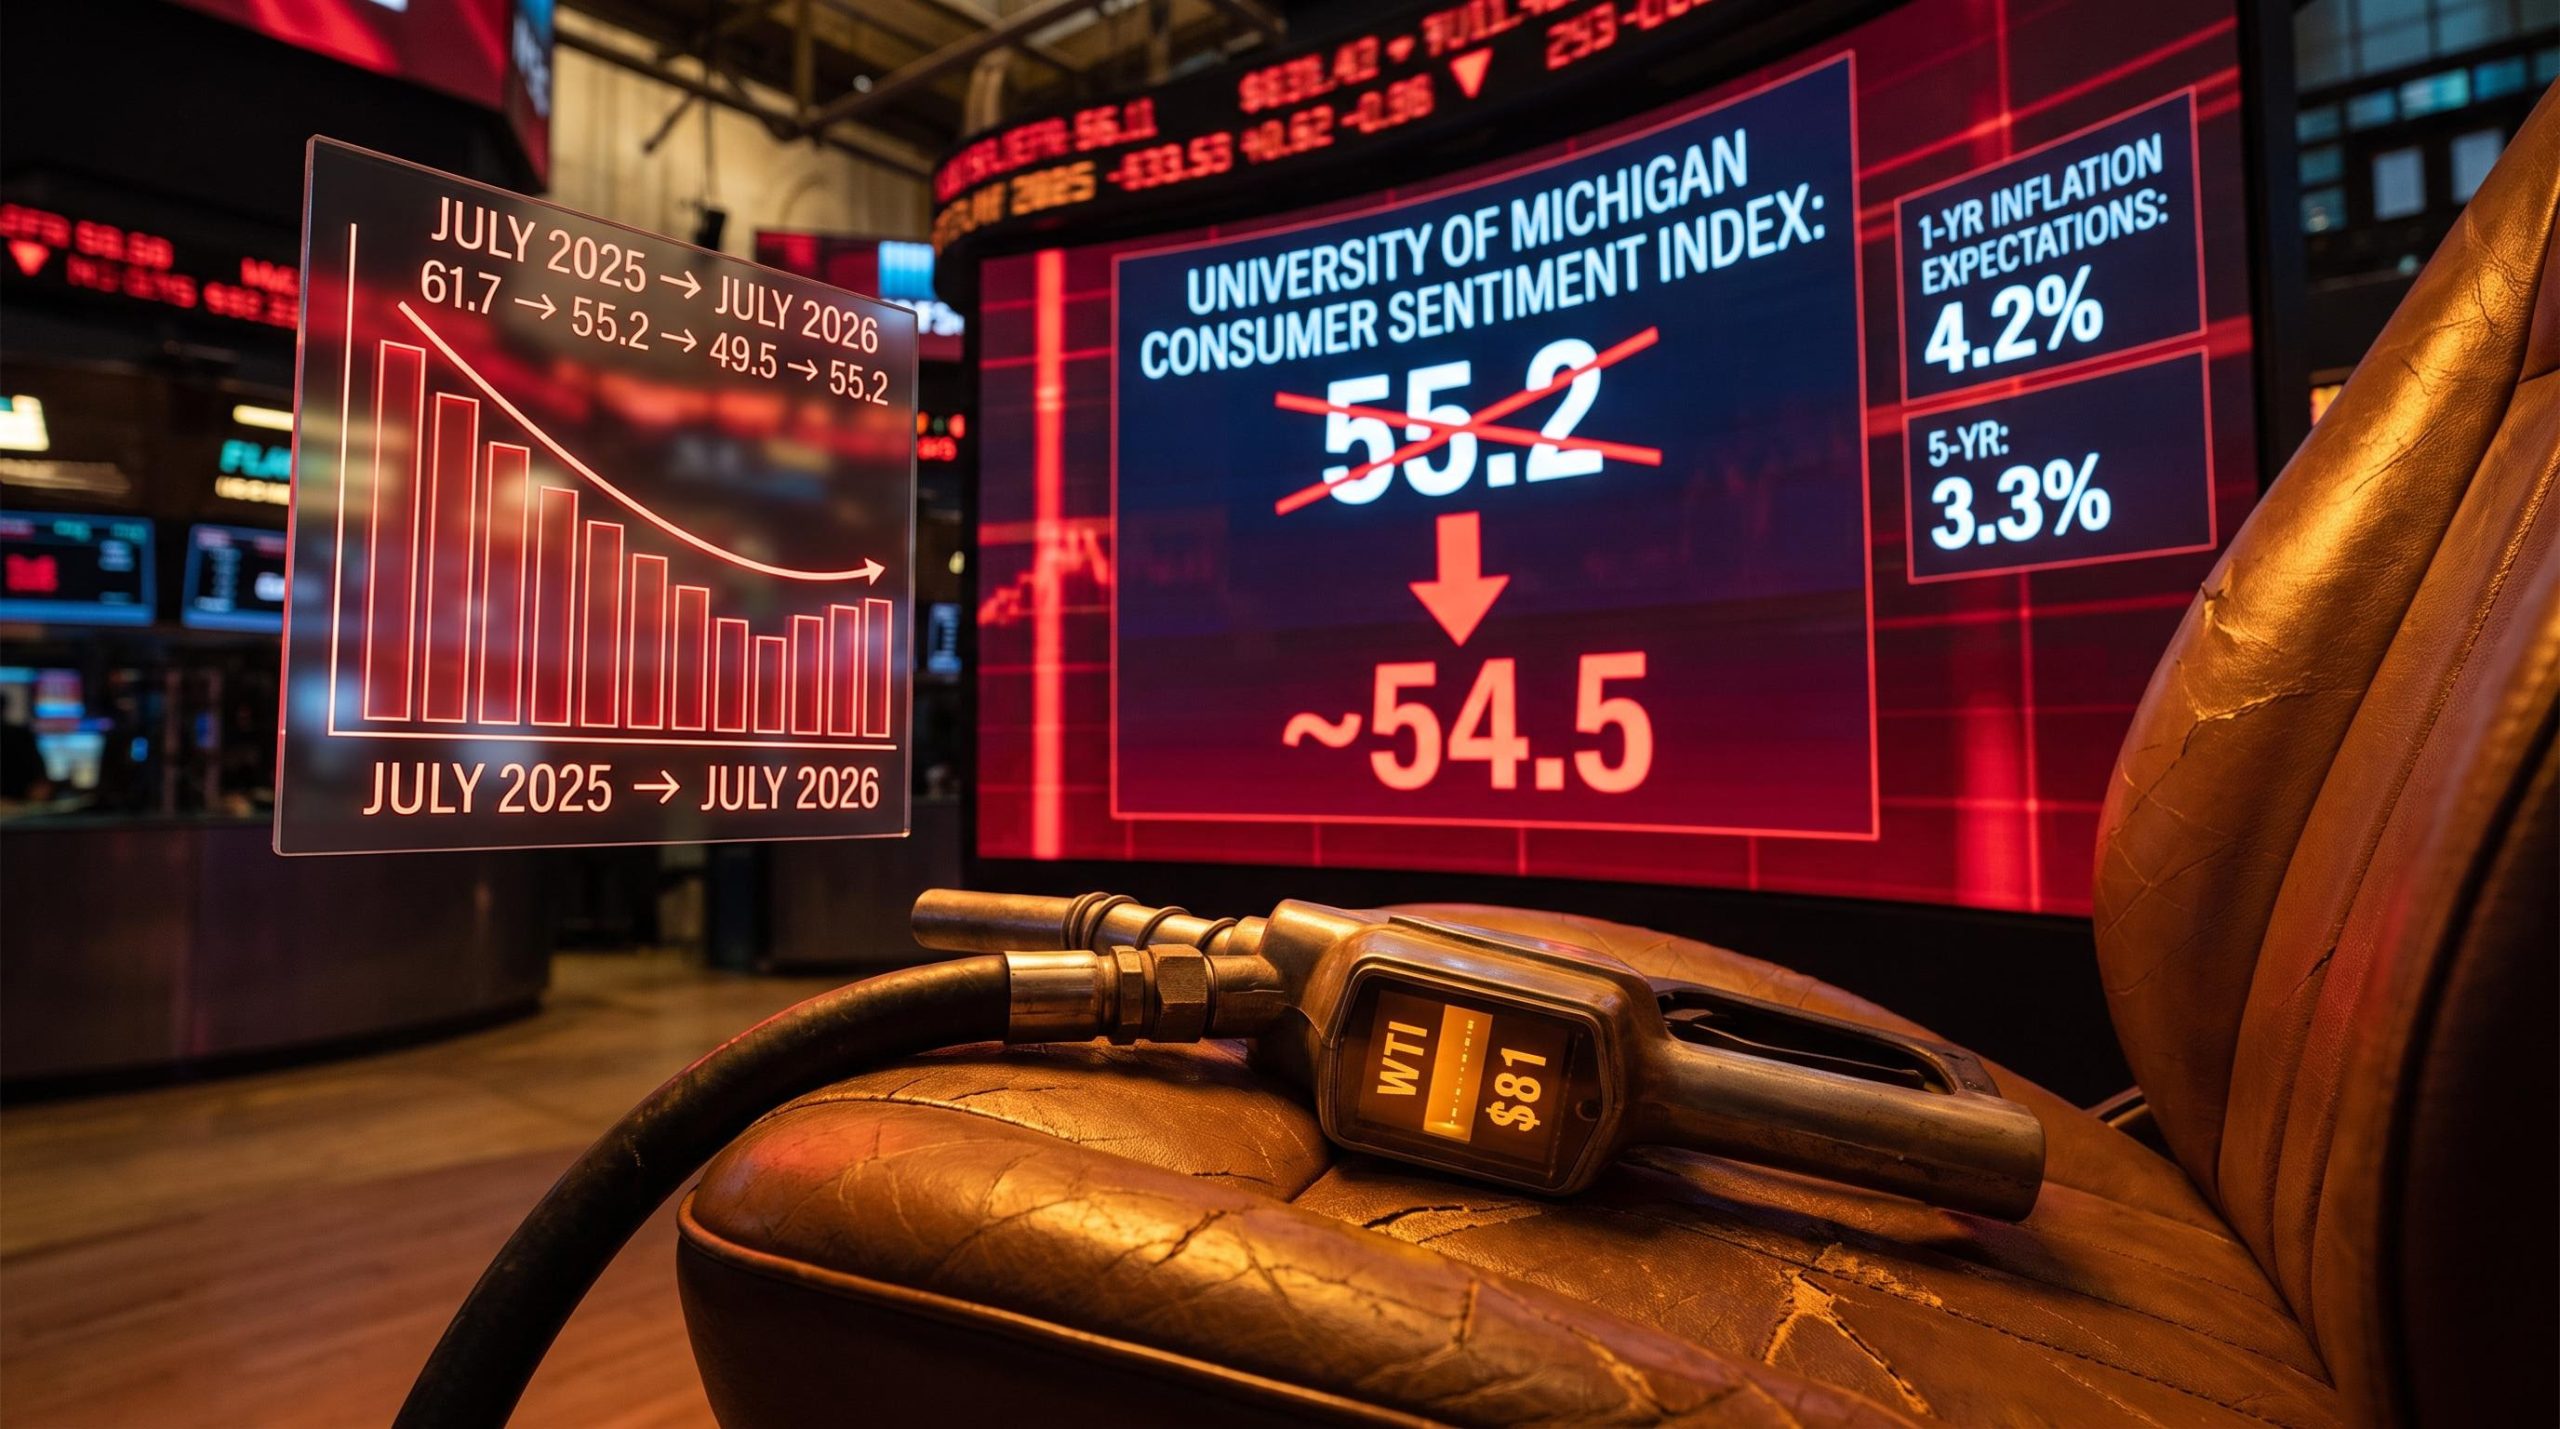
Market consensus places the preliminary August reading at around 54.5, a modest pullback from the 55.2 final figure recorded in July. That July figure was itself a bounce from June’s 49.5, a reading that marked one of the deepest troughs in the survey’s recent history. A year ago, in July 2025, the index stood at 61.7.
That year-over-year comparison is where the scale of the deterioration becomes clear.
The index has lost roughly 10.5-11% of its value compared to twelve months earlier, with the July 2026 partial rebound doing little to claw back the ground lost over the broader downtrend.
Today’s release also includes the Consumer Inflation Expectations survey. The two figures most likely to move markets are the 1-year inflation expectations reading (which came in at 4.2% for July, easing back from 4.6% the prior month) and the 5-year expectations reading (steady at 3.3% in July). Any re-acceleration in either series would complicate the rate-cut timeline that most risk assets are priced for.
| Metric | Reading |
|---|---|
| June 2026 final | 49.5 |
| July 2026 final | 55.2 |
| July 2025 (year-ago) | 61.7 |
| August 2026 consensus | ~54.5 |
| 1-year inflation expectations (July 2026) | 4.2% |
| 5-year inflation expectations (July 2026) | 3.3% |
Three threshold scenarios matter for how markets respond. A print in line with consensus, around 54-55, confirms fragility without shocking anyone. A reading below 53 signals that the energy and payrolls shocks have compounded rather than simply added to existing weakness, shifting the story from “fragile recovery interrupted” to “renewed deterioration.” Any upside surprise would require explaining against an environment that offers very little support for optimism.
When big ASX news breaks, our subscribers know first
How the Michigan survey actually works
The University of Michigan Survey of Consumers polls approximately 600 US households each month, historically by telephone with a transition toward web interviews in recent years. The questions cover three areas: current personal financial conditions, expected business conditions over the next one to five years, and buying conditions for major purchases such as vehicles and appliances.
Those responses produce three distinct outputs, and each one tells you something different:
- Headline Consumer Sentiment Index: The broadest measure, combining current and forward-looking assessments into a single number. This is the figure that makes headlines.
- Current Conditions sub-index: Captures how households feel about their finances right now. Most sensitive to immediate price shocks, particularly energy costs that show up every time you fill a tank or pay a utility bill.
- Consumer Expectations sub-index: Measures how households expect business and employment conditions to evolve. Most sensitive to labour market anxiety, layoff fears, and perceptions of job security.
The distinction between the two sub-indices matters because they point to different economic problems. Current Conditions tells you about today’s budget stress. Expectations tells you whether households are bracing for things to get worse.
The survey also produces the 1-year and 5-year inflation expectations readings that the Federal Reserve watches closely. The Fed tracks these specifically because embedded inflation psychology, once it takes hold, is harder to dislodge than headline price movements. Survey director Joanne Hsu has pointed to a prolonged period of elevated prices, stretching across roughly five years, as the root cause of depressed sentiment, arguing that this kind of deep-seated erosion of real purchasing power cannot be unwound by a month or two of modest improvement.
The Federal Reserve inflation expectations framework treats the Michigan survey’s 1-year and 5-year readings as active inputs into policy deliberations, with Fed Governor Adriana Kugler noting in April 2025 that anchoring household expectations at 2% remains a prerequisite for sustained price stability.
Oil prices and a choked strait: what energy is doing to households
WTI crude was running at levels more than 15% higher than those seen in early July 2026 for much of the window when August survey respondents were being interviewed. By mid-August, prices had retreated somewhat, with WTI settling around $81 per barrel and Brent at approximately $87 per barrel, easing from late-July highs. But “eased from highs” is not the same as “returned to normal.”
The price alone does not explain why this energy shock cuts deeper than others. The structural detail does.
Vessel traffic through the Strait of Hormuz has fallen sharply, averaging around 14 crossings per day in August 2026 against a pre-conflict daily figure of approximately 120, leaving the chokepoint operating at a fraction of its former capacity.
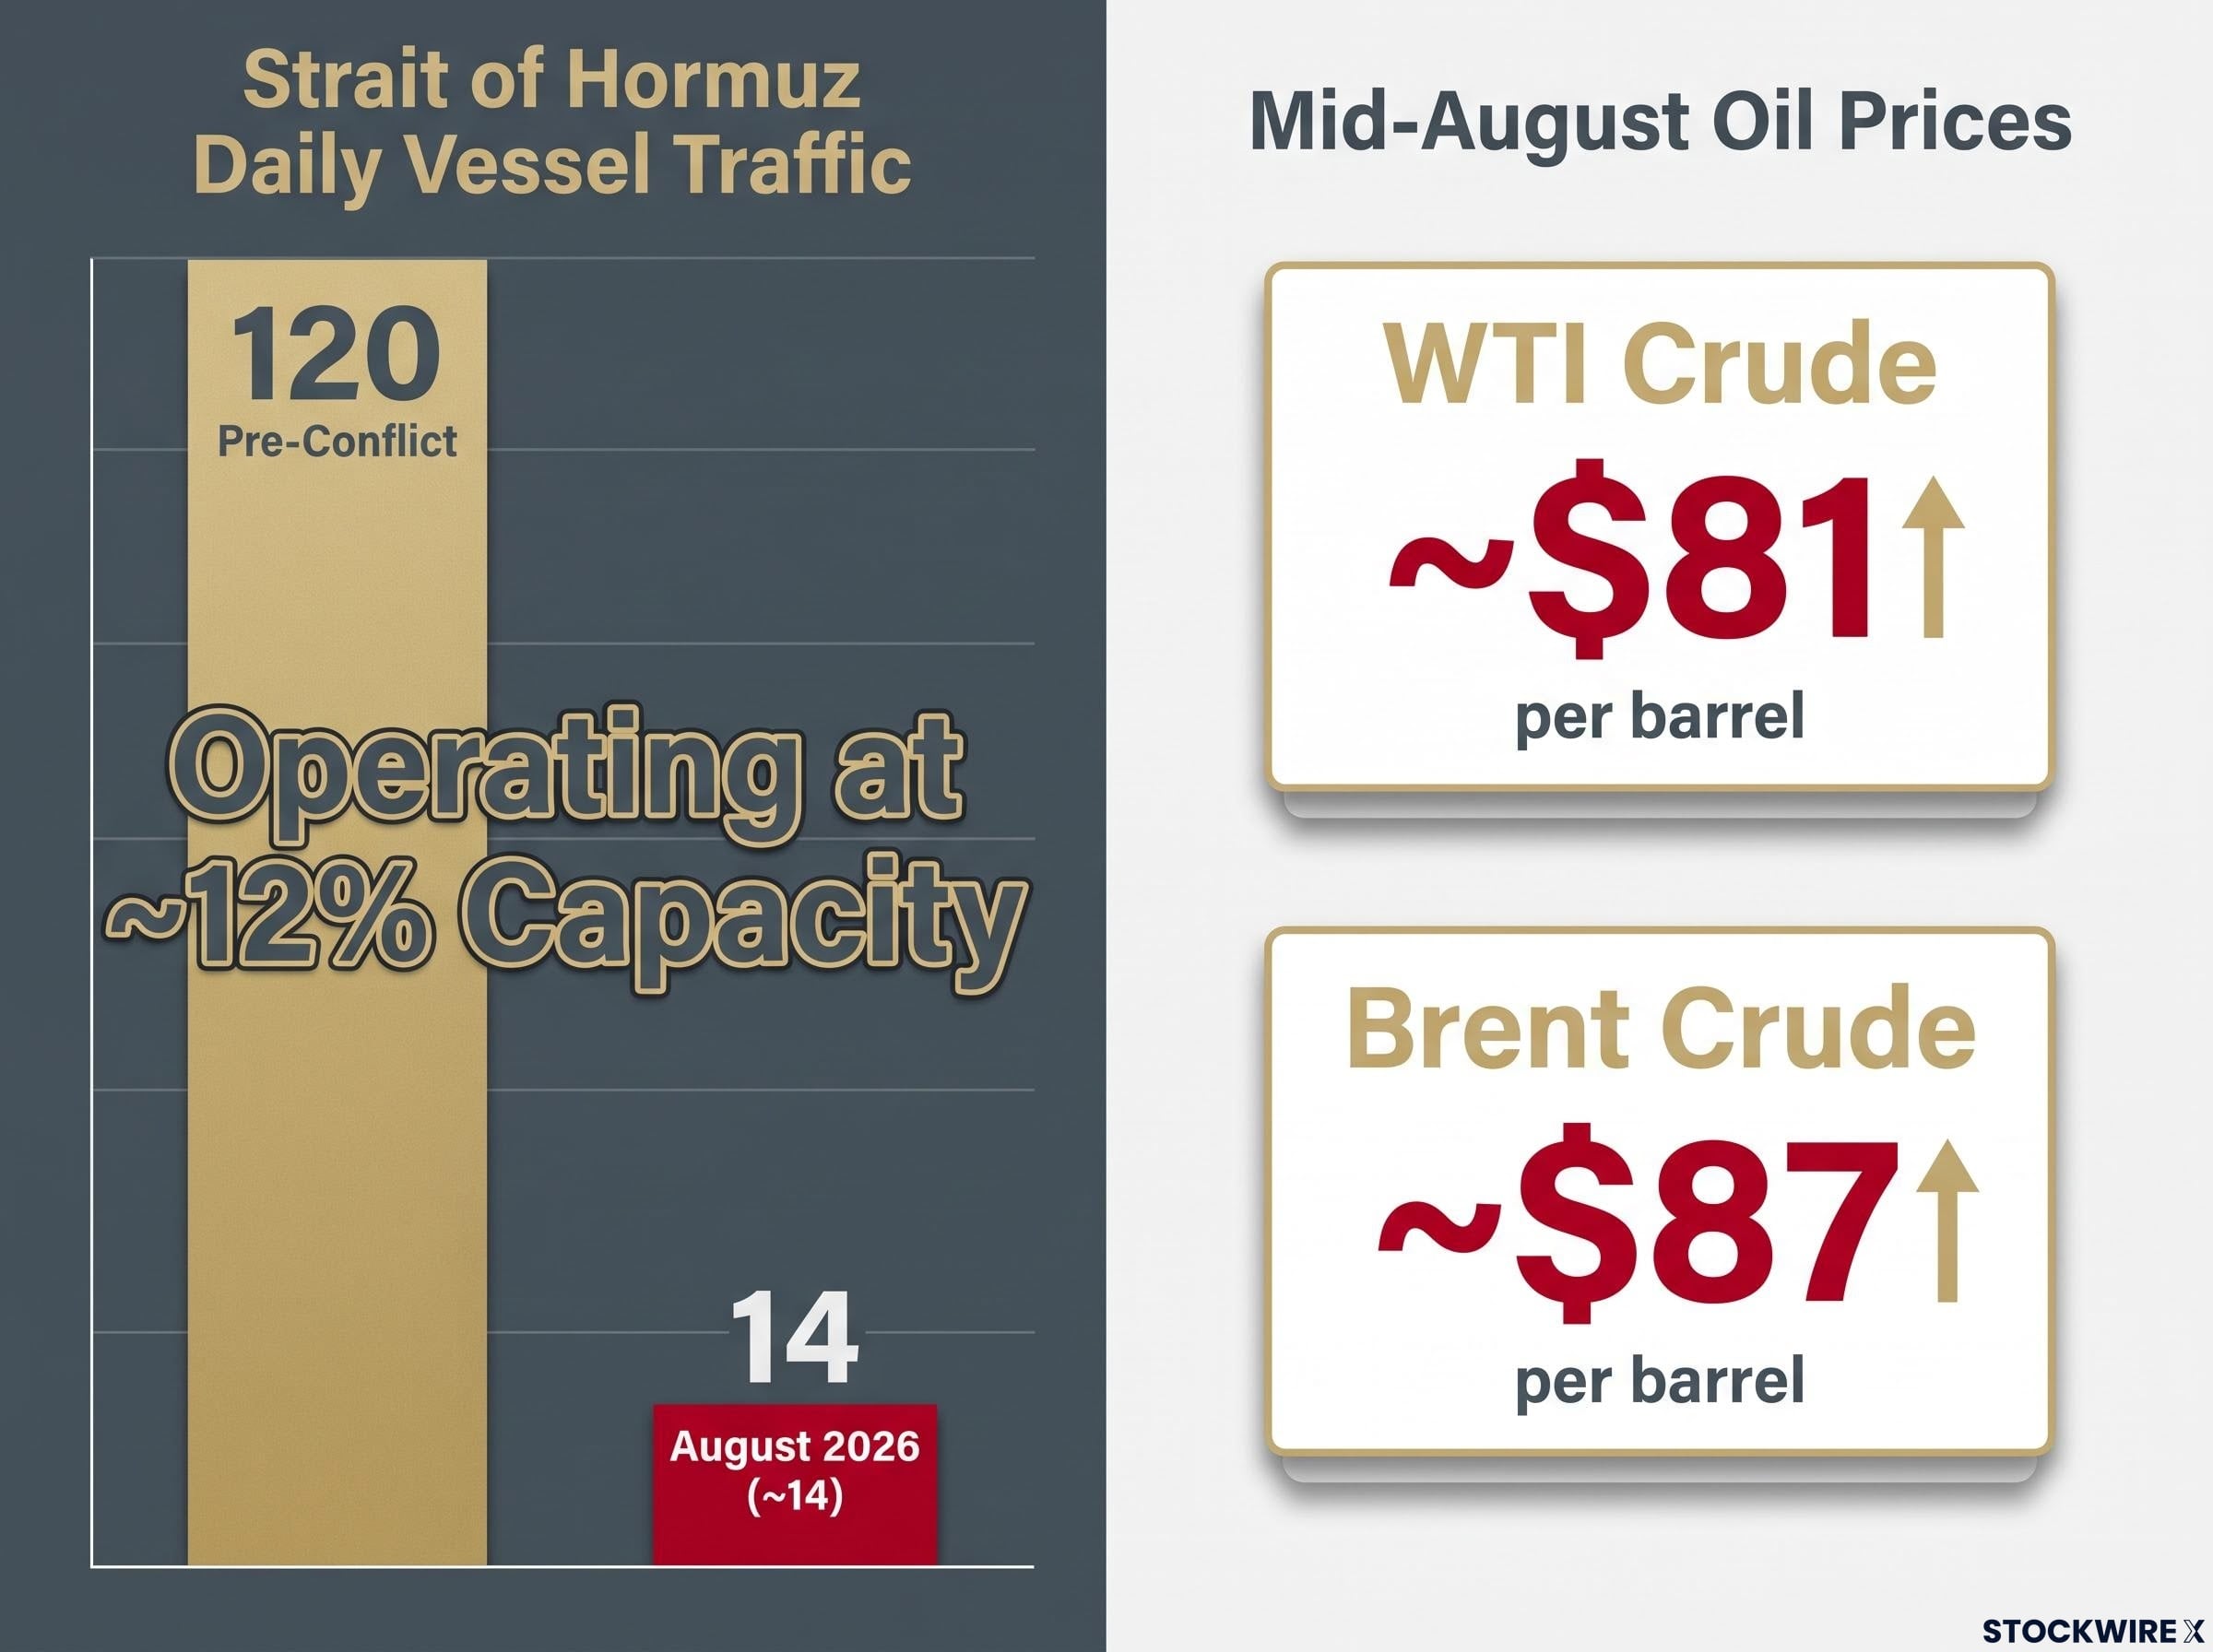
That is not a speculative supply scare. That is a physical chokepoint operating at roughly 12% of its pre-conflict capacity. The difference between a temporary price spike and a sustained supply disruption is the difference between a few weeks of grumbling at the pump and a persistent drag on household budgets that reshapes spending behaviour for quarters.
Why energy punches above its weight on sentiment
Fuel costs are a disproportionate driver of how consumers perceive inflation, well beyond their actual share of household budgets. Petrol prices are visible, daily, and unavoidable. They act as a psychological anchor for whether inflation “feels” like it is getting better or worse. Reuters reporting from June 2026 highlighted that households remained worried about conflict-driven inflation persisting beyond fuel prices, spreading into food and services.
Research on energy costs and sentiment distortion shows that gasoline accounts for only around 3% of average household expenditure yet functions as a real-time economic scoreboard, giving fuel price swings an outsized influence on survey readings well beyond their actual budget weight.
For anyone holding consumer discretionary equities or assessing retail earnings risk, the question is not what crude costs today. The question is whether this is a transitory spike or an ongoing structural squeeze on disposable income. The Strait of Hormuz data answers that question clearly: this is structural, and relief depends on a geopolitical resolution that has not arrived.
The payrolls contraction and what it adds to the picture
High inflation is a familiar concern. High inflation combined with job losses is a structurally different problem.
The July 2026 nonfarm payrolls report delivered a surprise net decline in employment, marking not just a slowdown in hiring but an outright contraction in jobs. That distinction matters enormously for how consumers respond. When people in your network start losing jobs, or when the evening news shifts from “hiring is slowing” to “employers are cutting,” willingness to spend on anything non-essential drops sharply, often before your own employment situation changes.
- US headline CPI in July 2026: 3.4% year-over-year, running roughly a full percentage point above where it stood in January and February 2026 before the conflict drove energy costs higher
- Nonfarm payrolls in July 2026: unexpected net contraction, the first net job loss of the cycle
- Pre-conflict CPI baseline (January-February 2026): approximately 2.4% year-over-year
The Expectations sub-index is expected to bear the brunt of the sentiment decline, because that is where labour market anxiety registers most directly.
Slow or negative employment growth alongside still-elevated prices represents a structurally different challenge than inflation alone. The combination has a specific name: stagflation. And it complicates Fed policy in a specific way.
The simultaneous presence of a payrolls contraction and CPI running a full percentage point above its pre-conflict baseline puts the Fed in a position where easing to support growth risks re-accelerating inflation. That means the rate-cut path that most portfolios are priced for may not materialise on the expected timeline, a problem that sits at the centre of nearly every asset allocation decision right now.
The stagflation threat to equity portfolios was already visible in late July 2026, when Barclays strategists warned that the supply-side character of the current episode makes it structurally different from the demand-driven inflation playbook that most portfolio models were built around.
What weak sentiment signals for spending, growth, and corporate earnings
Consumer sentiment is not a soft data curiosity. It is a leading indicator of hard economic outcomes, and the transmission mechanism is direct.
The GDP connection
Personal consumption expenditures account for approximately 68% of US GDP. When households pull back, the effects ripple outward: retail sales weaken, corporate revenues compress, and eventually companies respond by cutting capital expenditure and hiring, which depresses sentiment further.
The categories most vulnerable to a sentiment-driven pullback are the ones that households cut first when confidence falls:
- Durables (furniture, appliances)
- Autos
- Consumer electronics
- Travel and leisure
- Discretionary retail
Survey director Joanne Hsu has described a consumer base mired in pessimism, with the weight of roughly five years of elevated inflation bearing down on household confidence. The index sits approximately 10.5-11% below its July 2025 reading even after accounting for the partial rebound recorded last month.
If August confirms renewed weakness after only a brief improvement from June’s lows, the pattern suggests structural pessimism rather than a cyclical blip. A consumer sector that has been depressed for five-plus years and is now facing a fresh energy and labour shock is not in the same position as one experiencing a one-quarter dip. The difference matters for how much recovery to expect and when. Historically, sentiment deterioration at these levels aligns with below-trend GDP growth in subsequent quarters.
Equities, bonds, commodities, and the dollar: positioning after the print
The framework below maps each threshold scenario to specific asset class implications, so you can use it regardless of what the number shows at 10:00 a.m. ET.
Equities: discretionary bears the brunt
Consumer discretionary names, including retailers, automakers, leisure, and consumer electronics, are directly exposed to sentiment and spending cuts. A sub-53 reading would be a clear negative signal for discretionary earnings outlooks, typically triggering analyst revision cycles within days. Consumer staples offer more resilience, though margins remain exposed to energy and input cost pressure.
| Asset class | Primary risk from a weak print | Key data point to watch |
|---|---|---|
| Equities (discretionary) | Earnings downgrades as spending forecasts are cut | Sub-53 headline reading |
| Fixed income | Duration risk from conflicting growth and inflation signals | 1-year inflation expectations (above 4.5%) |
| Energy commodities | Amplifies macro risk via the sentiment-spending feedback loop | WTI and Brent trajectory post-print |
| USD | Growth deterioration narrative undermines medium-term support | Sentiment-inflation expectations combination |
Fixed income, commodities, and the dollar
The bond market faces a genuine tension. Softening growth and labour data argue for easier policy and lower yields. But elevated or re-accelerating inflation expectations argue for higher term premia. If the 1-year inflation expectations reading moves back toward 4.5-4.8%, the market will price in fewer or later rate cuts, keeping duration uncomfortable and curve volatility elevated.
Energy exposure can serve as an inflation hedge, but it also amplifies macro risk: a further crude spike would deepen the sentiment slump and worsen earnings for most non-energy sectors, making it a complicated diversifier rather than a clean one.
The dollar faces geopolitical safe-haven demand on one side and a deteriorating US growth narrative on the other. A sharp downside sentiment surprise combined with rising inflation expectations could increase uncertainty rather than give the dollar a clear directional push.
The asset class most at risk from a miss today is not the one with the most direct sentiment exposure. It is the one priced for a rate-cut path that a stagflation signal could push further into the future, which points squarely at rate-sensitive growth equities and long-duration bonds.
Fed policy and stagflation have been in direct conflict since at least May 2026, when the FOMC held rates for a fifth consecutive meeting while JPMorgan raised its stagflation scenario probability to 35%, a dynamic that has only intensified as the payrolls and energy data have moved further in the wrong direction.
After the print: what the trend will tell you that the number cannot
The August print matters less as a single data point than as confirmation or denial of a pattern. One month of improvement in July did not reverse five years of accumulated pessimism. If August slips back, the pattern becomes the signal.
Three variables will shape whether this is a short or extended pessimism cycle: the trajectory of the Middle East conflict and Strait of Hormuz shipping, the direction of the September payrolls report, and whether 1-year inflation expectations stabilise or drift back toward 4.5% and above.
For investors wanting to decode the next payrolls release in full, our dedicated guide to reading the NFP report covers wages, revisions, and the cross-asset reactions that typically follow, explaining why headline job numbers are often the least useful figure in the release.
In an environment where the Fed cannot cleanly choose between supporting growth and anchoring inflation, the consumer sentiment series becomes more important as a leading indicator, not less. It captures the household behaviour that will resolve that tension before the Fed’s own data does.
This article is for informational purposes only and should not be considered financial advice. Investors should conduct their own research and consult with financial professionals before making investment decisions. Past performance does not guarantee future results. Financial projections are subject to market conditions and various risk factors.