Commonwealth Bank of Australia is about to report approximately A$10.85 billion in cash profit for FY26. At a forward price-to-earnings ratio of roughly 25x, that number is already priced. The headline will confirm what the market already expects. What it cannot confirm is whether the assumptions embedded in that multiple are still intact.
The 12 August 2026 result arrives with an unusually charged backdrop. CBA shares rallied 12.2% across two sessions in February after a strong first-half print, then collapsed 10.43% in a single day in May when a quarterly trading update flagged a $200 million provision build. That is not normal volatility for a $300 billion bank. It is the volatility of a stock whose valuation leaves no room for ambiguity on the metrics that matter.
This analysis gives you a framework for reading the August result beyond the profit headline. Two metrics, provisions and net interest margin, will determine whether A$177.82 is cheap, fair, or the wrong side of a re-rating. Here is what each signal means and how to position your thinking before the numbers land.
What the consensus is actually expecting on 12 August
Analysts expect CBA to deliver full-year cash net profit after tax (NPAT), the profit measure banks use to strip out one-off accounting items, of approximately A$10.85 billion. That compares to A$10.25 billion in FY25, representing roughly 6% year-on-year growth. It is a credible number, not an ambitious one.
The first-half result of A$5.445 billion (up 6% year-on-year) set the trajectory. The unaudited third-quarter cash NPAT of approximately A$2.7 billion (up 4% year-on-year) showed a slight step-down in quarterly run-rate. That softening tells you the second half has been tracking a little below the first, meaning the full-year number should land close to consensus rather than materially above it. Any upside surprise will need to come from outside the profit line.
What the dividend consensus implies
The interim dividend of A$2.35 per share (fully franked) has already been paid. Consensus points to a full-year total of approximately A$5.05, up from A$4.85 in FY25, implying a final dividend of roughly A$2.65. That keeps the payout ratio in the 70-75% range, consistent with recent history.
| Metric | FY25 Actual | FY26 Consensus | Change |
|---|---|---|---|
| Cash NPAT | A$10.25b | ~A$10.85b | ~+6% |
| Full-year DPS | A$4.85 | ~A$5.05 | ~+4% |
| NIM (1H) | 2.08% | 2.04% | -4 bps |
| Provision build | — | A$200m added (May) | Negative signal |
When big ASX news breaks, our subscribers know first
How the provisioning line displaced profit as the market’s primary signal
At 25x earnings, headline profit is already substantially priced in. A small beat or miss on the cash NPAT number, say A$10.9 billion instead of A$10.85 billion, is unlikely to shift the investment thesis. The market needs something more specific to move on, and in May it found exactly that.
When CBA released its March-quarter trading update on 13 May 2026, the headline quarterly cash NPAT of approximately A$2.7 billion (up 4% year-on-year) was broadly in line with expectations. What the market focused on instead was an A$200 million addition to provisions, attributed to “elevated geopolitical and macro uncertainty.” The profit result was secondary. CBA shares dropped 10.43% that session, one of the sharpest single-day declines the stock had recorded.
The May trading update revealed a 1% sequential decline in quarterly cash profit against the first-half average, and the market’s reaction, a 10.43% single-session fall, established the provisioning line as the dominant re-rating variable heading into August.
The RBA Financial Stability Review from April 2025 assessed Australian banks as holding strong capital buffers and adequate liquidity, a baseline that makes a sustained, system-wide credit deterioration less likely but does not preclude institution-level provisioning decisions driven by forward-looking macro caution.
The 10.43% fall on 13 May stands as one of the most severe single-session moves CBA has recorded in recent years. The share price did not react to a profit shortfall; it repriced on a provisioning decision that investors interpreted as a potential shift in the trajectory of credit quality.
The mechanism will repeat on 12 August. What matters is the loan impairment line, and the interpretive fork is straightforward:
- Flat or released provisions signal the May build was conservative caution, and the premium valuation can hold. The balance sheet stress was anticipated, not realised.
- A further provision build signals the start of a genuine credit-cycle turn. That is incompatible with a 25x multiple on a bank, and the re-rating would be swift.
The May selloff demonstrated that at this valuation, the market will reprice CBA on provisions faster and more severely than on profit. The loan impairment line on 12 August carries more share-price consequence than the headline cash NPAT number sitting beside it.
The mechanics of a 25x multiple on a mature bank
A forward price-to-earnings ratio, or P/E, tells you how many dollars investors are willing to pay for each dollar of expected profit. A 25x P/E means you are paying $25 for every $1 of anticipated earnings. On a mature, regulated bank, that is an unusual number, and it implies a specific set of bets.
CBA’s forward P/E of approximately 25x at around A$177-178 compares to peers sitting materially lower.
The three core bank valuation metrics, NIM, ROE, and CET1, sit beneath every multiple comparison in this analysis; CBA’s NIM of 1.97% and ROE of 14.3% illustrate precisely the scale and funding advantages that regional peers cannot replicate, and those structural gaps are what the 25x multiple is ultimately pricing.
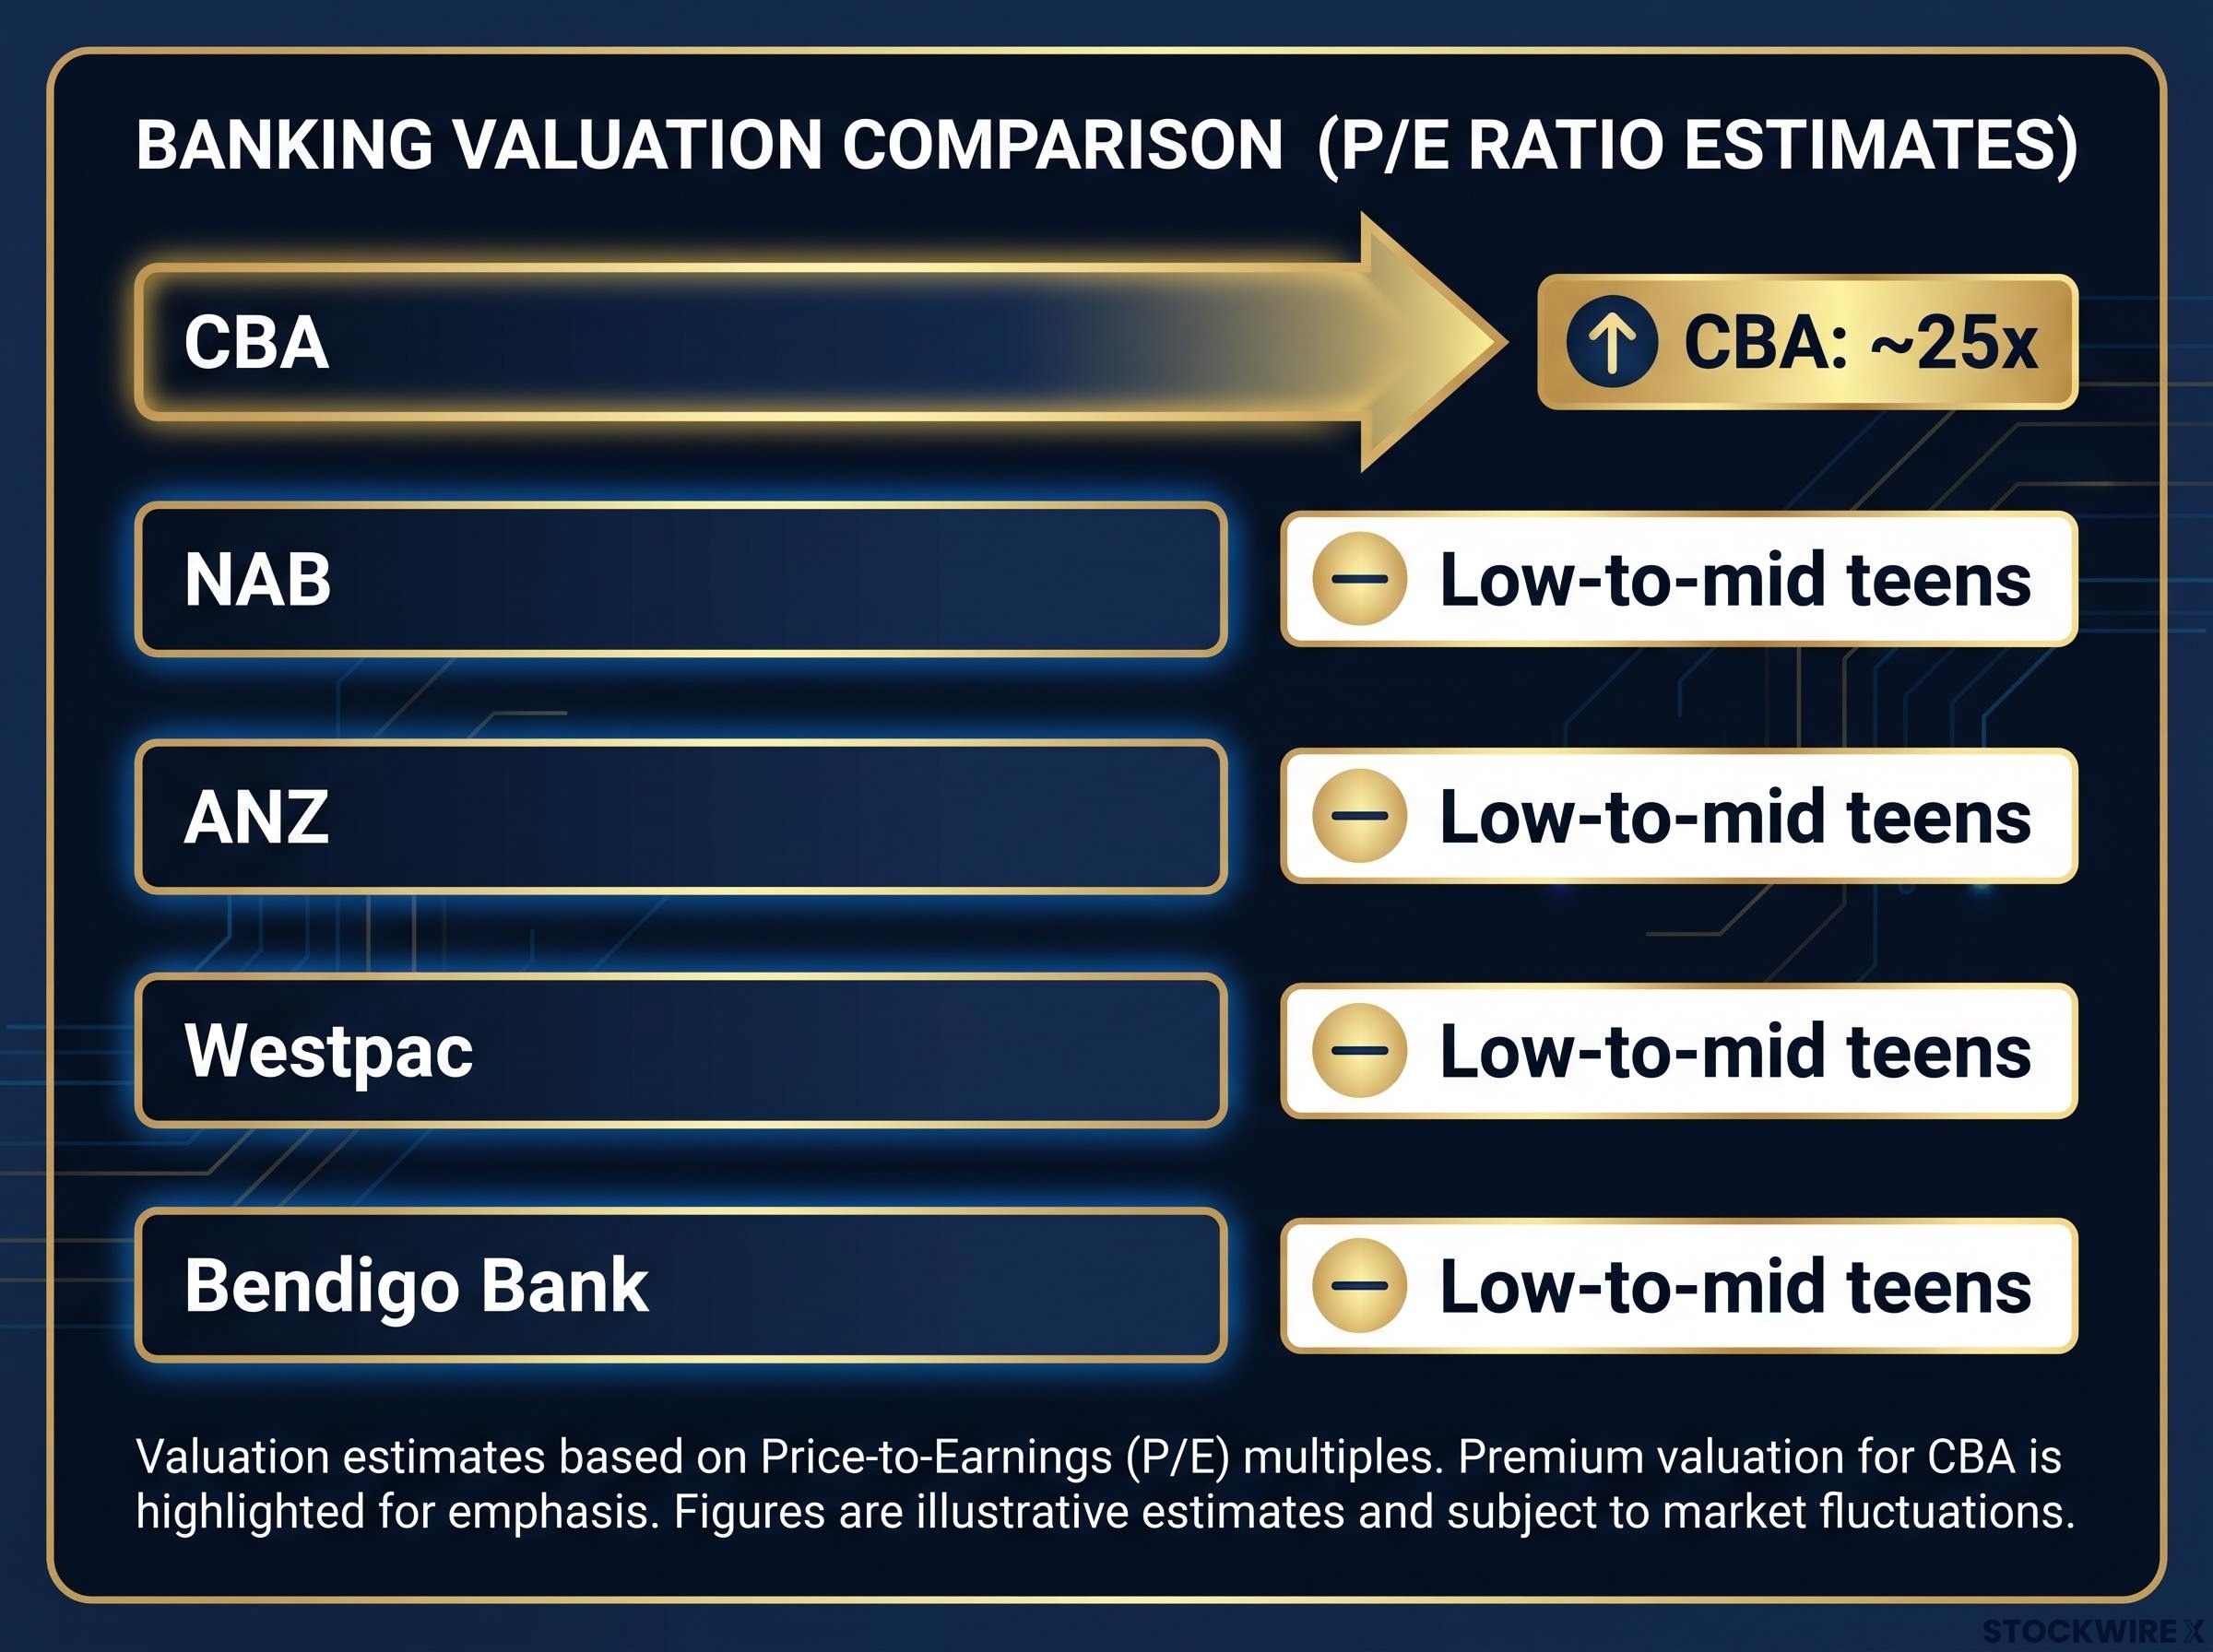
| Bank | Forward P/E (approx.) | Premium / Discount |
|---|---|---|
| CBA | ~25x | Significant premium to all major peers |
| NAB | Low-to-mid teens | Discount |
| ANZ | Low-to-mid teens | Discount |
| Westpac | Low-to-mid teens | Discount |
| Bendigo Bank | Low-to-mid teens | Discount |
That gap is the largest it has been in recent years. And 6% profit growth with net interest margin (NIM) compression and a discretionary provision build is the profile of a mid-teens multiple business, not a mid-20s one, unless the forward assumptions are credible and robust.
What the premium requires CBA to keep delivering
For 25x to be rational, three conditions must be simultaneously true:
- CBA can sustain high-single-digit EPS growth beyond FY26, not just the 6% delivered this year.
- Return on equity remains above the sector with low volatility through the cycle.
- Technology and AI investments produce measurable, recurring efficiency and revenue benefits that compound over the medium term.
None of these assumptions can be validated from a single annual result. The August print is a data point in a longer thesis, not a verdict. But the gap between what 6% profit growth normally justifies (mid-teens) and what the market is currently paying (mid-20s) is the single most important number in evaluating whether to buy, hold, or sell ahead of the result.
Three scenarios for how the result lands and what each means for A$177
The consensus benchmarks established above give you a concrete framework for reading 12 August. Three distinct outcomes are plausible, each with a different price implication.
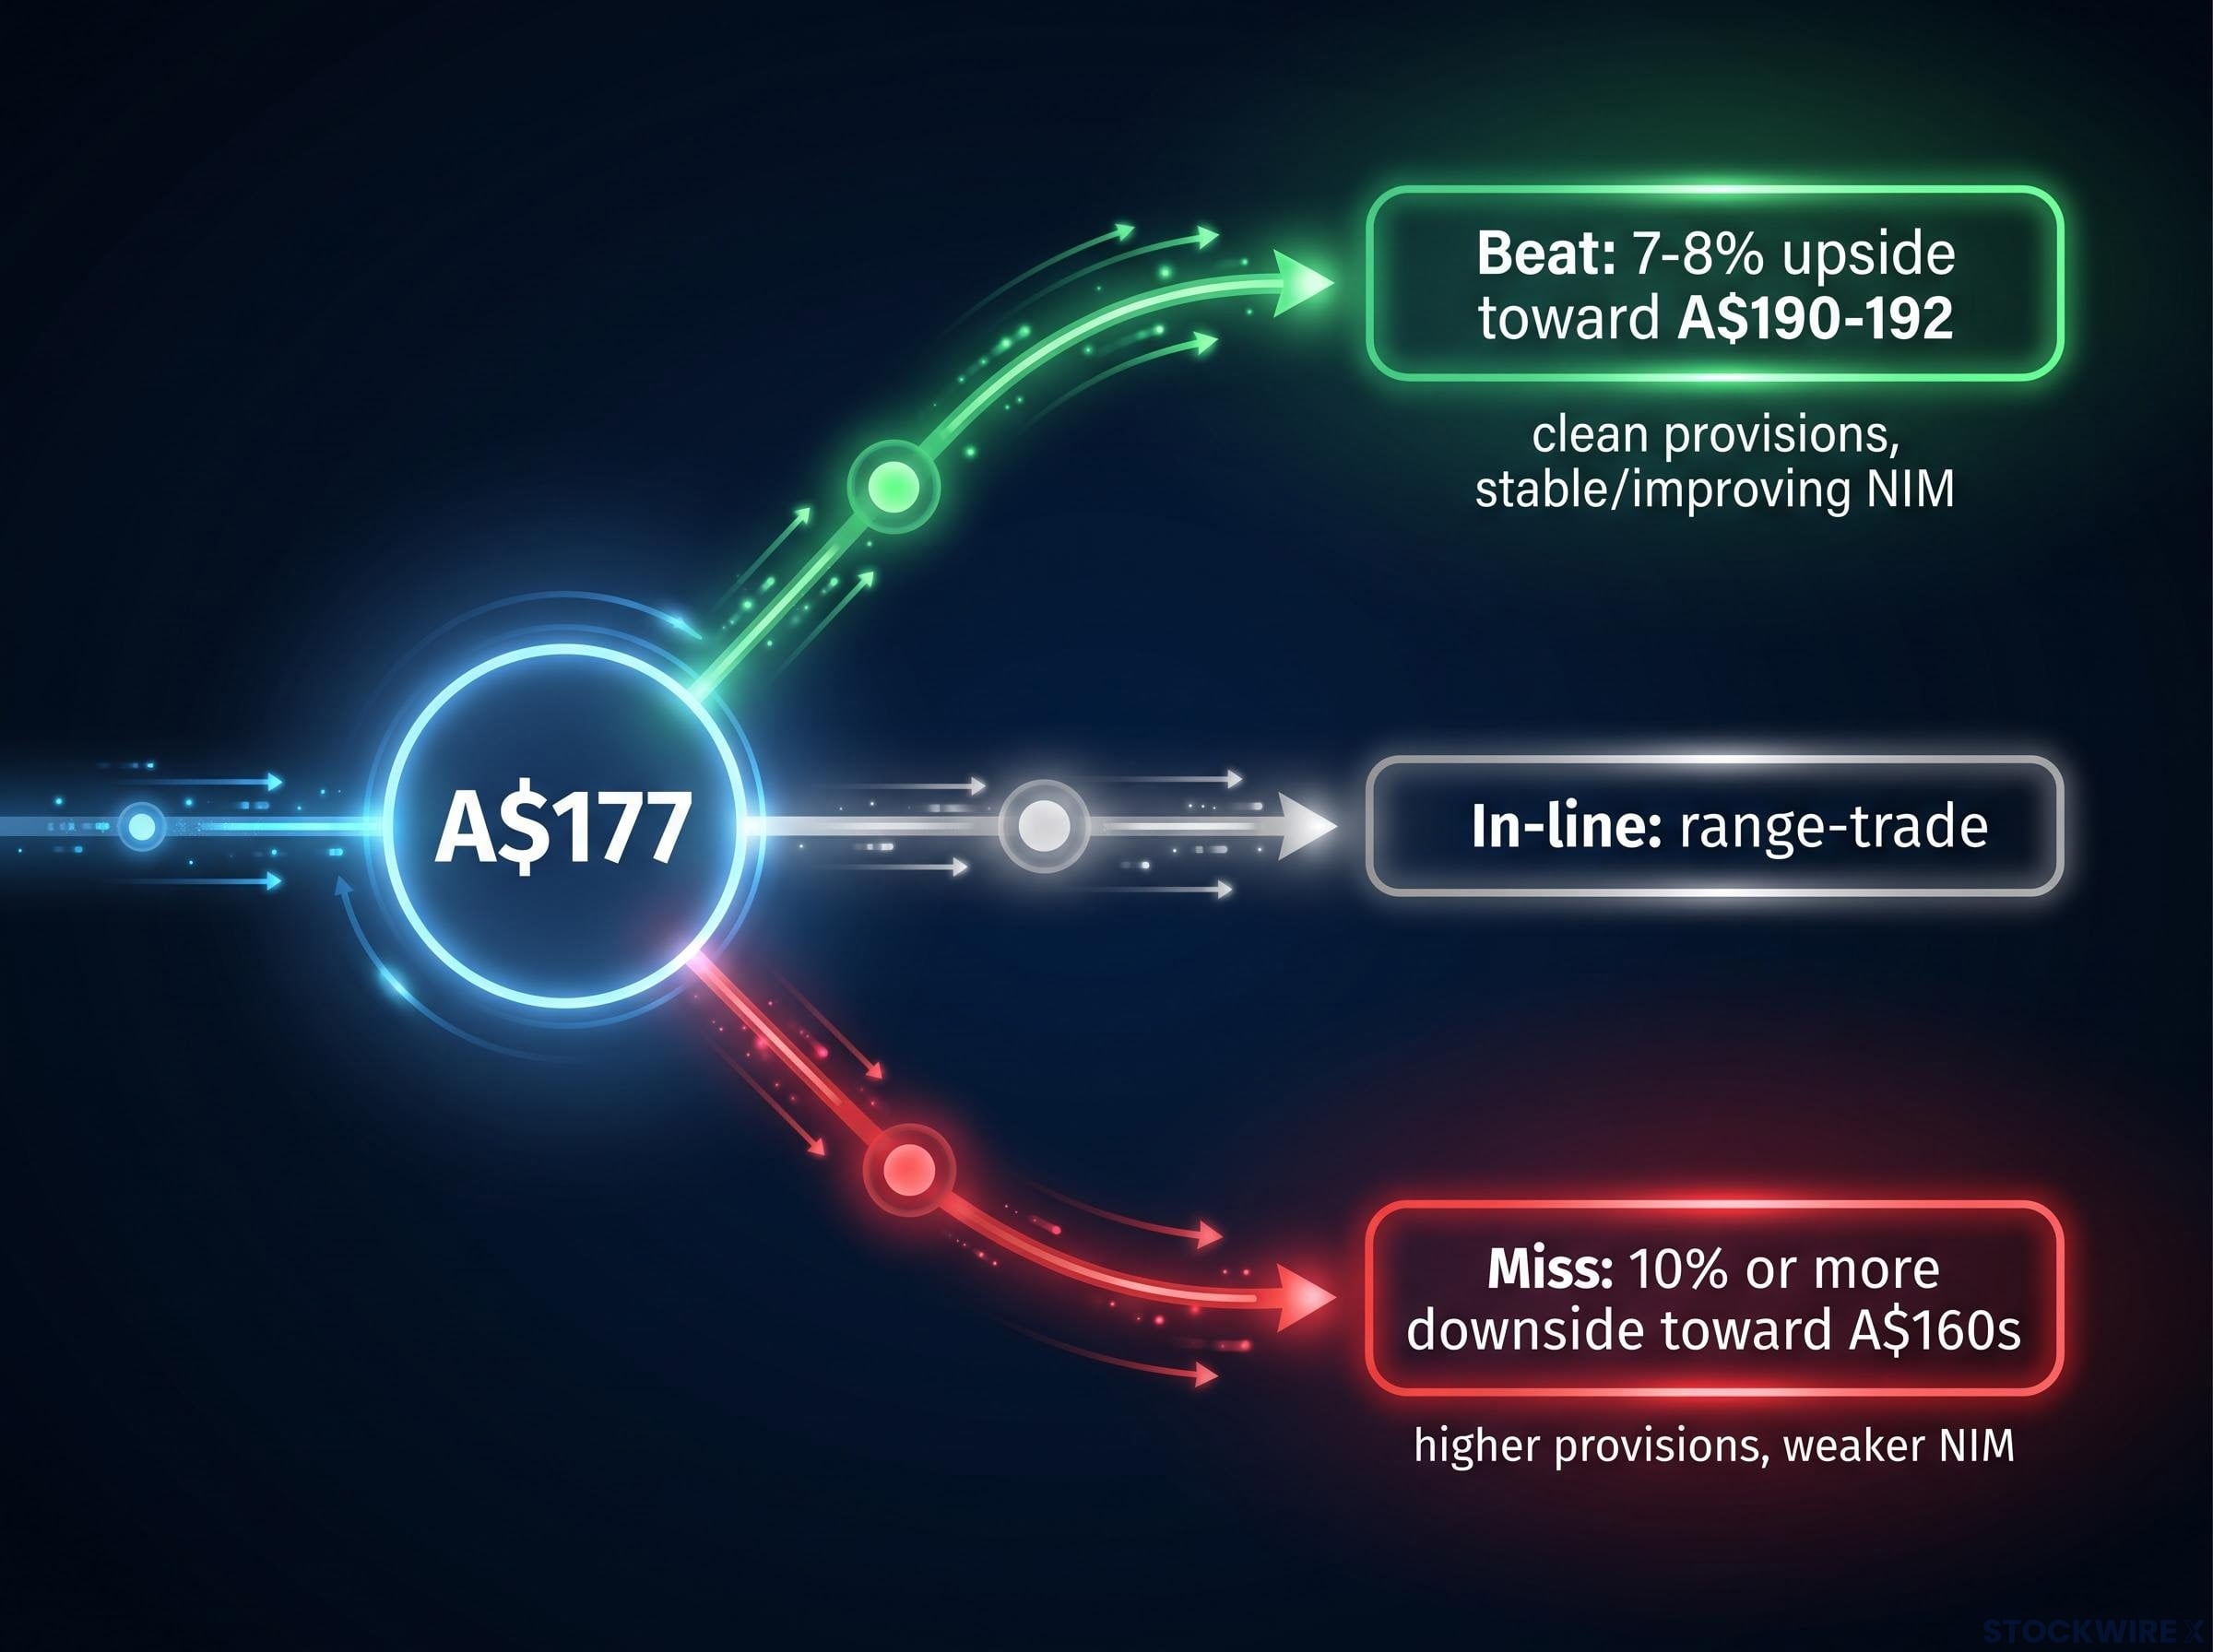
- Beat scenario: clean provisions, stable or improving NIM. Cash NPAT at or above A$10.85 billion; provisions flat or released; NIM stable to slightly higher than the first-half 2.04%. This combination confirms the premium thesis and suggests the May selloff was an overreaction. A move back toward the cycle high of A$190-192 becomes plausible, roughly 7-8% upside from current levels.
- Miss scenario: higher provisions, weaker NIM, cautious guidance. Profit below consensus; another provision build on top of the May A$200 million; NIM declining further. At 25x, the market will re-rate the stock toward more ordinary bank multiples. The May trading update already demonstrated the sensitivity: a 10.43% single-day fall on softer provisioning signals. A full-year miss with further provisioning is a more severe signal, and renewed disappointment could pull shares back into the A$160s or lower.
- In-line but ambiguous: no strong directional signal. Numbers sit close to consensus; provisions and NIM show no clear inflection either way. This likely leaves the valuation question unresolved. The stock may range-trade, with the 25x multiple at risk of gradual drift lower as investors wait for the next data point, which is a different kind of risk to manage but risk nonetheless.
The asymmetry matters: upside in the beat case is approximately 7-8% (back toward A$192), while downside in a confirmed miss could reach 10% or more (toward the A$160s). The May 10.43% single-session fall is the demonstrated sensitivity benchmark.
Whether the technology investment is showing up in the numbers yet
CBA’s premium over peers has historically rested on three verifiable advantages:
CBA’s technology leadership restructure in June 2026, splitting the top technology role into separate Group CIO and Group CTO positions reporting directly to CEO Matt Comyn, is the most visible structural bet the bank has made on AI and digital infrastructure, and the August result is the first major disclosure since those appointments took effect.
- Higher and more stable return on equity through the cycle.
- Better credit quality than peers across market conditions.
- Superior digital engagement, lower cost-to-income ratio, and stronger customer retention linked to technology investment.
Those advantages are real. They have historically justified a premium in the high-teens to low-20s P/E range. The question is whether they justify a mid-20s multiple, because the distance between the historical premium range and today’s share price embeds a further expectation on top: that AI and technology spending will translate into durable, measurable earnings benefits over the medium term, rather than remaining a forward-looking promise.
The gap between narrative and verified earnings impact
Reported cost-to-income improvements are verifiable in the accounts. Broader AI-driven revenue uplift is forward-looking and harder to attribute to any single technology investment. The distinction matters because the market is paying for both, but only one is currently in the numbers.
The August result will include management commentary on digital strategy and technology execution. If the result shows NIM compression and another provision build but management points to technology investment as the reason to stay patient, you should weigh whether that reassurance is backed by a measurable change in the cost-to-income ratio, or whether it remains a forward-looking promise. Generic language about digital leadership carries less weight than a verifiable improvement in specific operating metrics.
Reading the August result if you are holding at A$177
If you own CBA at approximately A$177.82, the 12 August result is less about making a new return and more about confirming that the current price is defensible. That is a different way to think about holding a stock than most retail investors apply, but the asymmetry demands it.
Here are the signals to watch, in order of importance:
- Loan impairment and provision figure. Flat or released versus a further build. This is the line item that moved the stock 10.43% in May and will carry the most re-rating power on result day.
- NIM trajectory from 1H to 2H FY26. Did the 2.04% first-half NIM stabilise, improve, or decline further? Direction matters more than the decimal.
- Payout ratio. Confirm the dividend is sustainable in the 70-75% range, consistent with the implied final dividend of approximately A$2.65.
- Management commentary on macro outlook and NIM guidance. Forward-looking language here shapes the next six months of valuation debate, through to the 1H FY27 result in early 2027.
At approximately A$177.82, the beat case offers roughly 7-8% upside toward A$190-192. The miss case, with further provisioning, could revisit the low A$160s, a potential drawdown of 10% or more. The upside rewards confirmation; the downside punishes deterioration more severely.
Knowing which metrics actually drive the re-rating replaces reactive screen-watching with a structured read of the announcement, reducing the risk of an emotional decision anchored to the wrong headline.
What the August result changes, and what it cannot settle
A clean August result, with provisions flat, NIM stable, and profit at or above consensus, does not prove the 25x multiple is permanently justified. It proves the multiple is not immediately threatened. That is a meaningful validation, but it is a narrower one than the share price implies.
What one annual result cannot answer is whether CBA’s technology investment will compound into durable margin and efficiency advantages over a five-to-ten year horizon. That is ultimately what the premium is pricing, and the next comparable data point will not arrive until the 1H FY27 result in early 2027.
CBA’s shares have risen approximately 120% from a 2023 trough of A$86.98 to a late-2025 high of A$192.00. At approximately A$177.82, the market has already paid a substantial premium for the quality thesis. That premium is not automatically wrong, but it requires ongoing justification on the two metrics that matter most: provisions and NIM. The investor’s actual decision is not whether CBA is a good company. It demonstrably is. The decision is whether the current price already fully reflects that quality, leaving little margin for error on the variables the market has shown it will reprice on without hesitation.
The qualitative factors that standard valuation models cannot capture, including franchise strength, deposit base resilience, and perceived earnings stability through the cycle, are the primary reason CBA’s share price has persistently sat above every model-based fair value estimate, and they are the same factors that will determine whether the August result sustains or erodes the premium thesis.
This article is for informational purposes only and should not be considered financial advice. Investors should conduct their own research and consult with financial professionals before making investment decisions. Past performance does not guarantee future results. Financial projections are subject to market conditions and various risk factors.