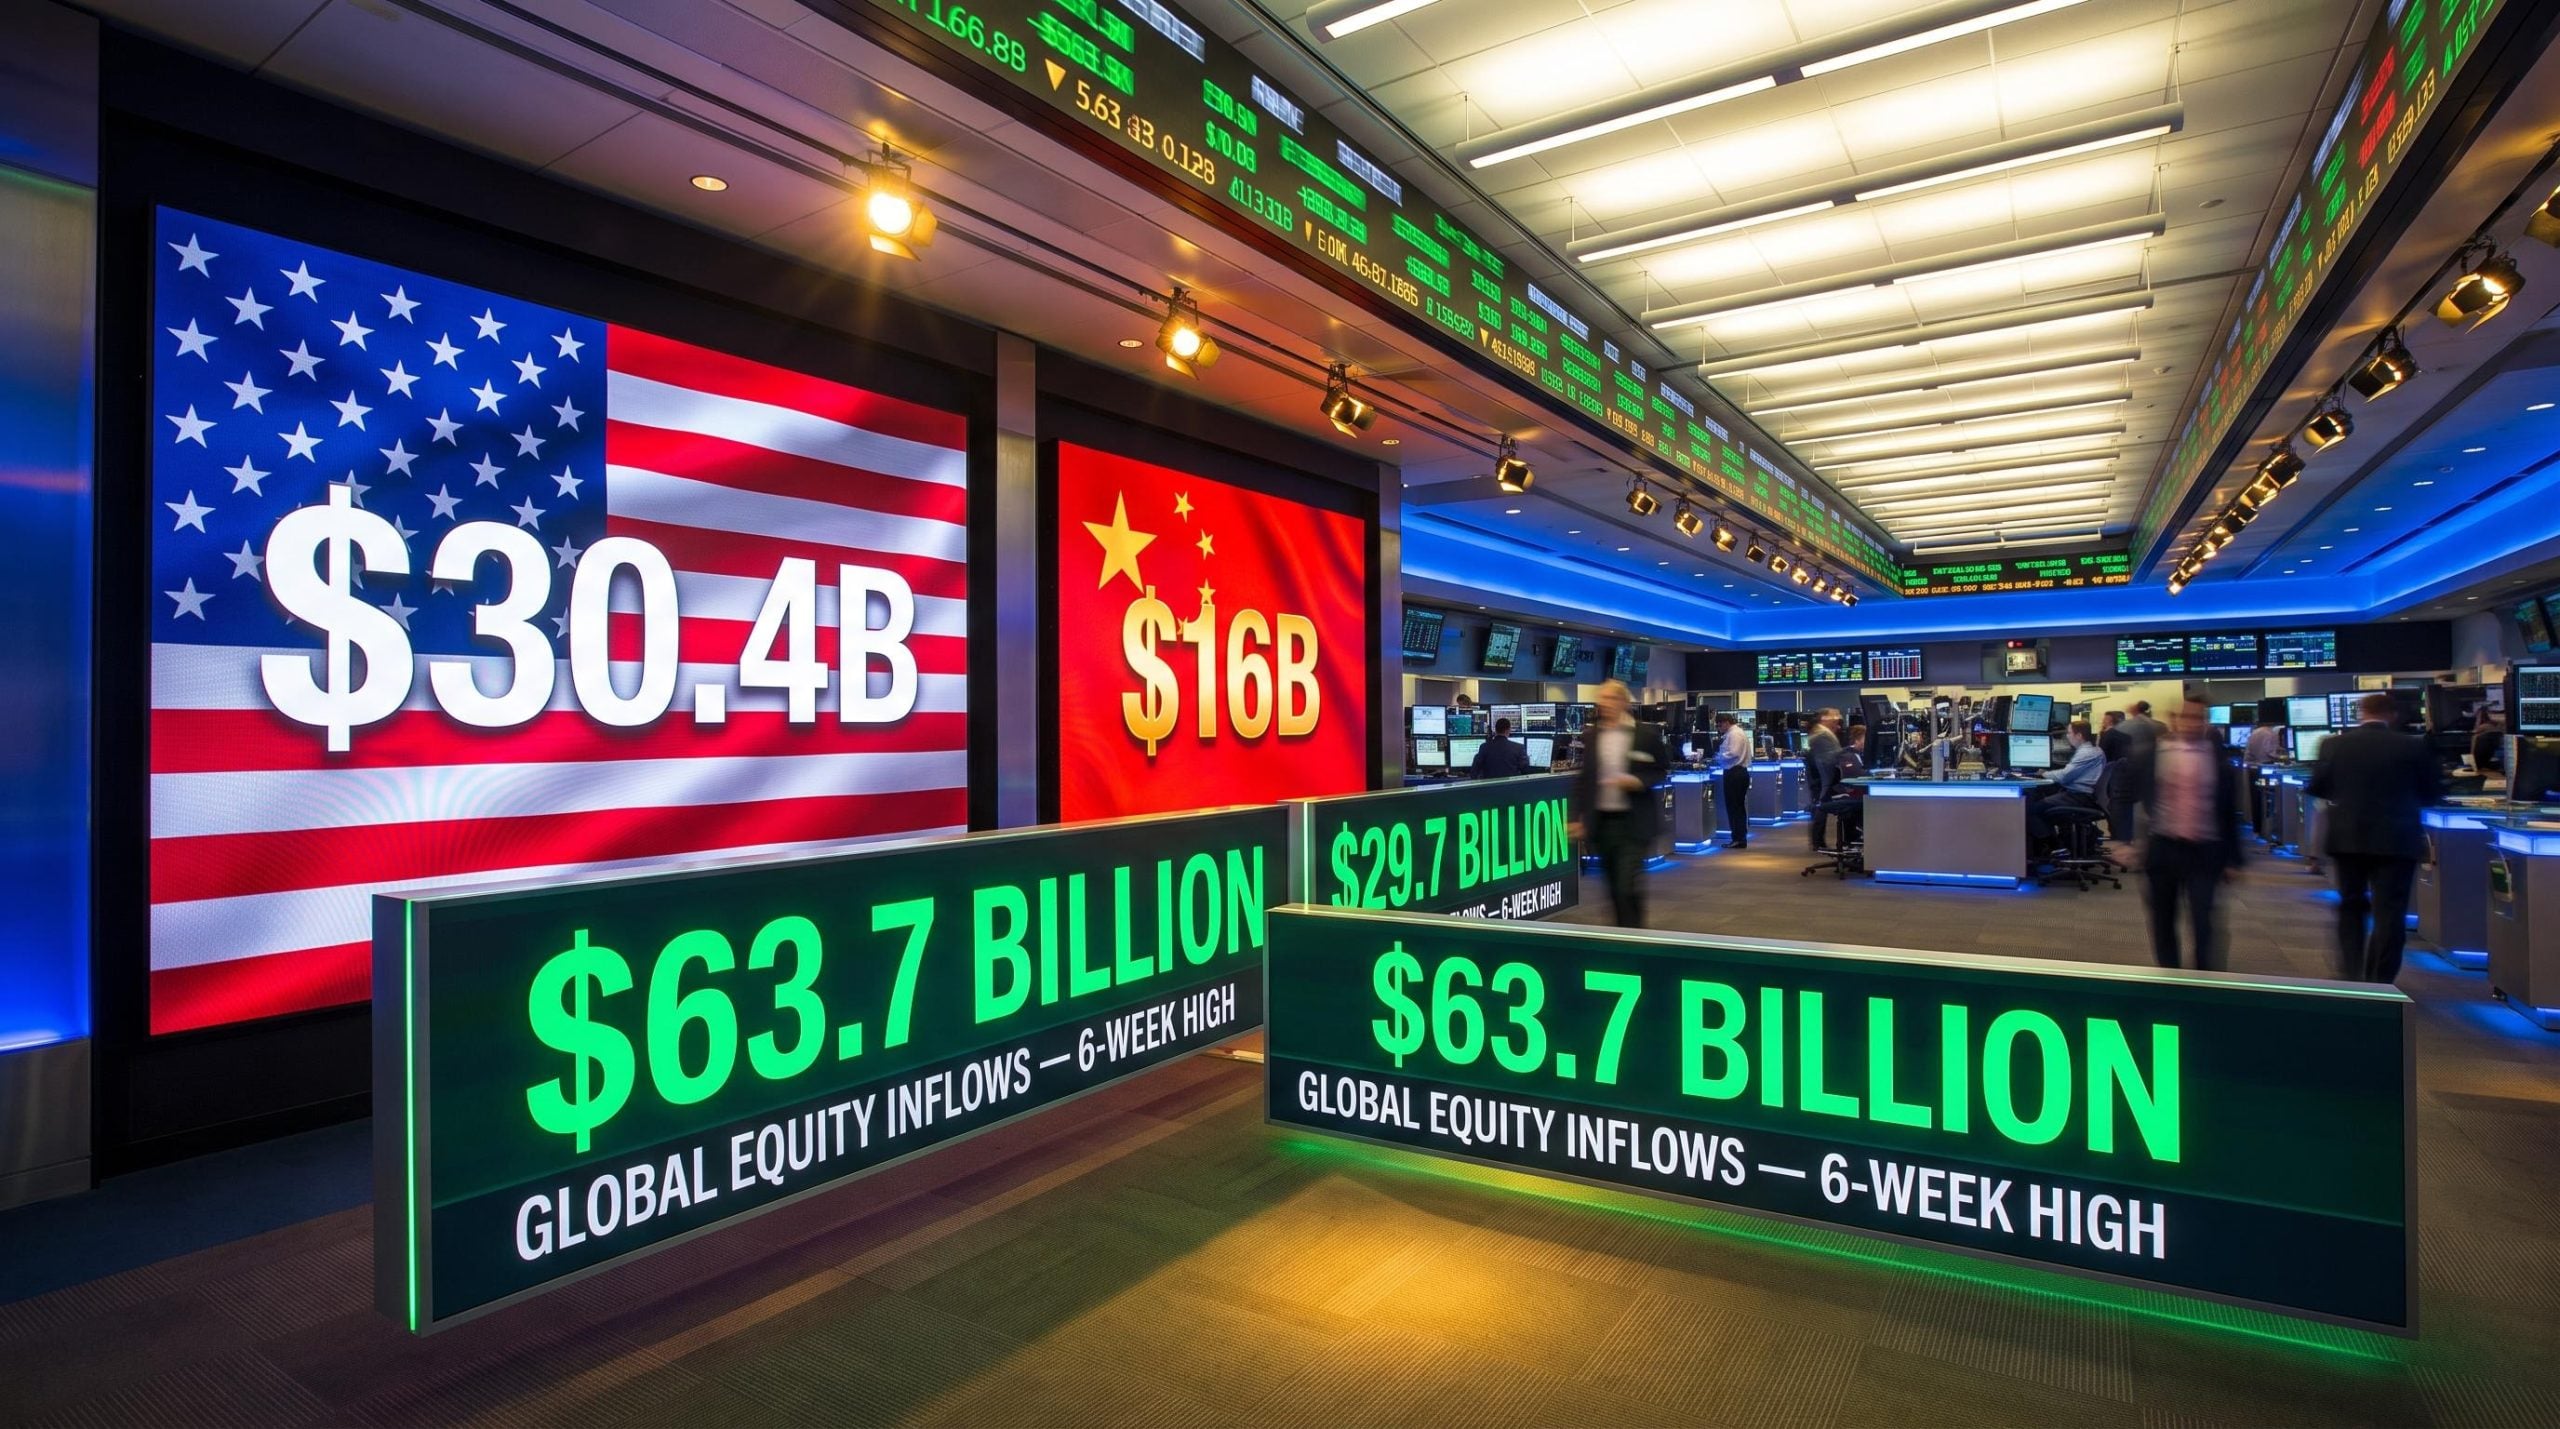
Institutional investors moved $63.7 billion into equity funds in a single week, the strongest weekly intake in six weeks, according to Deutsche Bank data. This is not a gradual drift toward risk. It is a decisive, measurable rotation of capital out of bonds and cash and into equities, concentrated overwhelmingly in two markets: the United States and China.
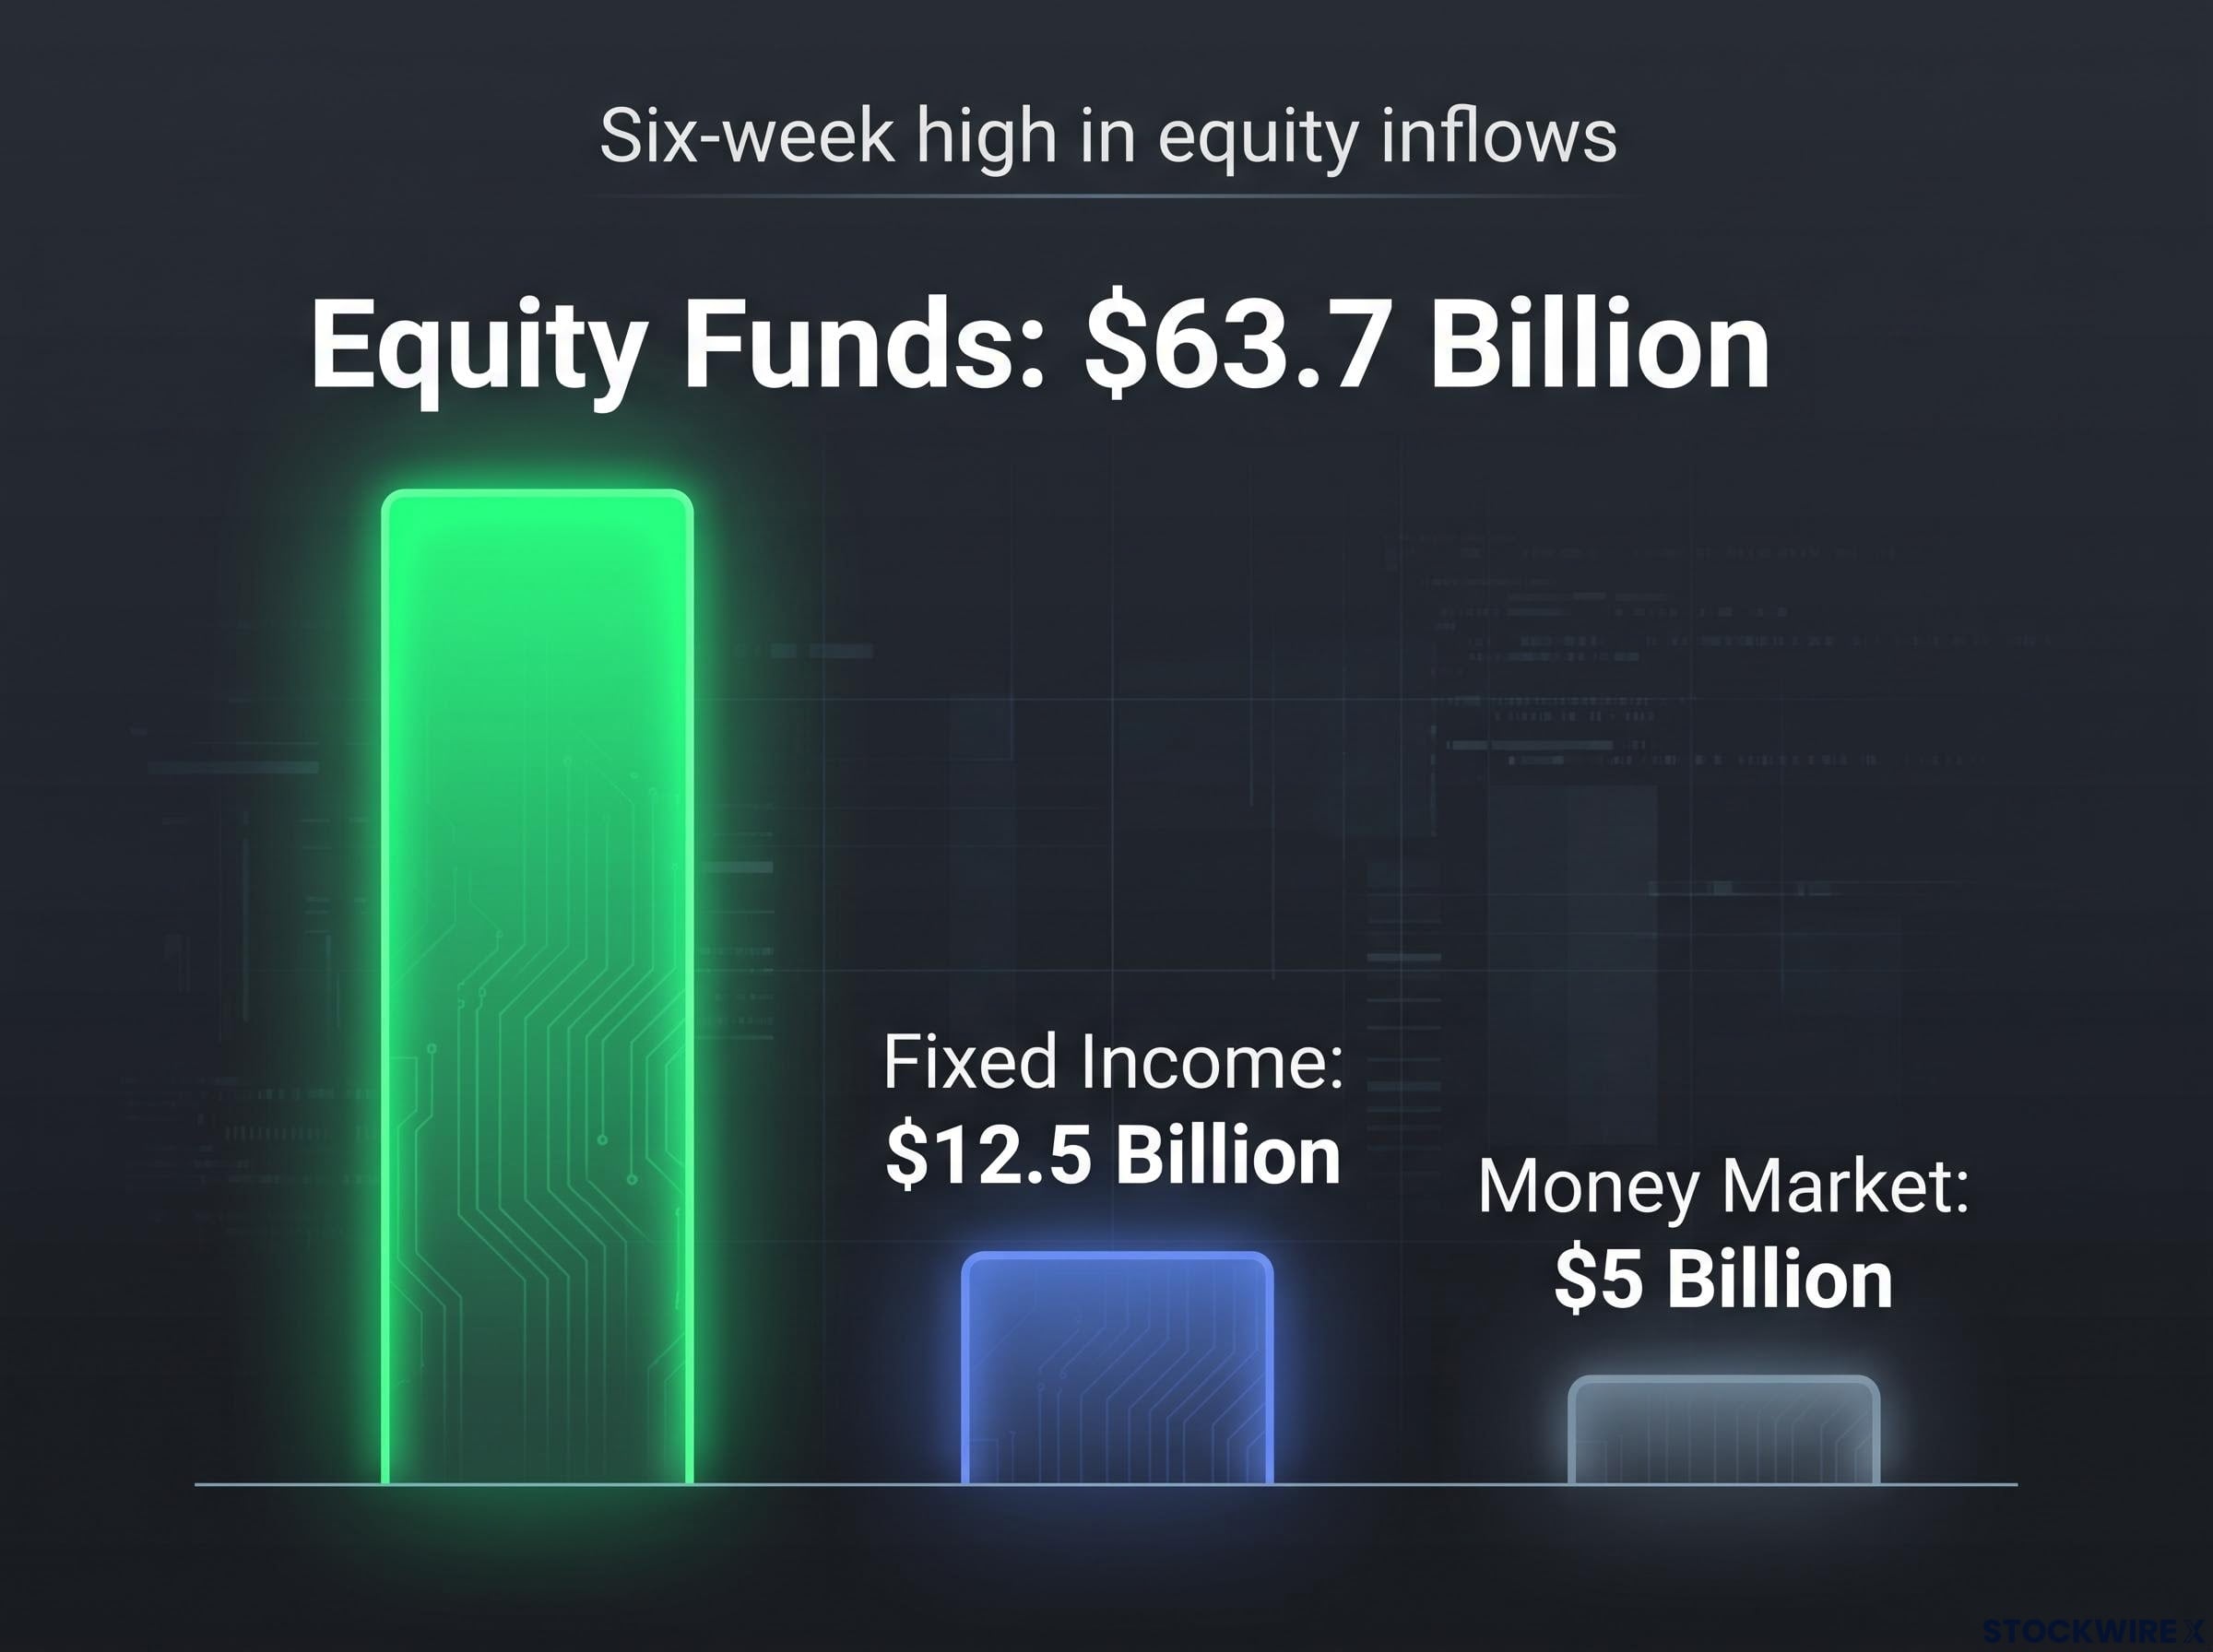
The shift carries a specific signature. Bond fund inflows fell away to $12.5 billion and money market funds took in only $5 billion, a sharp contrast to the prior two weeks of substantial outflows from cash-like vehicles, while equity inflows surged. That combination, strong equities paired with weakening demand for safer assets, is as clear a risk-on configuration as weekly flow data produces.
Here is what the data shows, and what it does not yet confirm. The numbers, the geographic breakdown, and the one positioning dynamic that will determine whether this rotation holds or fades are all laid out below.
A six-week high in equity inflows signals a clear rotation toward risk
$63.7 billion in global equity fund inflows for the week, the highest weekly intake over the prior six weeks (Deutsche Bank data).
The figure is not a single trade or a one-off rebalancing event. It reflects estimated net flows across mutual funds and ETFs for the week, meaning it captures broad allocator behaviour rather than a concentrated institutional bet. When that much capital moves into equities in a single week, it registers as a signal of where professional money managers are actively directing new capital.
The equity surge looks even more meaningful set against what happened in other asset classes:
- Equity fund inflows: $63.7 billion (six-week high)
- Fixed income fund inflows: $12.5 billion (continuing a weakening trend)
- Money market fund inflows: $5 billion (following two consecutive weeks of substantial outflows)
The pattern is corroborated across independent data providers. LSEG Lipper reported $55.22 billion in global equity inflows, while the Investment Company Institute (ICI) recorded $55.75 billion for a comparable period, both pointing to multi-month highs. The Deutsche Bank figure sits higher, likely reflecting a broader fund universe, but all three sources are directionally consistent.
Weekly fund flow positioning data has shown persistent structural patterns across 2026, including a 56-consecutive-week bond inflow streak and a Bank of America Bull and Bear Indicator that reached 8.0 in May, activating a contrarian sell signal that preceded short-term equity softness.
This is not passive market appreciation inflating fund values. The simultaneous weakening of bond and cash inflows tells you that institutional managers are making active reallocation decisions, moving capital up the risk spectrum rather than simply riding existing positions higher.
When big ASX news breaks, our subscribers know first
Why the U.S. and China are capturing most of the world’s new equity money
The $63.7 billion did not spread evenly across global markets. It concentrated, heavily, in two destinations.
| Region | Weekly inflows (Deutsche Bank) | Notable driver |
|---|---|---|
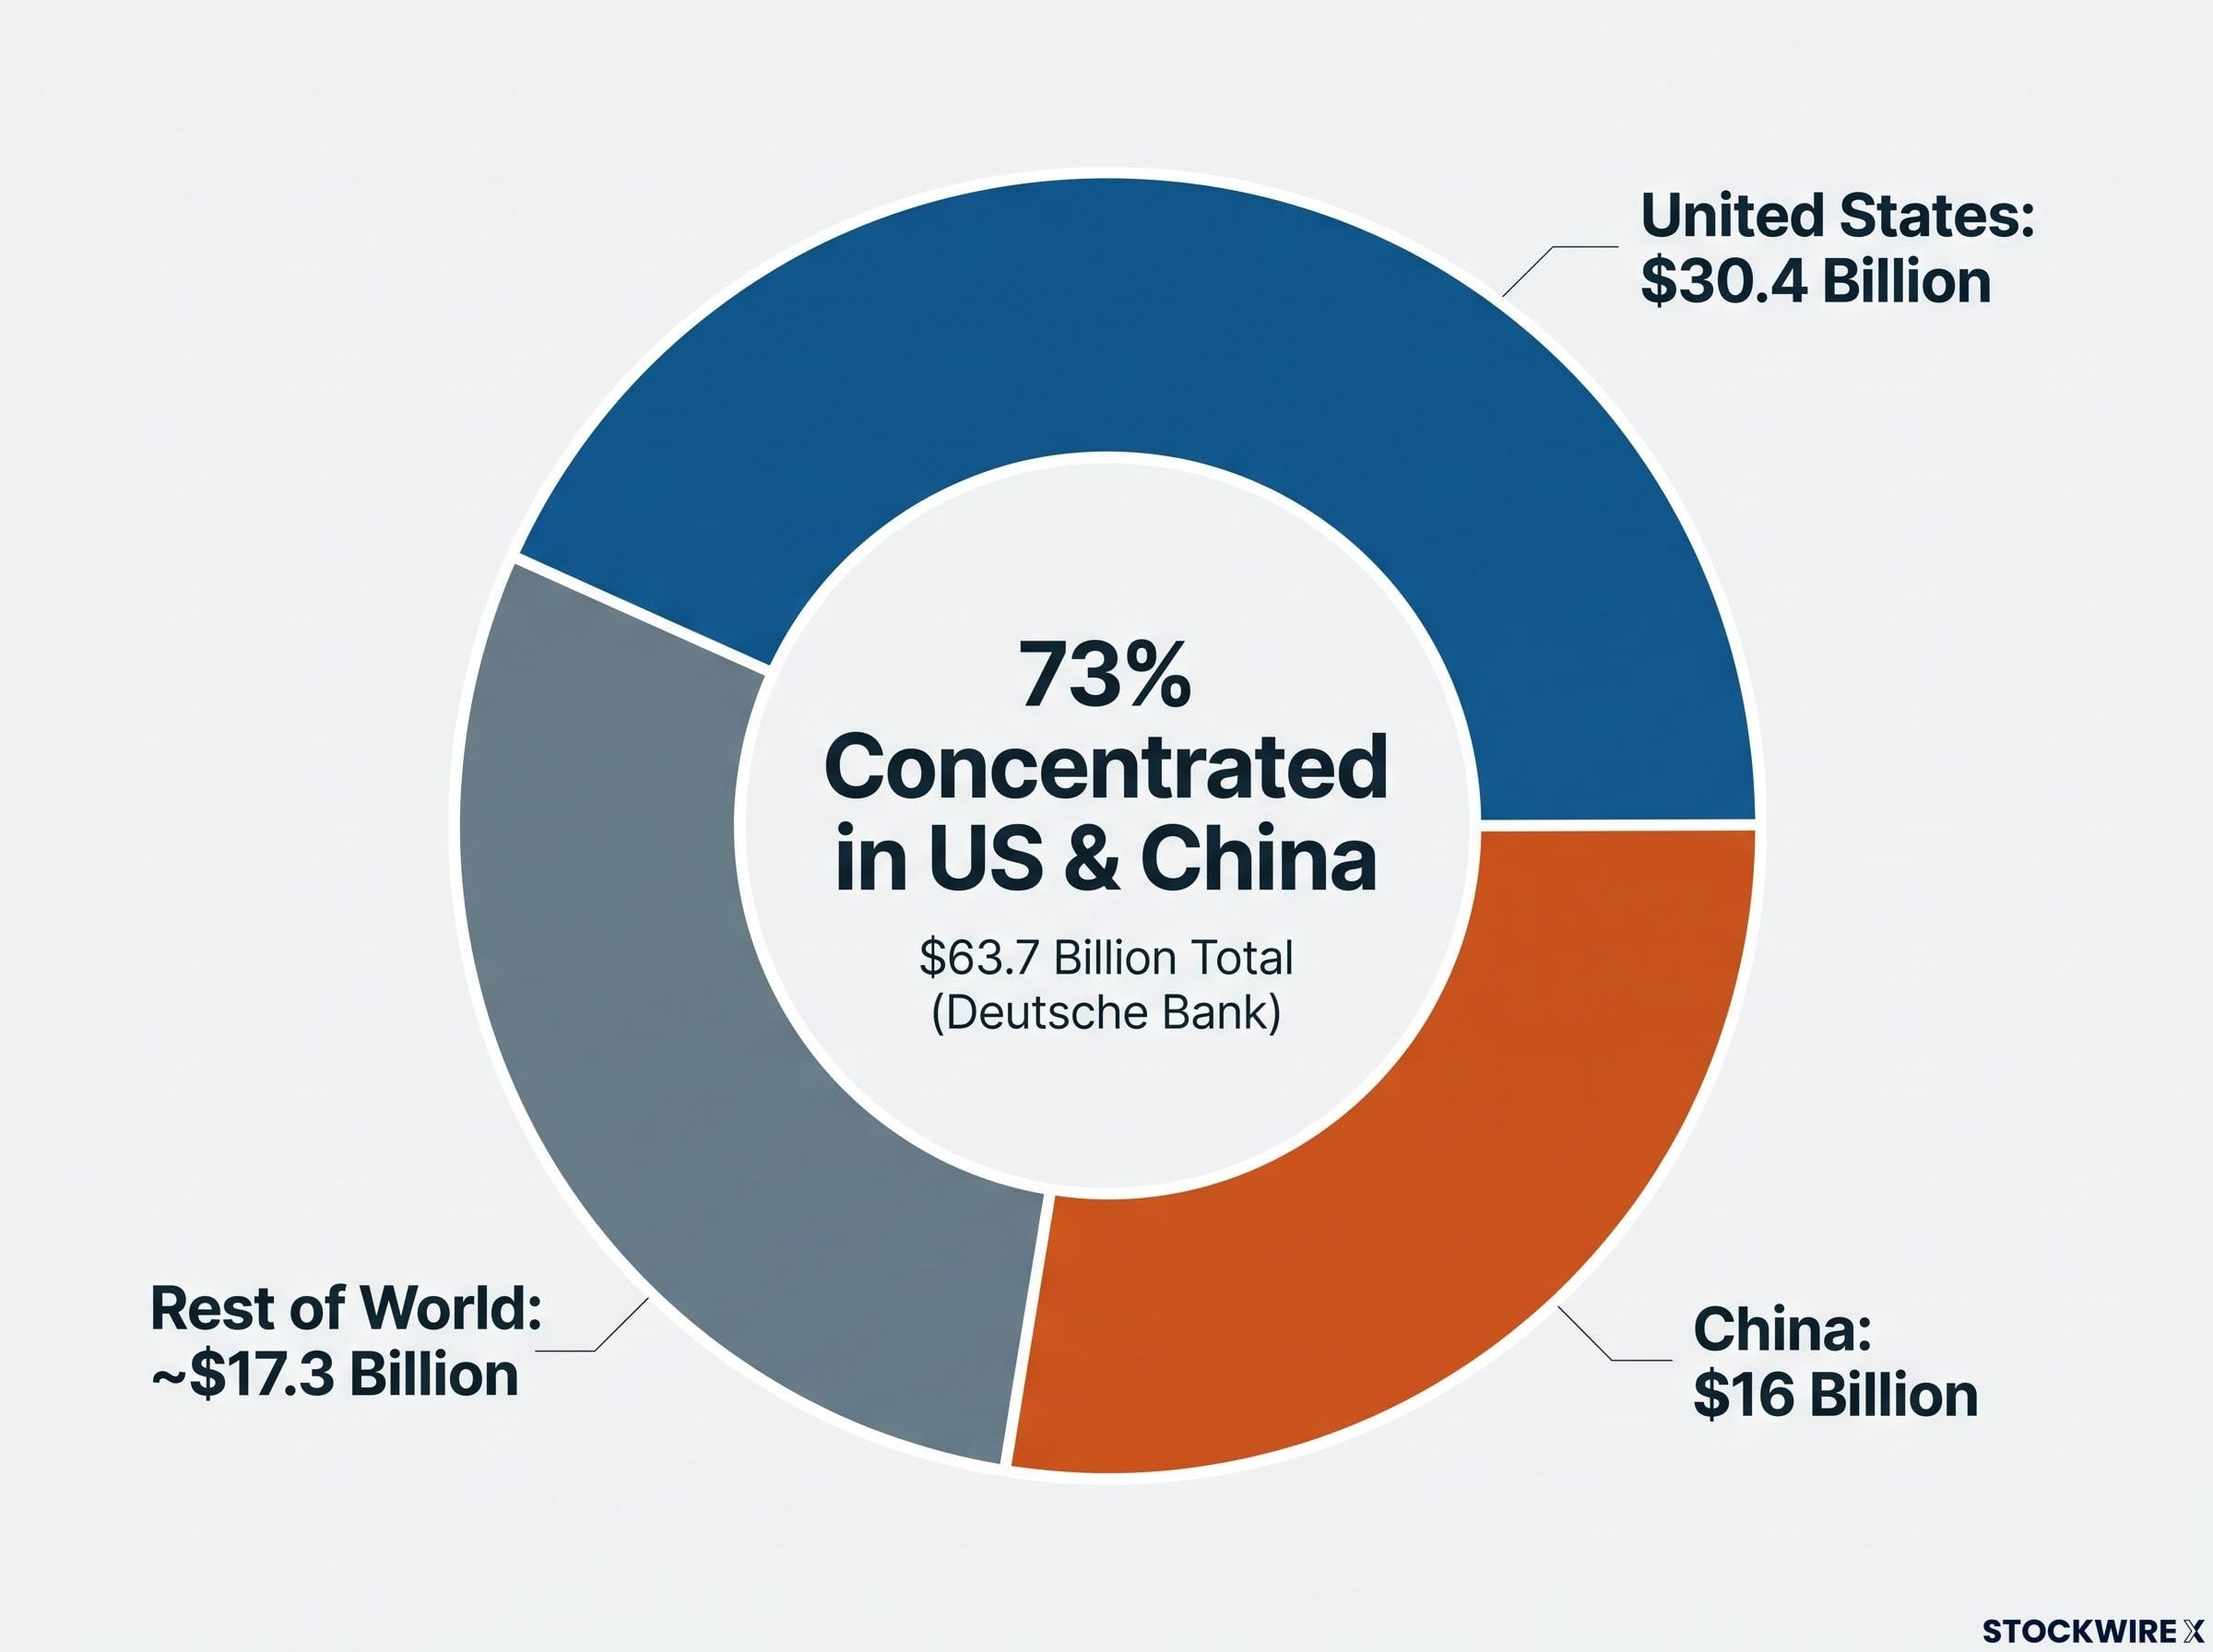
| United States | $30.4 billion | Mega-cap technology, corporate earnings, AI-driven growth expectations |
| China | $16 billion | Tactical re-engagement with Chinese risk assets |
| Rest of world (implied) | ~$17.3 billion | Diffuse, no single market dominant |
U.S. equities absorbed $30.4 billion, making it the single largest geographic destination. The structural attractants are familiar: mega-cap technology leadership, AI-related capital expenditure, and a corporate earnings season that has broadly supported valuations. Corroborating data from LSEG Lipper shows U.S. equity funds at $38.37 billion and technology funds at a reported record weekly intake of $21.46 billion, further reinforcing the U.S. and tech-led character of the rotation.
Semiconductor capital flows illustrate the structural dimension behind the U.S. equity dominance in weekly inflow data: the SOXX ETF gained approximately 40.4% in April 2026, its best month on record, driven by a self-reinforcing dollar feedback loop where AI-driven equity buying increases dollar demand and attracts further inflows into the same positions.
China at $16 billion is the more striking data point. A flow of that size into China-focused funds implies a deliberate geographic call, not incidental exposure through global indices. It signals at least a tactical re-engagement with Chinese risk assets after extended periods of caution.
When two markets absorb the majority of global flows
Together, the U.S. and China captured roughly 73% of total global equity inflows. That concentration carries structural risk. A single policy announcement, earnings miss, or geopolitical escalation in either market becomes a systemic risk for the broader rotation, not just a regional event. The global risk-on narrative is, for now, structurally dependent on both markets continuing to deliver.
What are systematic and discretionary investors, and why does the split matter?
The headline flow numbers tell you how much money moved and where it went. The positioning data tells you who is doing the buying, and whether they have room to buy more. That distinction is where the real durability question sits.
According to Deutsche Bank‘s positioning analysis, total equity positioning held only marginally short of a neutral reading even as inflows surged through the week. How is that possible when $63.7 billion just flowed into equities? The answer lies in a sharp divergence between two types of institutional investor:
- Systematic strategies (CTAs, trend-following funds, risk-parity, and volatility-targeting funds): these are rules-based strategies that follow quantitative signals, primarily price momentum, volatility levels, and correlation patterns. They buy when their models say buy, regardless of macro narrative. As a group, they currently hold an overweight equity position.
- Discretionary managers (active, judgment-based allocators): these are fund managers who make allocation decisions based on their own assessment of macro conditions, valuations, and risk. They currently maintain a notably underweight equity stance.
Systematic strategies tend to move earlier with price trends. Discretionary managers typically wait for greater macro clarity and valuation comfort before adding risk. That behavioural difference explains why two groups looking at the same market can hold opposite positions.
Total equity positioning held just short of neutral even as inflows reached a six-week high.
The fact that aggregate positioning sits slightly below neutral even with strong inflows tells you the buying is concentrated among rules-based strategies rather than reflecting broad conviction across the institutional landscape. That is a meaningful constraint on how far this rally can run on current participants alone.
Systematic funds are fully loaded, and that changes the risk equation
According to Deutsche Bank, CTA and trend-following funds have pushed their positioning to the top of the range recorded historically. That single data point reshapes the risk equation for this rotation.
When systematic strategies are already near maximum equity exposure, two things are simultaneously true. First, they are actively reinforcing upward price momentum as long as conditions hold. Second, they have limited incremental buying power remaining. The mechanical tailwind that helped push inflows to a six-week high is largely spent.
Equity allocation extremes have been flagged across multiple institutional surveys in 2026, with the May BofA Fund Manager Survey recording a record 37-percentage-point single-month surge to a net 50% overweight alongside cash levels falling below the 4.0% sell-signal threshold, a configuration that historically precedes positioning-driven reversals.
A closer look at volatility-control funds reveals an additional layer of complexity. Within this subset of systematic strategies, equity allocations have been trimmed back toward a neutral level, suggesting that measured de-risking is already in motion among some rules-based participants rather than fresh accumulation.
The asymmetric risk is real: systematic strategies can support prices while trends persist, but they can also exit rapidly and mechanically when volatility spikes or trend signals reverse, amplifying any drawdown precisely because their positions are concentrated and rules-driven.
Discretionary underweights as the remaining fuel
The bull case for this rotation extending rests on a specific conditional. If macro data strengthens, if U.S. mega-cap tech earnings confirm AI-driven revenue growth, or if Chinese cyclical sector results improve, discretionary managers sitting on underweight positions represent the primary source of incremental demand. Their re-engagement would bring a different type of buyer, one driven by conviction rather than momentum, and that is what separates a tactical burst from a durable re-risking cycle.
Sustained upside now requires that different buyer. The mechanical tailwind is largely spent.
The key variables to monitor for durability:
- U.S. mega-cap technology earnings and forward guidance
- Chinese cyclical sector results and policy signals
- Volatility index direction, particularly any spike that could trigger systematic de-risking
- Discretionary positioning surveys and fund manager exposure reports
- Sustained bond and money market outflows as confirmation the rotation is deepening
What this rotation actually confirms, and what still needs to prove itself
The data establishes several things clearly. A genuine and broad-based shift of capital toward equities occurred at a scale consistent with multi-month highs across multiple independent data providers. The $63.7 billion figure from Deutsche Bank, corroborated by LSEG Lipper and ICI, is not a statistical artefact. The geographic concentration in the U.S. and China is real and deliberate. Near-term liquidity support for risk assets is tangible.
What the data confirms:
- The rotation into equities is real, broad-based across fund types, and at multi-month highs
- U.S. and China are the dominant destinations, carrying the majority of the flow
- Systematic strategies are providing active price support through overweight positioning
What remains unresolved:
- Whether discretionary managers will close their underweights or stay on the sidelines
- Whether CTA positioning near historical ceilings represents a support or a vulnerability
- Whether the geographic concentration in two markets creates fragility the headline number obscures
The variable that separates a tactical risk-on burst from the beginning of a durable re-risking cycle is whether discretionary managers begin closing their underweights. U.S. mega-cap tech earnings, Chinese policy developments, and volatility measures over the coming weeks will provide the next meaningful read on that question.
The flow data confirms the rotation started. It does not confirm that it will continue. Tracking discretionary positioning shifts is the most direct way to know whether this move has the legs that systematic buyers alone cannot provide.
For investors wanting to understand what the reversal of a risk-on configuration looks like in flow data terms, our full explainer on risk-off rotation covers the week ending 3 July 2026, when record energy sector outflows, simultaneous equity redemptions across every major geography, and a sharp defensive pivot into bonds and money markets produced a mirror image of the pattern described here.
This article is for informational purposes only and should not be considered financial advice. Investors should conduct their own research and consult with financial professionals before making investment decisions. These statements are speculative and subject to change based on market developments and company performance.