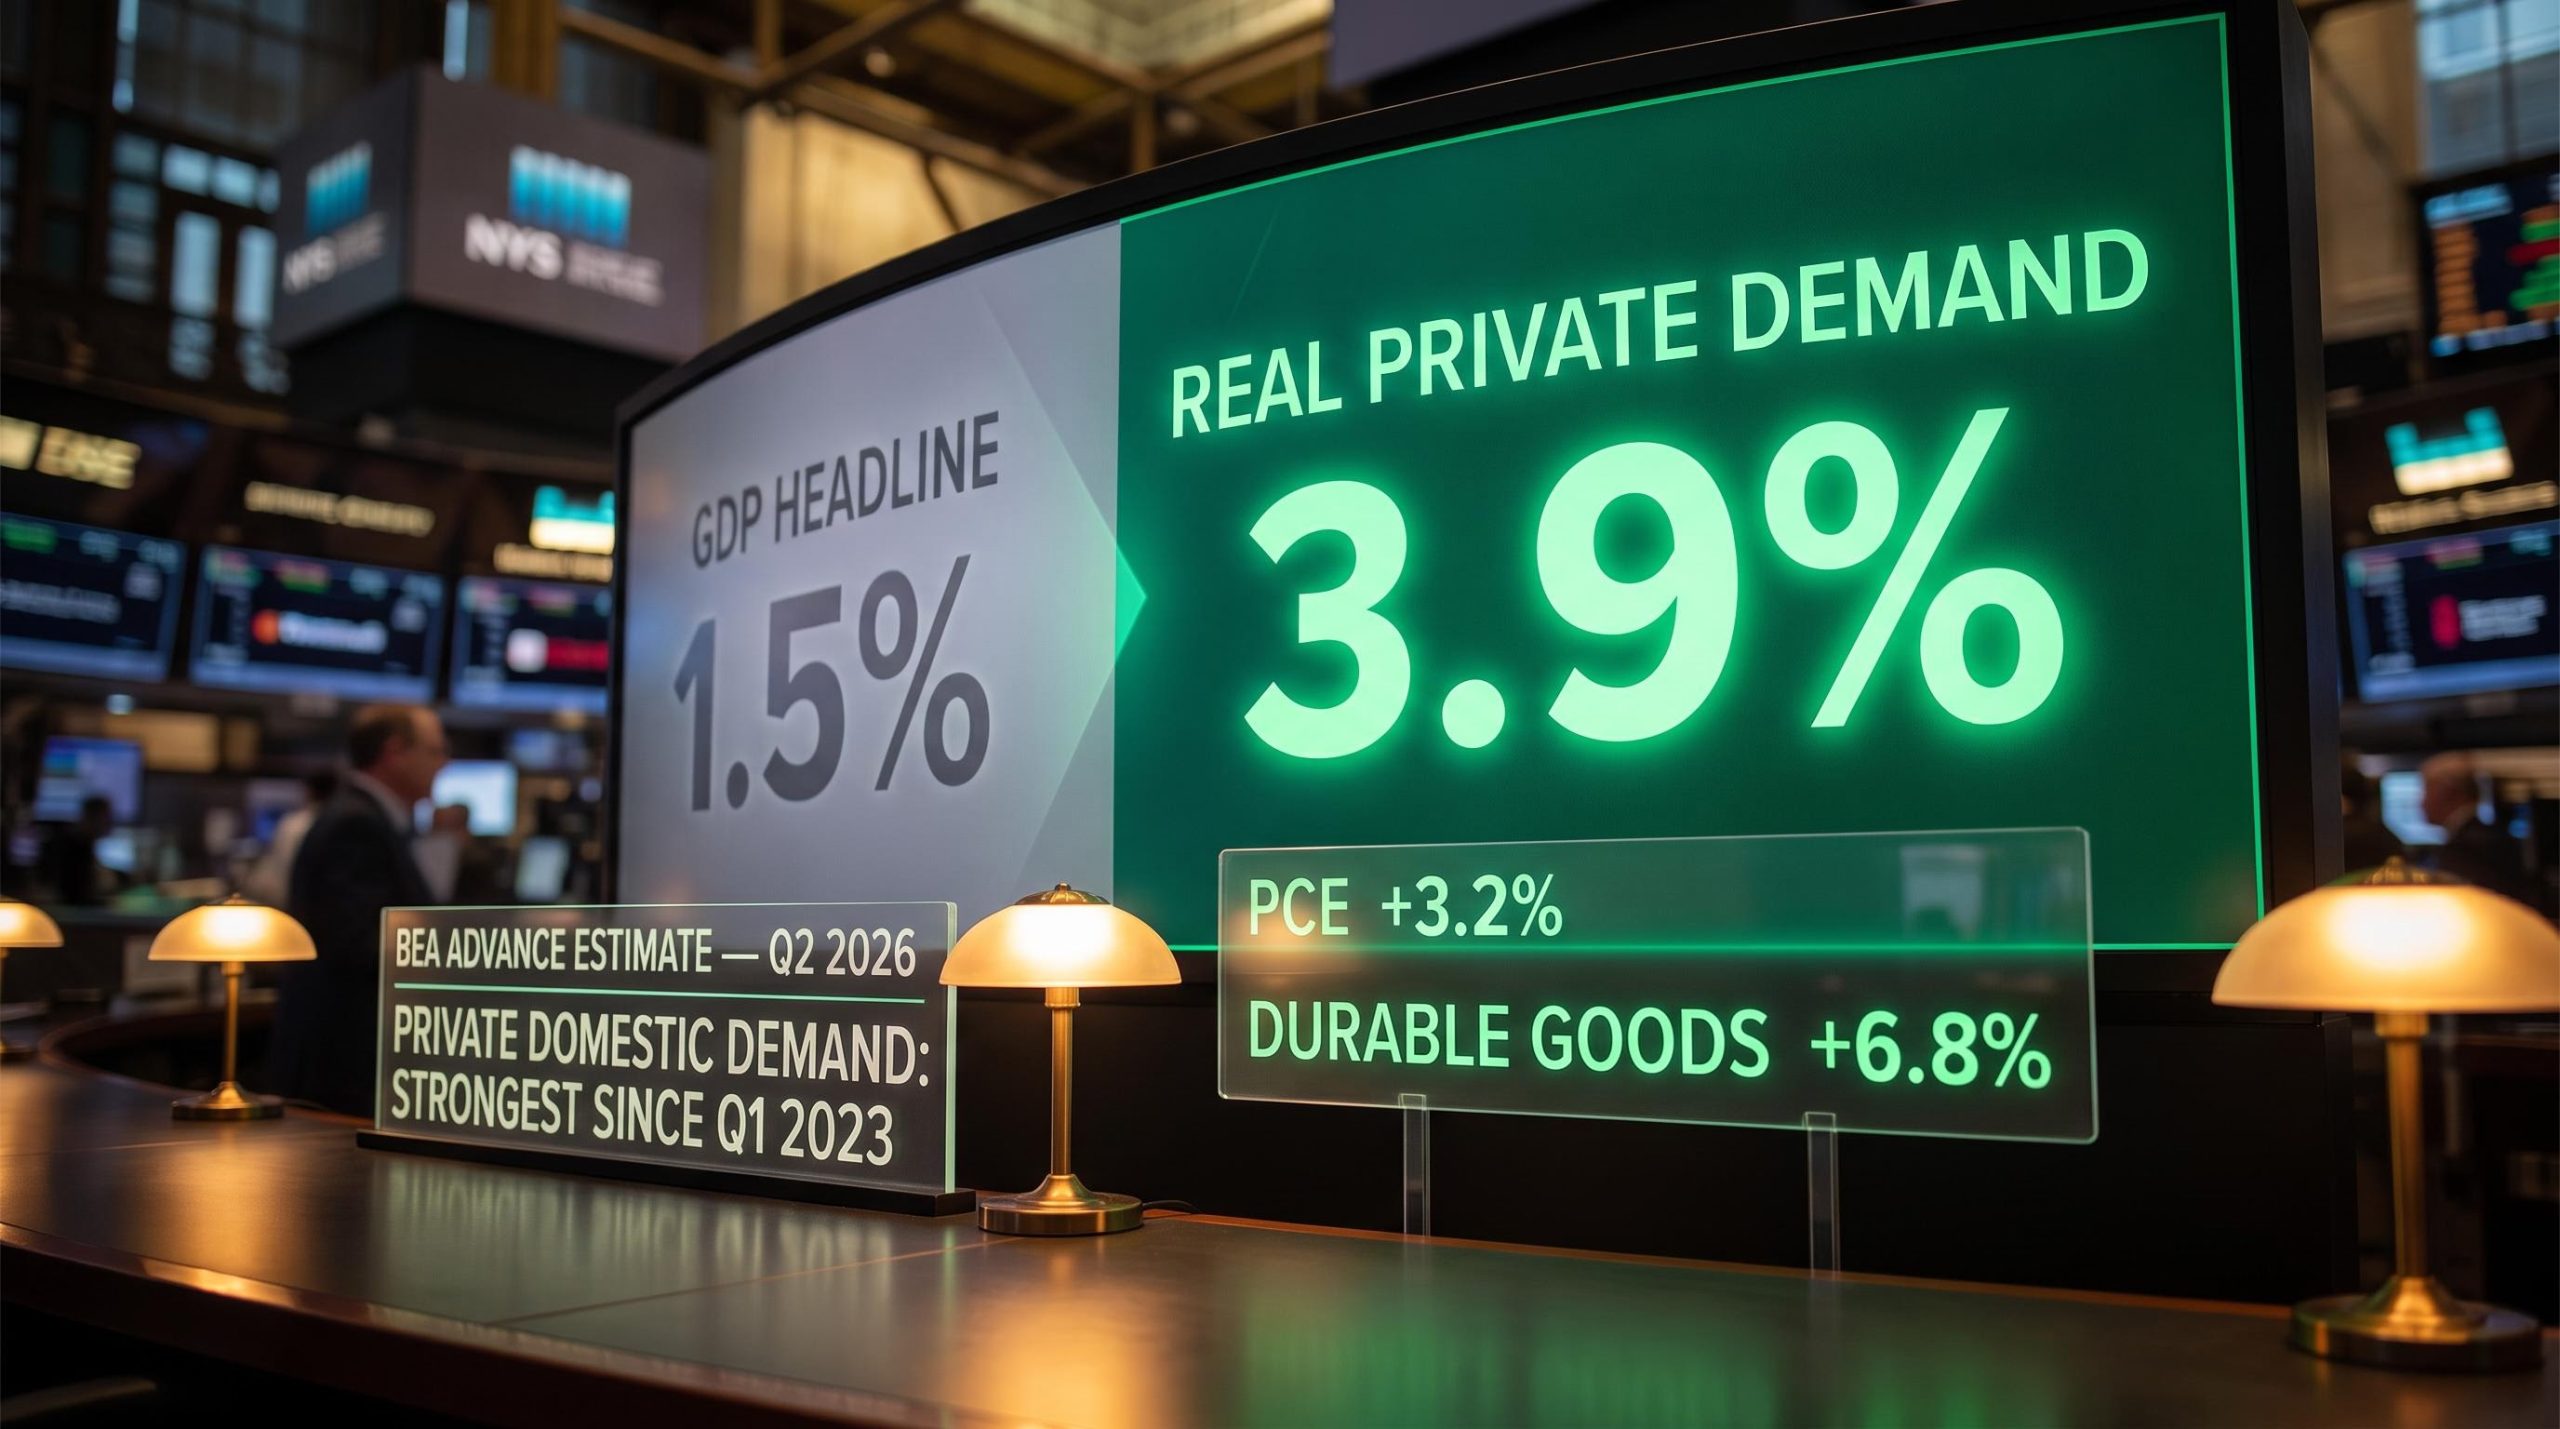
The Bureau of Economic Analysis (BEA) reported on 30 July 2026 that the U.S. economy grew at 1.5% annualised in Q2 2026. That number is already being cited as evidence of a slowdown. It is the wrong number to be watching.
Strip out the mechanical effects of inventory drawdowns, a wider trade deficit, and reduced government spending, and the private economy grew at roughly 3.3% to 3.9% annualised in Q2. That puts private demand at a pace not seen since early 2023. The gap between what the headline shows and what the underlying data say is not a minor rounding issue. It is the difference between a slowing economy and one running at meaningful acceleration.
Here is how to read this GDP report the way analysts actually read it, what the composition tells you about where the U.S. economy stands heading into the second half of 2026, and why the metric most investors track is the least useful one in the release.
Three mechanical forces dragged the headline down
Before a single consumer swiped a card or a single factory shipped an order, three components had already written most of the Q2 headline. Each one subtracted growth from the top-line figure, and none of them reflects deterioration in private-sector demand.
- Inventory drawdown (approximately 0.7 percentage points subtracted): Businesses drew down existing stock rather than producing new goods, a pattern that typically signals demand outrunning supply, not weakening end sales. According to ISM’s June manufacturing PMI, the Customers’ Inventories Index held in “too low” territory and was declining at a quickening rate, a condition that historically supports future production increases. Based on that setup, a restocking boost in the coming quarters would not be surprising, which is worth keeping in mind when building your second-half outlook. (Transitory)
- Import drag (1.5 percentage points per FactSet; approximately 1.0 percentage point per Reuters): The two sources differ on the precise magnitude, but the economic interpretation is consistent across both: higher imports reflect U.S. firms and households buying more, not the economy weakening. (Accounting-driven)
- Government spending decline: Federal and state spending fell in Q2, a policy-driven swing that contributed to the deceleration from 2.1% in Q1 to 1.5% in Q2. For investors focused on corporate earnings and private-sector activity, this is a separate lever entirely. (Policy-driven)
The BEA’s advance release noted that the GDP increase was “partly offset by decreases in government spending and private inventory investment.”
The 1.5% headline was largely mechanical before a single dollar of private demand entered the equation. Investors who anchor on that figure without this decomposition will misjudge the direction of the private economy.
When big ASX news breaks, our subscribers know first
What real private domestic demand actually looked like
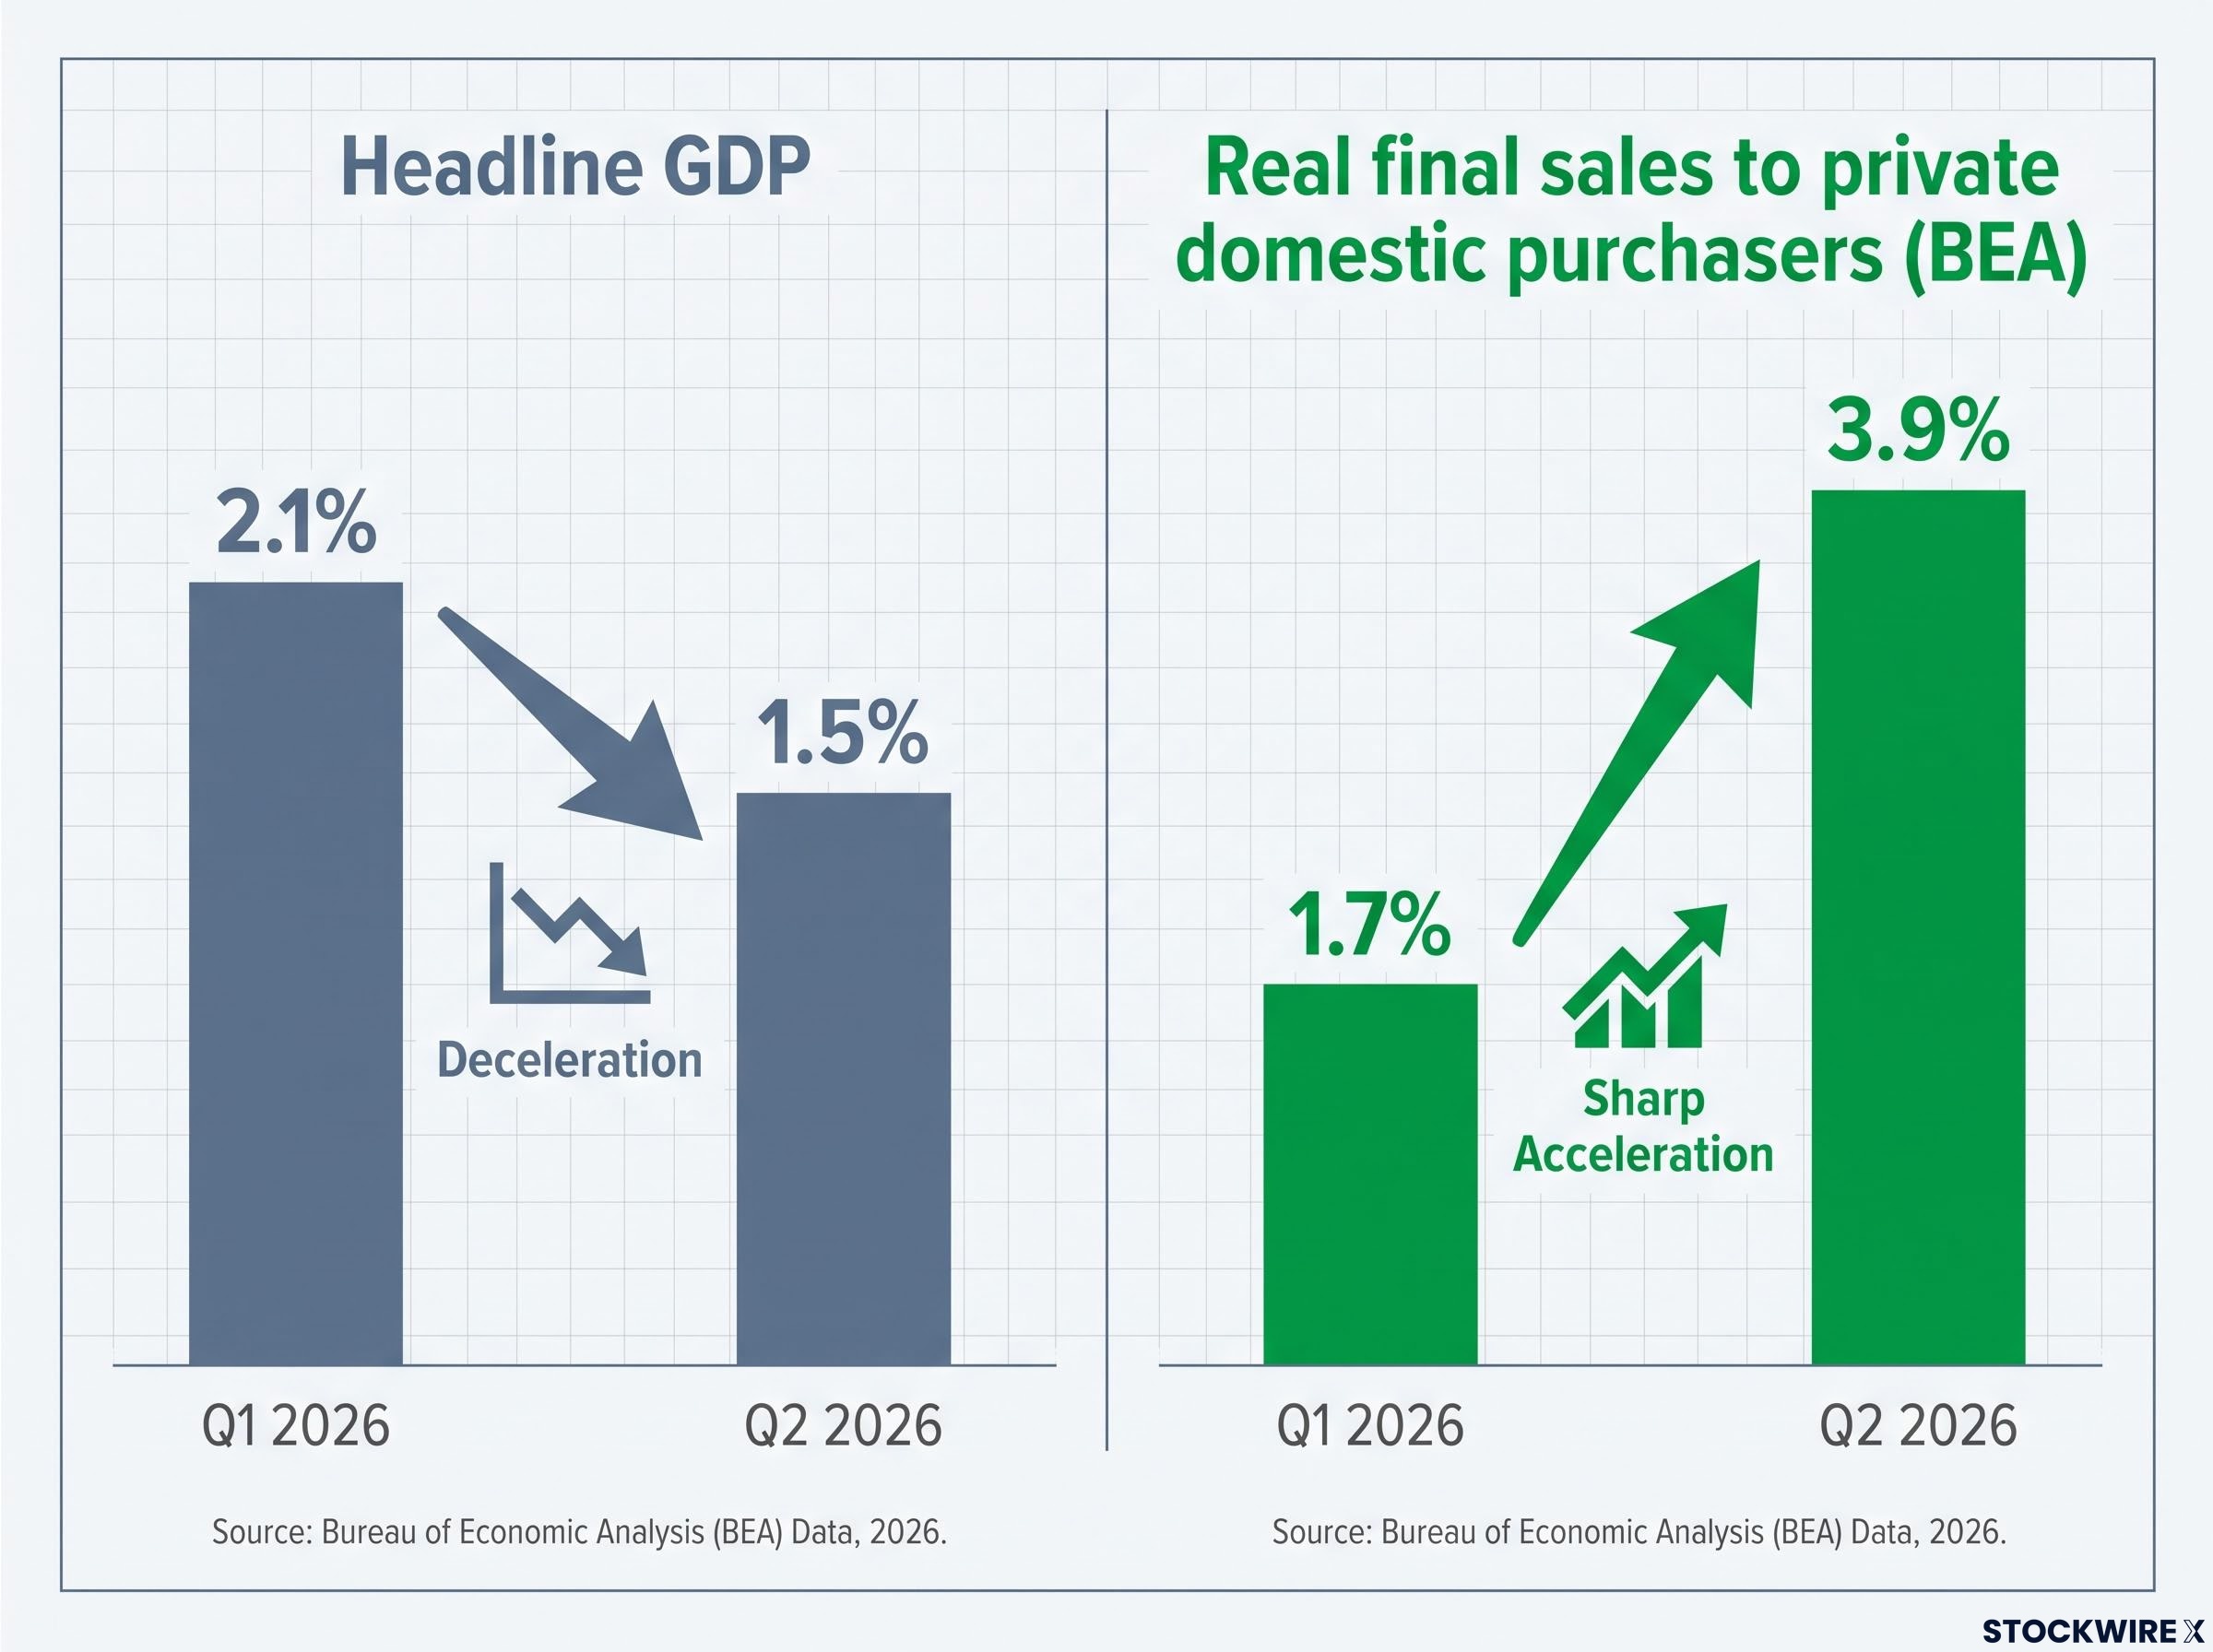
The BEA publishes a metric called “real final sales to private domestic purchasers,” which measures what households and businesses actually spent, stripped of government activity, inventories, and net exports. It is the cleanest gauge of private demand in the GDP release, and it tells a categorically different story than the headline.
| Metric | Q1 2026 | Q2 2026 | Source |
|---|---|---|---|
| Headline GDP | 2.1% | 1.5% | FactSet, 30 July 2026 |
| Real final sales to private domestic purchasers | 1.7% | 3.9% | BEA advance estimate |
| Private domestic demand (composite) | — | 3.3% | FactSet, 30 July 2026 |
| Personal consumption expenditures (PCE) | 0.5% | 3.2% | FactSet, 30 July 2026 |
The headline GDP figure fell from 2.1% to 1.5%. The BEA’s private demand metric surged from 1.7% to 3.9%, its strongest reading in over three years. FactSet’s composite of the same private domestic components registered 3.3% annualised, a pace that FactSet characterises as the best performance since Q1 2023.
This is the single most important number in the Q2 report. It is directly linked to corporate revenue potential, and it accelerated sharply in exactly the quarter the headline suggested the economy was cooling.
The same headline-versus-private-demand divergence appeared in Q1 2026, when private sector momentum ran at 2.2% annualised even as the 2.0% headline obscured it, establishing a consistent pattern across consecutive quarters rather than a one-quarter anomaly.
Consumer spending: from near-stall to the strongest quarter in years
In Q1 2026, personal consumption expenditures (PCE), the broadest measure of consumer spending, grew at just 0.5% annualised. That looked like the start of a genuine pullback.
Q2 reversed that entirely. PCE surged to 3.2% annualised, spanning both goods and services in a broad rebound that was not concentrated in any single volatile category.
The most analytically significant piece sits in the subcategories. Durable goods spending, the big-ticket discretionary purchases that households cut first when financial stress sets in, surged 6.8% annualised in Q2. That covers:
- Vehicles
- Appliances
- Electronics
A 6.8% annualised rate in durable goods is structurally incompatible with a consumer under meaningful financial pressure. Households do not accelerate spending on vehicles and appliances when they are worried about their balance sheets. The Q1 soft patch now looks like a pause, not a turning point, and that distinction matters for anyone building a view on retail, consumer discretionary, or financial services earnings in the second half.
The consumer spending resilience visible in the Q2 GDP data is corroborated by higher-frequency indicators: Bank of America card transaction growth hit its strongest year-over-year rate in more than four years in June 2026, and retail sales rose for five consecutive months through mid-year.
Business investment: what the 8.4% headline misses about breadth
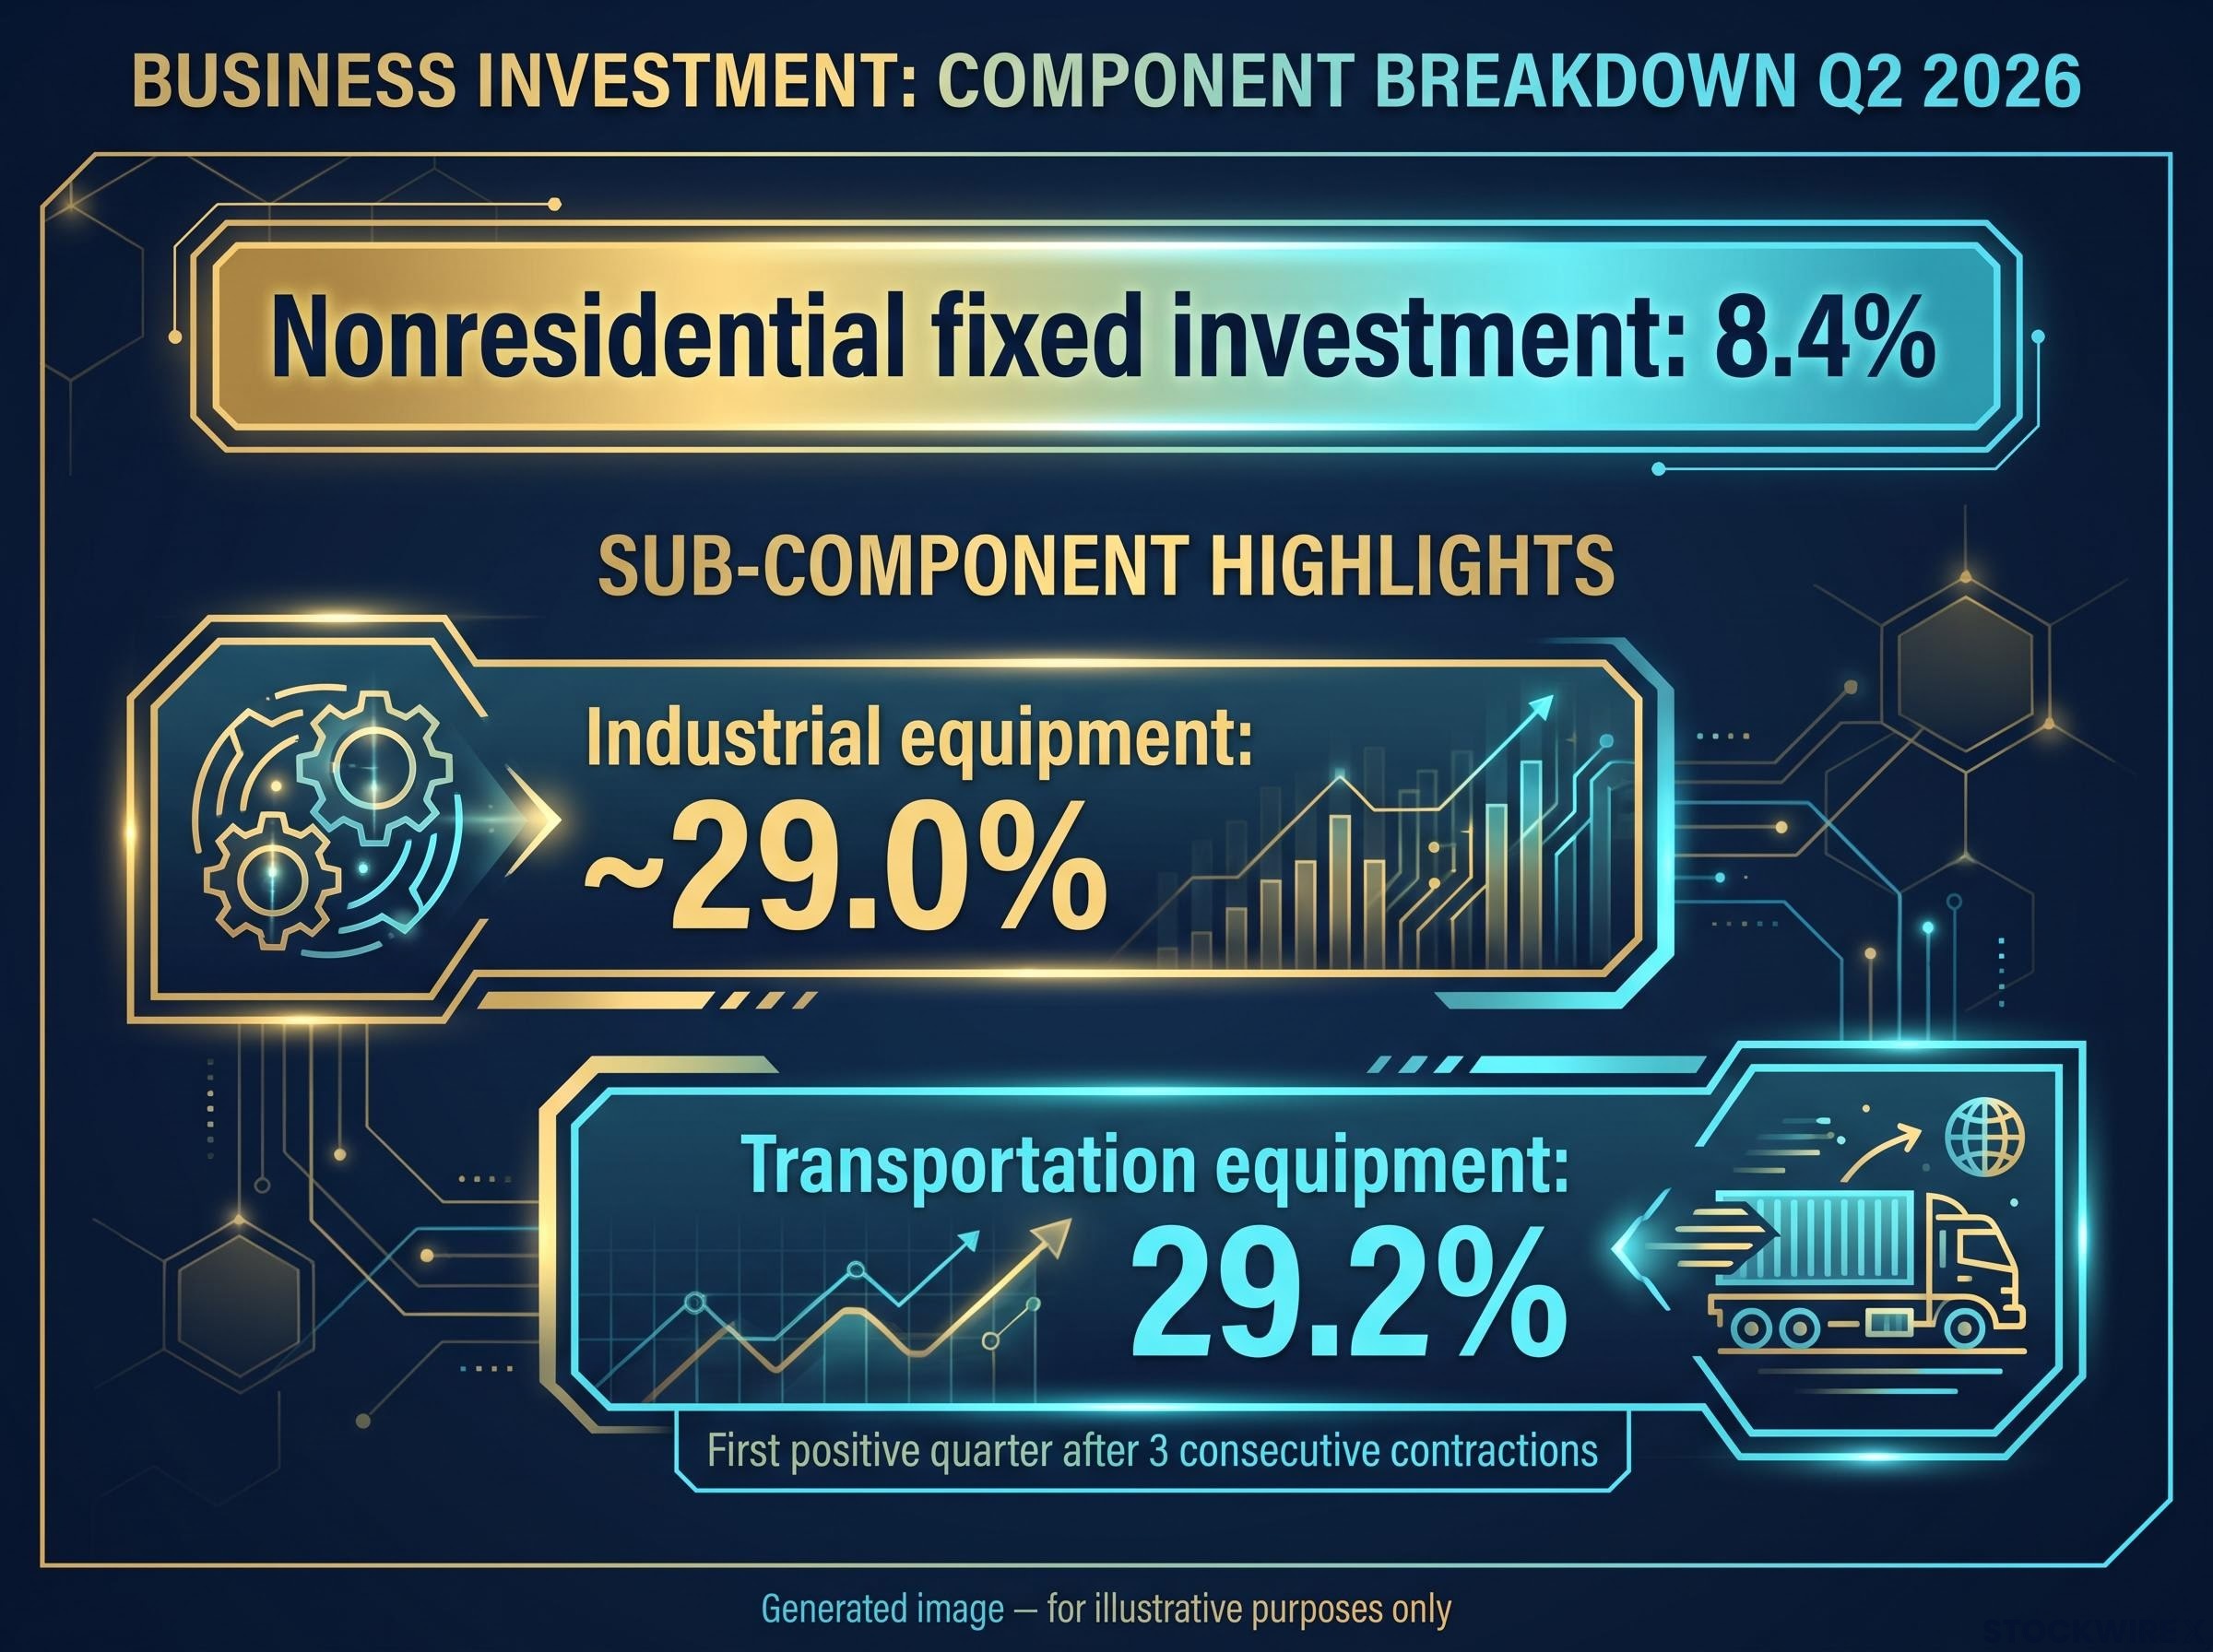
Nonresidential fixed investment, the broadest measure of business capital expenditure, grew 8.4% annualised in Q2 2026, following 10.6% in Q1. Even at the moderated pace, that is a strong reading. But the composition matters more than the headline.
The BEA described equipment gains as “widespread,” a characterisation that challenges the assumption that business spending strength is an AI-only story. The component data confirm it.
| Component | Q1 2026 | Q2 2026 | Notes |
|---|---|---|---|
| Nonresidential fixed investment | 10.6% | 8.4% | Broad-based per BEA |
| Industrial equipment | — | ~29.0% | Per FactSet, 30 July 2026 |
| Transportation equipment | Negative (3 prior quarters) | 29.2% | First positive quarter after 3 consecutive contractions |
Transportation equipment swinging back into positive territory after contracting in each of the prior three quarters, alongside nearly 30% annualised industrial equipment expansion, signals that the capex cycle has broadened well beyond the tech sector. Reuters notes that AI infrastructure buildout is a contributing factor, but the BEA data show strength spanning categories that have nothing to do with data centres or chips. If you have been sceptical of non-AI earnings upside, this data warrants a reassessment of that position.
Core capital goods orders posted back-to-back monthly gains of 0.9% in June and 1.9% in May 2026, a forward-looking signal that the broad capex expansion visible in the Q2 GDP data was already being confirmed in the order pipeline heading into Q3.
How GDP accounting turns import strength into a headline liability
The import subtraction is one of the most commonly misread lines in any GDP release. Here is how the mechanic actually works:
- The accounting rule: GDP subtracts all imports from the headline figure, because the goods were produced abroad, not domestically. In Q2, imports subtracted 1.5 percentage points (per FactSet) or approximately 1.0 percentage point (per Reuters) from the headline.
- Why it does not signal domestic weakness: Much of what was imported, including technology hardware that is designed in the United States but assembled overseas, also registers as a positive contribution in the business investment and consumer spending categories. The import line removes those goods from the tally; the investment and consumption lines restore them. When viewed across the whole account, the impact on measured domestic demand washes out.
Fisher Investments has characterised this dynamic as an accounting asymmetry, and the Q2 data illustrate it clearly. The import drag was equally large in Q1 2026, yet Q1 domestic demand was substantially weaker. The trade line simply does not track the direction of private demand.
For investors tempted to interpret a widening trade deficit as a sign of economic fragility, the GDP mechanics demonstrate the opposite: the import surge reflects U.S. firms and households buying more. That is a demand signal, not a weakness signal.
What Q2 2026 GDP actually tells investors about the second half
Four signals from the Q2 composition build the case for a more constructive view than the headline alone supports:
- Private domestic demand acceleration: The 3.3%-3.9% range is the strongest since Q1 2023, representing genuine momentum, not a borderline reading.
- Consumer spending rebound: PCE jumped from 0.5% to 3.2%, with durable goods at 6.8%, confirming household purchasing power remains intact.
- Breadth of business investment: Near-30% annualised growth in both industrial and transportation equipment dismantles a narrow, tech-only capex thesis.
- Housing inflection: Residential investment posted 1.5% annualised growth in Q2, marking its first quarterly gain after five consecutive periods of contraction, a sign that a persistent structural headwind may finally be easing.
The ISM’s customer inventory shortfall adds a potential fifth factor: should businesses need to rebuild depleted stock to keep pace with demand, inventory accumulation could shift from a growth headwind to a growth contributor in the periods ahead.
One quarter does not make a trend, and these figures are a BEA advance estimate subject to revision. But as a reading of where the private economy stands in mid-2026, the composition points toward strength, not fragility. The combination of strong consumer spending, broad capex, a housing inflection, and an inventory restocking setup describes a private economy that is building momentum, and your second-half outlook should weight that composition more heavily than the 1.5% headline.
For readers who want to stress-test the constructive Q2 reading against the bearish macro scenarios that have circulated through 2026, our dedicated guide to the stagflation risk debate covers how six major institutions are positioning portfolios to survive both a soft landing and a stagflation-lite outcome.
Reading GDP the way analysts do, not the way headlines do
The 1.5% headline reflects the combined drag of inventories, imports, and government spending: components that are transitory, accounting-driven, or policy-driven. None of them tells you anything about private-sector demand.
Private demand ran at 3.3%-3.9% annualised in Q2, a rate that marks a multi-year high not reached since Q1 2023. That is the metric that tracks corporate revenue conditions, consumer health, and business confidence, and it is the number to watch in every future BEA release.
Real final sales to private domestic purchasers is not an obscure footnote. It is the line that separates signal from noise in GDP. Knowing which metric to track, and why it diverges from the headline, gives you a durable analytical edge that applies to every GDP print, not just this one.
This article is for informational purposes only and should not be considered financial advice. Investors should conduct their own research and consult with financial professionals before making investment decisions. These figures are drawn from the BEA’s advance estimate and are subject to revision in subsequent releases.