Amazon was up roughly 9% after hours on 30 July 2026. Apple was down roughly 6%. Both companies beat on headline revenue. The divergence, not the beats, is the story.
These two results landed on the same evening, and they share more than a calendar date. Both companies are competing for the same scarce component: high-bandwidth memory, the specialised DRAM chips that power everything from AI data centres to iPhones. One company is profiting from that competition. The other is paying for it.
Here is what the numbers actually show about who wins and who absorbs cost when AI demand runs hot, and what the structural gap between Amazon and Apple earnings tells you about where the pressure sits next quarter.
Amazon’s blowout quarter, by the numbers
The scale of the beat is the first thing to register. Amazon reported net sales of $200.6 billion for Q2 2026, up 20% year over year, clearing the $196.4 billion consensus by roughly 2.1%. That is a comfortable top-line beat by mega-cap standards.
The operating income beat was the more analytically significant number. Amazon delivered $27.5 billion in operating income, up 43% year over year, beating consensus of $23.53 billion by 16.9%. A revenue beat of 2% tells you the company sold more. An operating income beat of nearly 17% tells you it is converting growth into profit at a rate Wall Street significantly underestimated.
The key headline financials:
- Net sales: $200.6 billion, up 20% year over year
- Operating income: $27.5 billion, up 43% year over year, beating consensus by 16.9%
- EPS: $5.75 versus consensus of approximately $1.81-$1.82
- North America net sales: $116.1 billion, up 16% year over year, beating the $113.8 billion estimate
EPS: $5.75 versus consensus of $1.81-$1.82. That single data point captures the magnitude of the quarter. This was not a marginal beat.
The after-hours move of approximately 9.3% confirmed that investors read this as a genuine quality beat, not a mixed bag dressed up in headline figures.
When big ASX news breaks, our subscribers know first
AWS sets an 18-quarter speed record, and it is not close
AWS net sales reached $42.2 billion, up approximately 37% year over year, beating the street estimate of $40.5 billion by roughly 4.2%. According to Amazon, the segment had not grown at this pace in four and a half years, placing the rate of expansion at its strongest point since roughly 2021.
The margin beat deserves its own beat. AWS operating income came in at $16.6 billion, with an operating margin of 39.4% versus a consensus expectation of 33.8%. A 5.6 percentage point margin beat at a $42 billion revenue scale is not a rounding adjustment; it signals structural operating leverage that consensus models had not captured.
| Metric | Actual | Consensus | Beat |
|---|---|---|---|
| Revenue | $42.2B | $40.5B | +4.2% |
| Operating Margin | 39.4% | 33.8% | +5.6 percentage points |
The AWS AI division and the custom silicon business each surpassed annualised revenue run-rates of $25 billion, with both more than doubling on a year-over-year basis. The annualised revenue run-rate for AWS overall sits at $169 billion. Capacity is largely reserved into 2027, with significant commitments extending into 2028. The payback period on AI infrastructure spending averages just under three years, while the underlying server hardware typically remains productive for five to six years and the bulk of capacity is sold under contracts spanning at least five years.
CEO Andy Jassy projected that AWS could eventually generate $1 trillion in annual revenue. With a 39.4% operating margin and contracted demand two-plus years out, the projection reads less like aspiration and more like arithmetic.
The combination of margin performance and forward reservation depth tells you that AWS’s growth is not speculative spending chasing demand. The demand is contracted, and the economics are already proving out.
Hyperscaler earnings in Q1 2026 established the trajectory that Amazon extended in Q2: AWS posted its fastest quarterly growth in over three years, Google Cloud grew 63% year over year, and combined capex across the four largest operators reached $130.65 billion in a single quarter, a spending pace that directly drives the memory allocation dynamics affecting Apple.
Apple beat the headline, but the market read the footnotes
The headline numbers were genuinely strong. Apple reported revenue of $109.42 billion, up 16.4% year over year, beating the $108.85 billion estimate. EPS rose 28.7% to $2.02 versus the $1.89 estimate. Net income advanced 27.1% to $29.79 billion. iPhone revenue hit $54.25 billion, setting June quarter records across every geography.
By any conventional measure, this was a solid quarter. Then the market read the footnotes.
Services revenue came in at $30.74 billion, up 12.1%, but missed the $31.36 billion estimate by 2%. This matters disproportionately. Services is Apple’s highest-margin, most durably recurring segment, and it is supposed to buffer hardware cyclicality. When Services misses, investors question the earnings-mix thesis that supports Apple’s premium valuation.
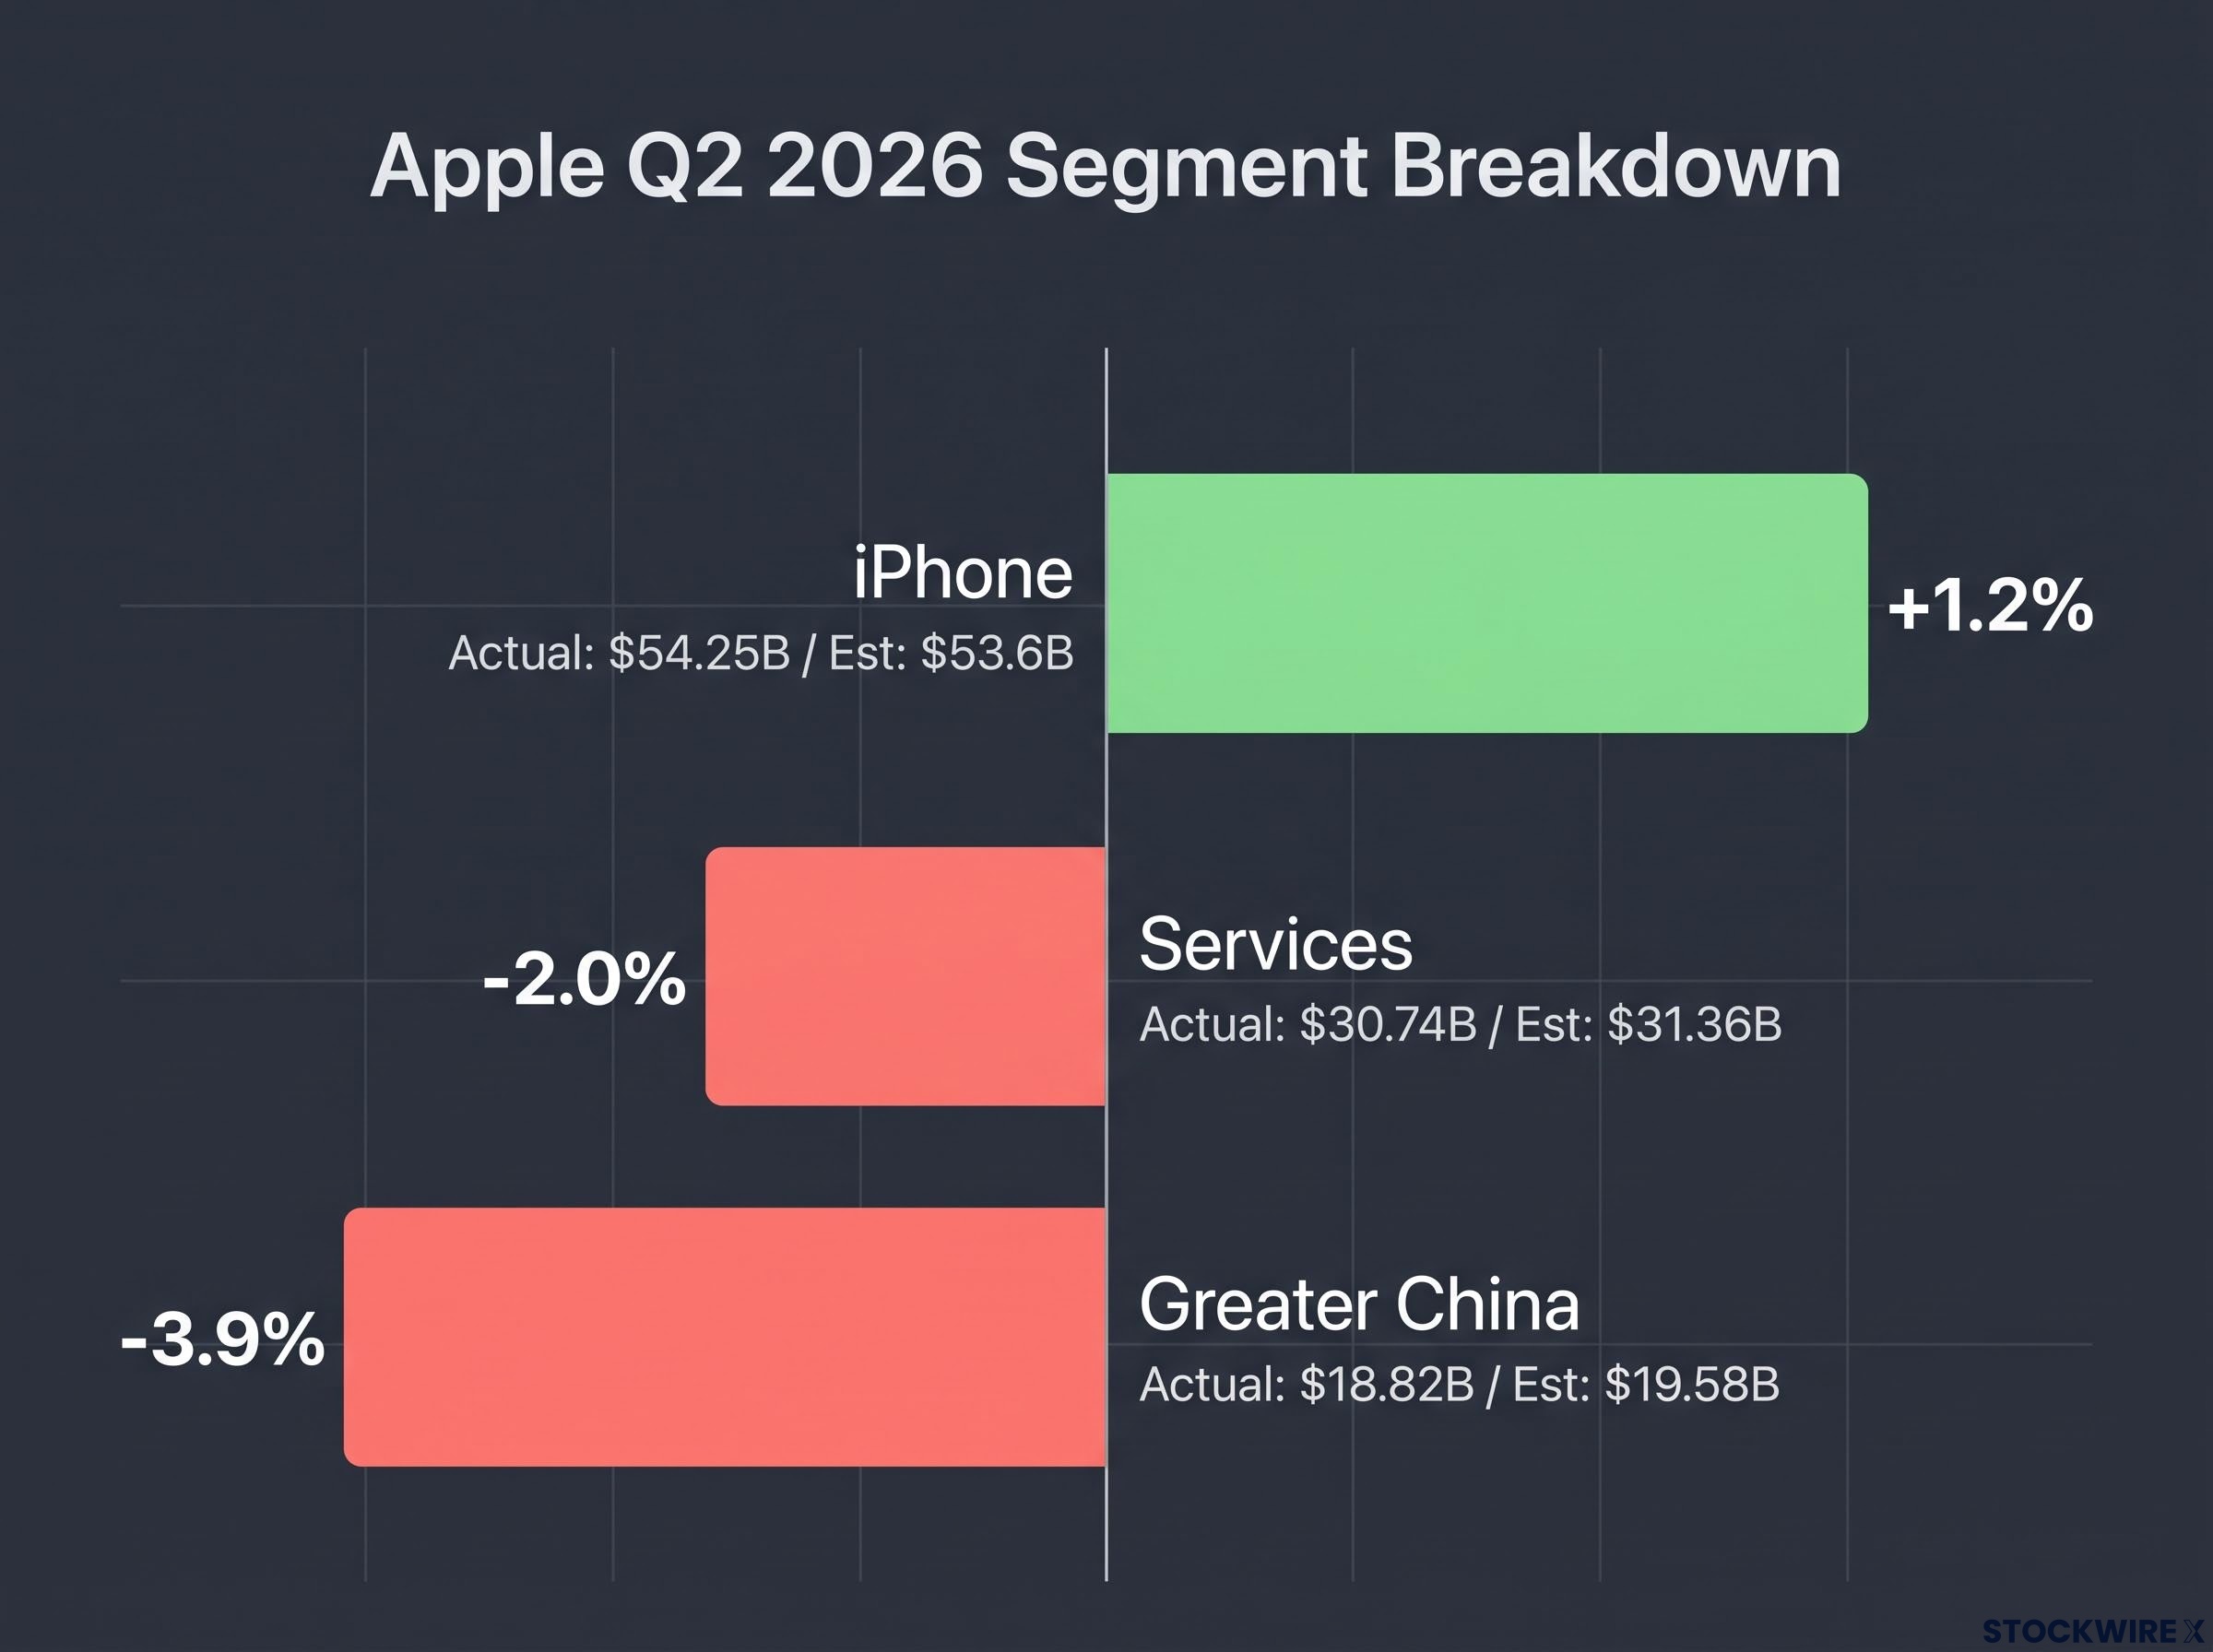
| Segment | Revenue Actual | Revenue Estimate | Beat/Miss |
|---|---|---|---|
| iPhone | $54.25B | $53.6B | +1.2% |
| Services | $30.74B | $31.36B | -2.0% |
| Greater China | $18.82B | $19.58B | -3.9% |
Services missed by 2%. In isolation, that looks modest. In context, Services is the segment that justifies Apple’s valuation premium over hardware peers. A miss here weighs more than a beat in iPhone.
Greater China revenue of $18.82 billion missed the $19.58 billion estimate by 3.9%, despite record global iPhone performance. That makes it harder to dismiss as a sector-wide slowdown.
Then the gross margin asterisk. Apple reported 50.1% gross margin, up 80 basis points sequentially. However, management disclosed that tariff refunds contributed a favourable swing of roughly 2 percentage points to that result, which means the underlying margin, stripped of that one-time benefit, looks considerably weaker than the headline number implies.
A 6% after-hours decline on a quarter with 28.7% EPS growth tells you Apple’s investors are not pricing the current quarter. They are pricing what the Services and China misses signal about the durability of Apple’s earnings mix.
Apple’s valuation premium had already embedded a strong quarter into the share price before results were announced: a 22.7% year-to-date rally meant that confirming the existing thesis rather than upgrading it was not sufficient to move the stock higher, a dynamic that amplified the market’s negative read on the Services miss and DRAM disclosures.
What DRAM is, and why Apple cannot easily escape it
DRAM, or dynamic random-access memory, is the short-term working memory in essentially every computing device. It holds the data a processor needs to access immediately. Every iPhone, Mac, and iPad contains it, and there is no practical substitute. You cannot engineer around it or swap in an alternative component.
The supply side makes the problem worse. Global DRAM production is concentrated among just three suppliers worldwide. That concentrated structure limits Apple’s ability to play suppliers against each other or diversify sourcing quickly.
DRAM supply constraints have been identified by Google CEO Sundar Pichai as the primary limiter on AI infrastructure expansion, a finding that reframes the memory cost problem Apple faces as a consequence of hyperscaler demand rather than a discrete Apple-specific procurement failure.
Apple disclosed a memory cost trajectory that has moved in only one direction across the past four reported periods:
- December 2025 quarter: Memory spend increased relative to the prior period
- March 2026 quarter: Outlays climbed again on a sequential basis
- June 2026 quarter: Costs continued to rise quarter on quarter
- September 2026 quarter: Management indicated further increases are expected
CEO Tim Cook characterised the DRAM pricing environment as “extreme and historically rare”, an unusually blunt assessment from a management team that typically avoids alarmist framing.
Apple has already passed costs through to consumers via product price increases, a measure management framed as extraordinary rather than routine. The company disclosed it is “evaluating potential options” to address supply and pricing constraints, but offered no specifics.
That lack of specifics is itself informative. It tells you Apple does not yet have a structural fix in hand. This is a cost pressure without a visible near-term resolution, not a problem the company has already solved behind the scenes.
Amazon’s capex and Apple’s costs trace back to the same source
The connection between these two earnings reports runs deeper than the calendar. Amazon revised its full-year 2026 capex figure upward to $220 billion, with management attributing part of the increase to the rising cost of memory, compared with a prior estimate of around $200 billion. AWS demand is outstripping available capacity.
When hyperscalers commit this level of spending, memory suppliers prioritise their orders. That affects availability and pricing for every other buyer downstream, including device makers like Apple.
Two companies, one supply constraint, two opposite outcomes:
- Infrastructure providers (AWS) convert AI-driven demand into revenue and margin expansion, supported by long-term contracts and pricing power
- Device makers (Apple) absorb the input cost consequences of demand they are not generating, facing a trade-off between compressing margins and raising consumer prices
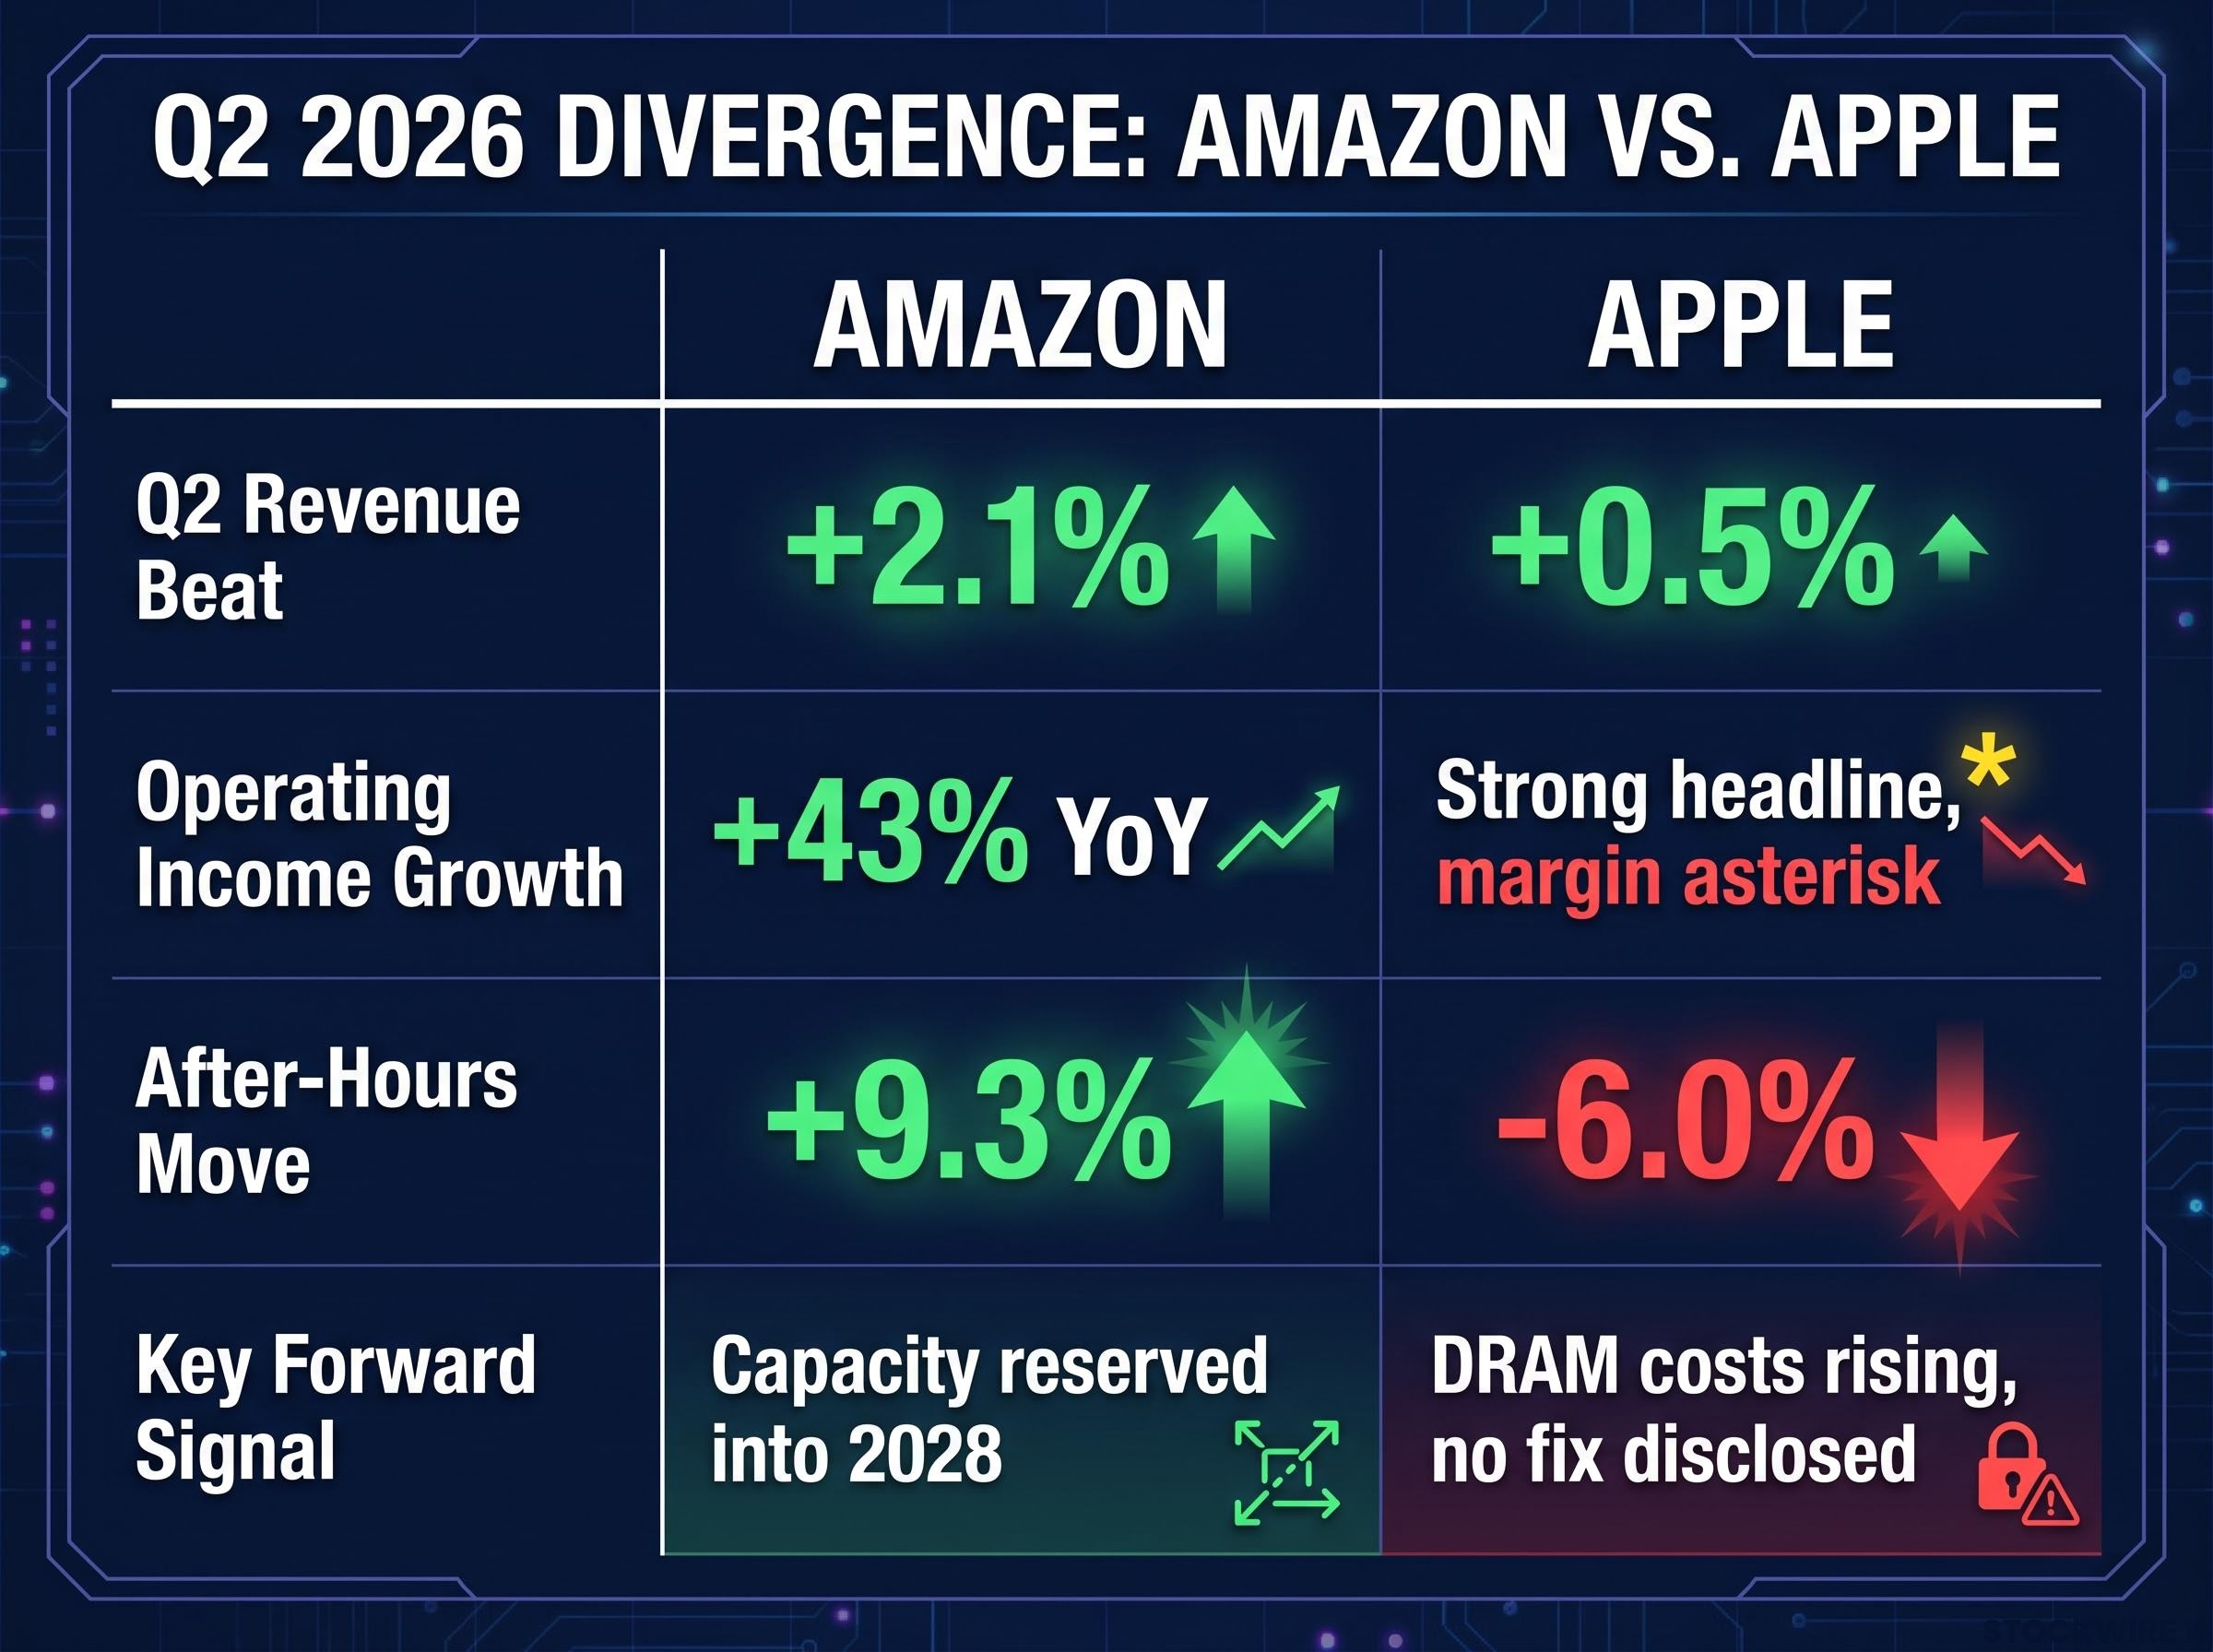
| Metric | Amazon | Apple |
|---|---|---|
| Q2 Revenue Beat | +2.1% | +0.5% |
| Operating Income Growth | +43% YoY | Strong headline, margin asterisk |
| After-Hours Move | +9.3% | -6.0% |
| Key Forward Signal | Capacity reserved into 2028 | DRAM costs rising, no fix disclosed |
Apple’s Q4 2026 revenue guidance of 9-11% year-over-year growth implies a midpoint of approximately $113 billion, missing the $114.84 billion analyst estimate by 1.6%. Stacked on Services underperformance and an unresolved DRAM problem, the guidance miss compounds the picture for investors hoping the worst of the cost pressure was already absorbed.
Amazon’s capex increase and Apple’s cost warning are not two separate corporate decisions. They are the same supply constraint viewed from opposite ends of the value chain, and the after-hours moves confirm which position equity markets are rewarding right now.
For readers wanting the full picture on what is driving Amazon’s $220 billion capex revision, our deep-dive into hyperscaler AI capital expenditure covers the combined $725 billion 2026 spending programme across all four major operators and the debt financing structure that funds it.
Where these results leave investors heading into Q3
Amazon guided Q3 2026 revenue to $197-$202 billion, with a midpoint of $199.5 billion, roughly 2.2% below the $204 billion consensus. For a company with a documented pattern of conservative guidance, this does not necessarily negate the AWS momentum story. Bookings for 2027 AWS capacity are heavily committed, and reservations for 2028 are already well advanced, with Amazon targeting power capacity double its 2025 base by the close of 2027. The demand visibility is long.
Forward reservations for 2027 are substantially locked in, and a meaningful portion of 2028 capacity is already spoken for. That pre-sold demand pipeline is the context for why Amazon’s below-consensus guidance reads more as pattern than signal.
Apple’s guidance miss carries different weight. The midpoint of approximately $113 billion fell below the $114.84 billion estimate, and unlike Amazon, the miss is layered on top of a Services underperformance and a DRAM cost problem without a stated resolution timeline.
The three variables to watch from here:
- AWS Q3 actuals versus the $197-$202 billion guidance range: whether the guidance conservatism pattern holds or whether growth is genuinely moderating
- Apple September quarter memory cost trajectory: whether the sequential increases flatten, escalate, or force further consumer price adjustments
- Apple Services recovery: whether the Q3 miss was a one-quarter blip or the start of a deceleration trend that undermines the earnings-mix thesis
Amazon’s below-consensus Q3 guidance does not negate the AWS momentum story; guidance conservatism is a documented pattern. But Apple’s guidance miss, stacked on Services underperformance and a DRAM problem without a stated resolution, gives investors less benefit of the doubt to extend. The AI infrastructure buildout cycle that drove AWS’s record quarter has not peaked, and its interaction with component supply chains will continue shaping results at both companies.
This article is for informational purposes only and should not be considered financial advice. Investors should conduct their own research and consult with financial professionals before making investment decisions. Forward-looking statements regarding revenue projections, capex plans, and cost trajectories are subject to change based on market developments and company performance.