The US economy just posted its weakest growth print in three quarters, and long-dated Treasury yields are climbing to multi-week highs. In a straightforward macro world, soft growth pulls yields down. That is not what is happening.
Three signals landed on 30 July 2026, and they arrived together: a US GDP miss driven by an import mechanism most investors will misread, a bond market that refuses to price in rate relief, and a Bank of England hold where three members voted to raise rates. Taken individually, each can be rationalised. Taken together, they describe a macro regime with specific, actionable implications for how you position across asset classes and geographies.
Here is the framework for reading all three signals correctly: which parts of the GDP miss matter, what the yield move is actually pricing, and how central bank divergence across four major economies creates positioning choices you can act on now, not commentary you file away.
Why the US GDP miss is less alarming than the headline suggests
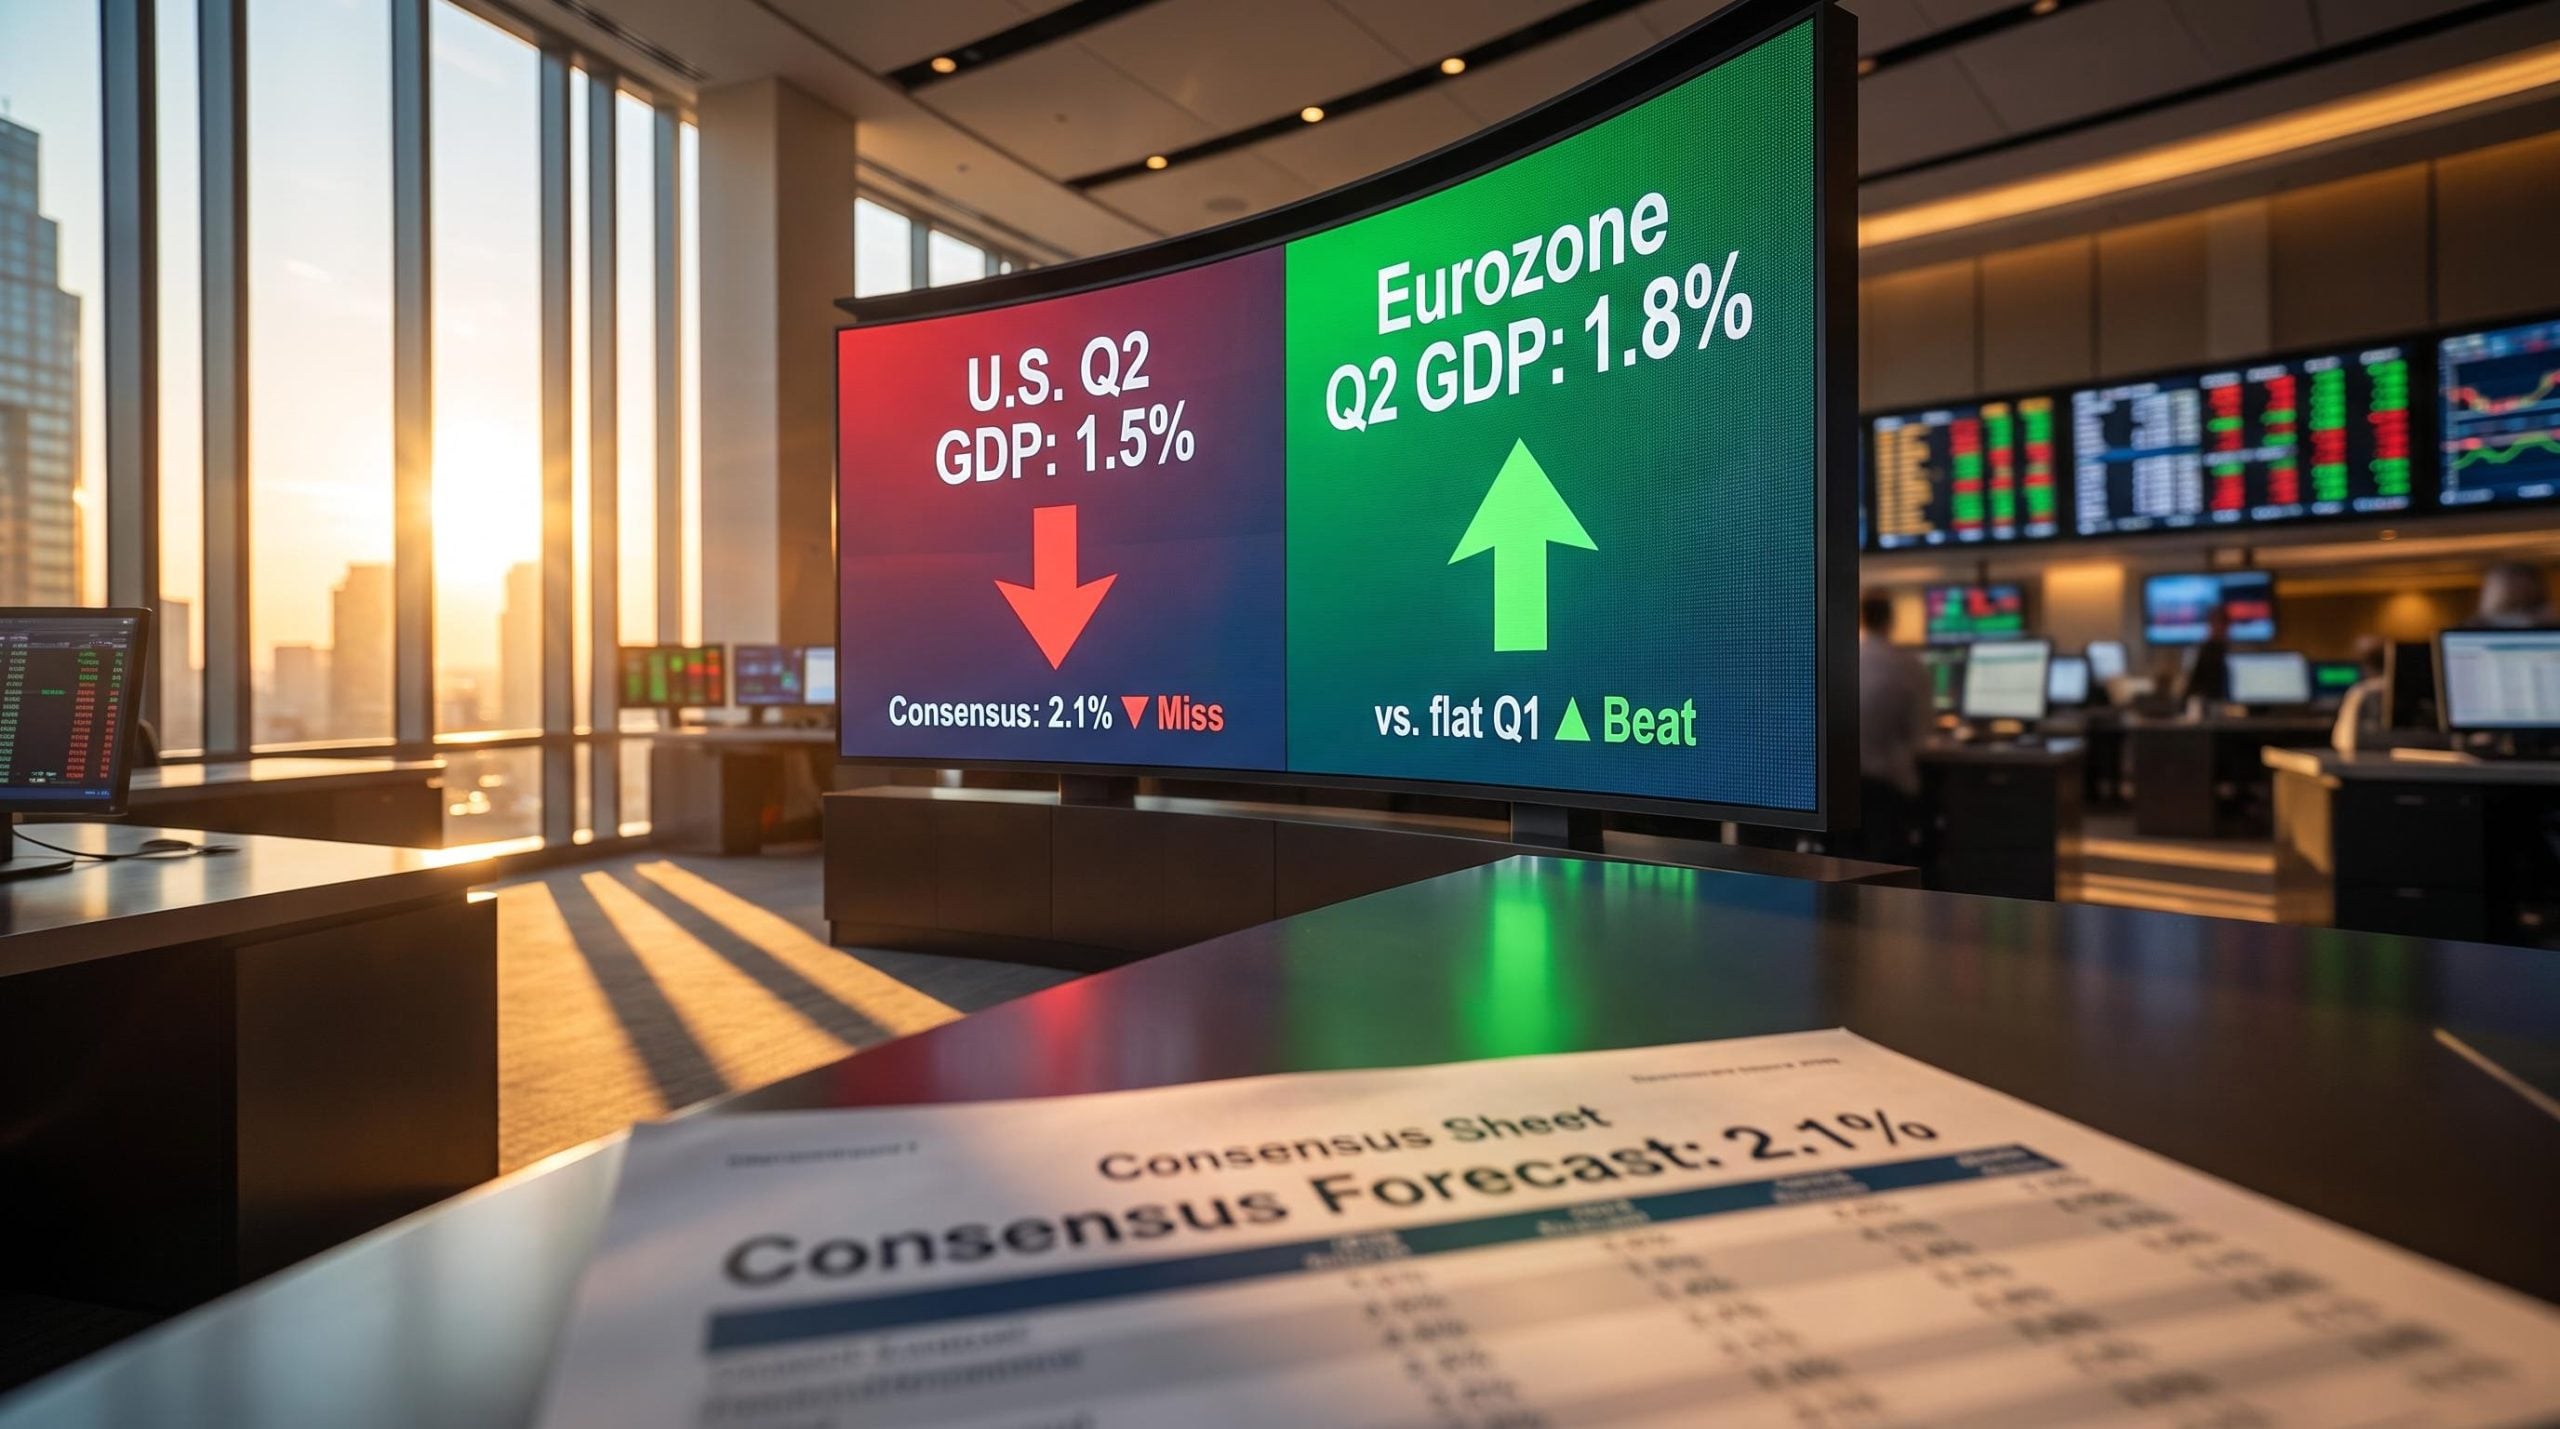
The Bureau of Economic Analysis advance estimate, released on 30 July 2026, put Q2 2026 US real GDP growth at an annualised 1.5%. The market had pencilled in something closer to 2.1%. The miss looks like a growth scare. The mechanism tells a different story.
Import volumes jumped 11.5% over the quarter, with AI chip procurement accounting for a significant share of that surge. Because imports are subtracted from output in GDP accounting, that wave of semiconductor shipments knocked roughly 1.5 percentage points off the headline number, even though the spending itself reflected demand strength rather than economic deterioration.
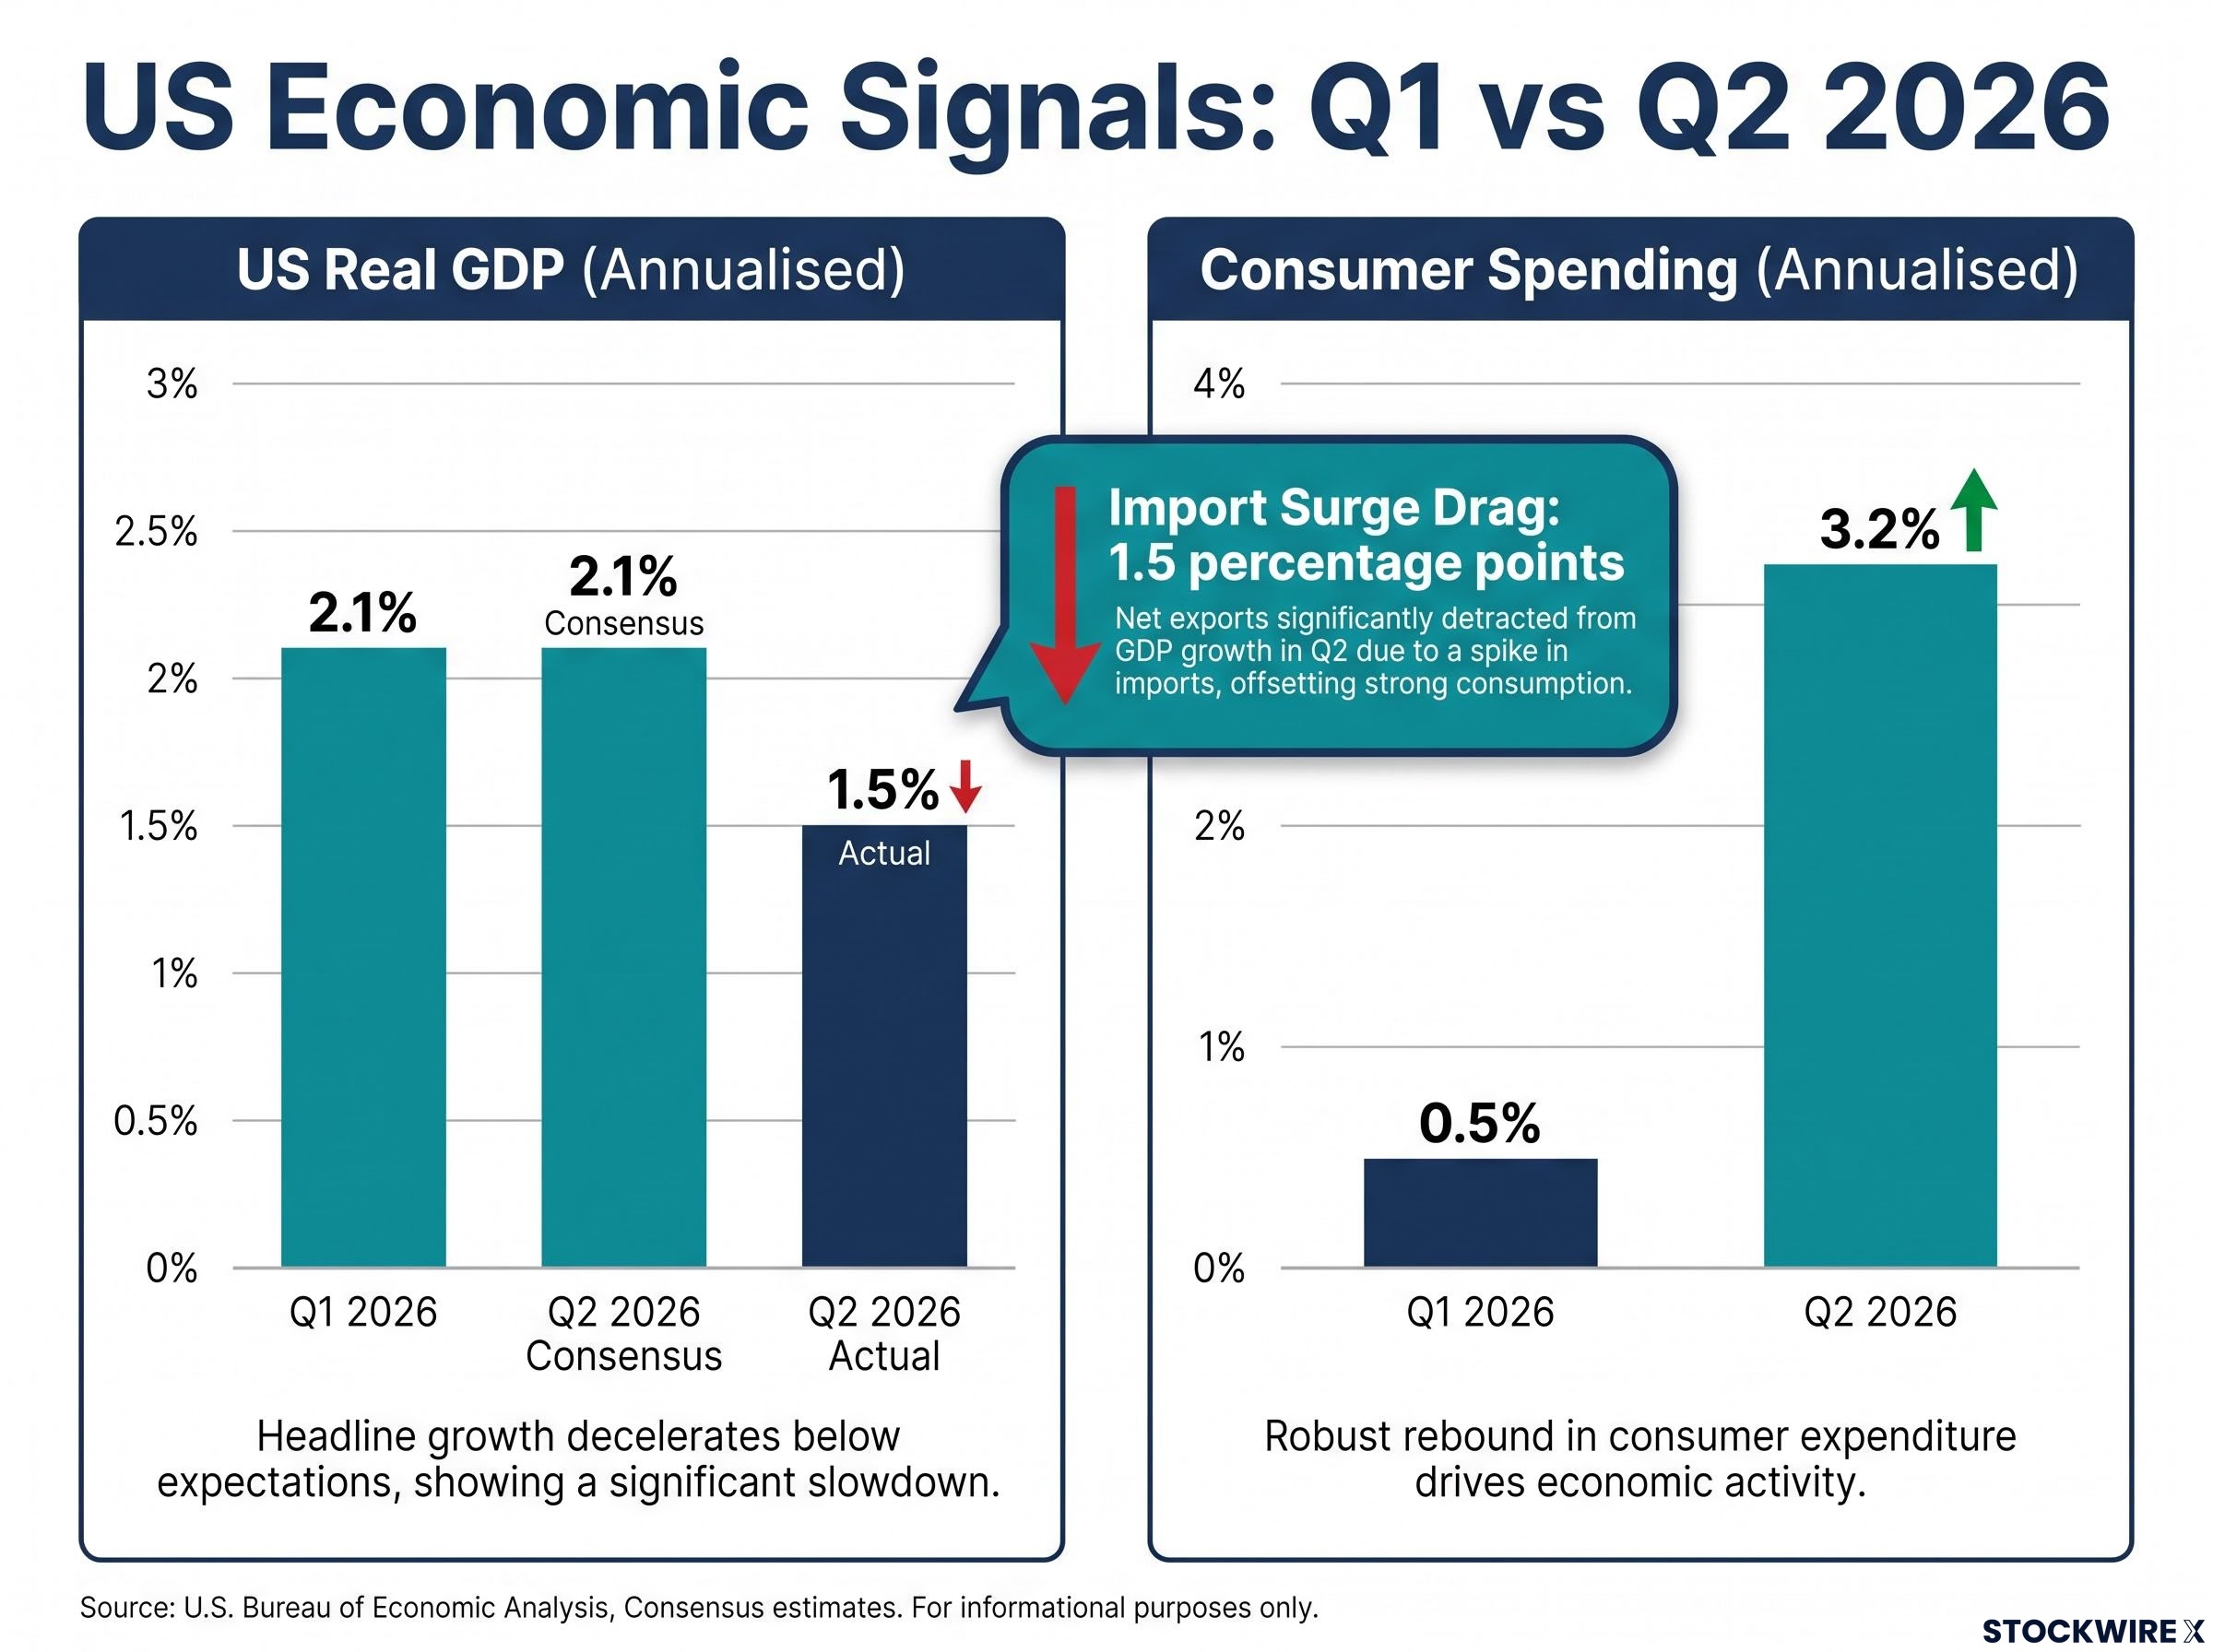
Here is what the GDP print actually contained:
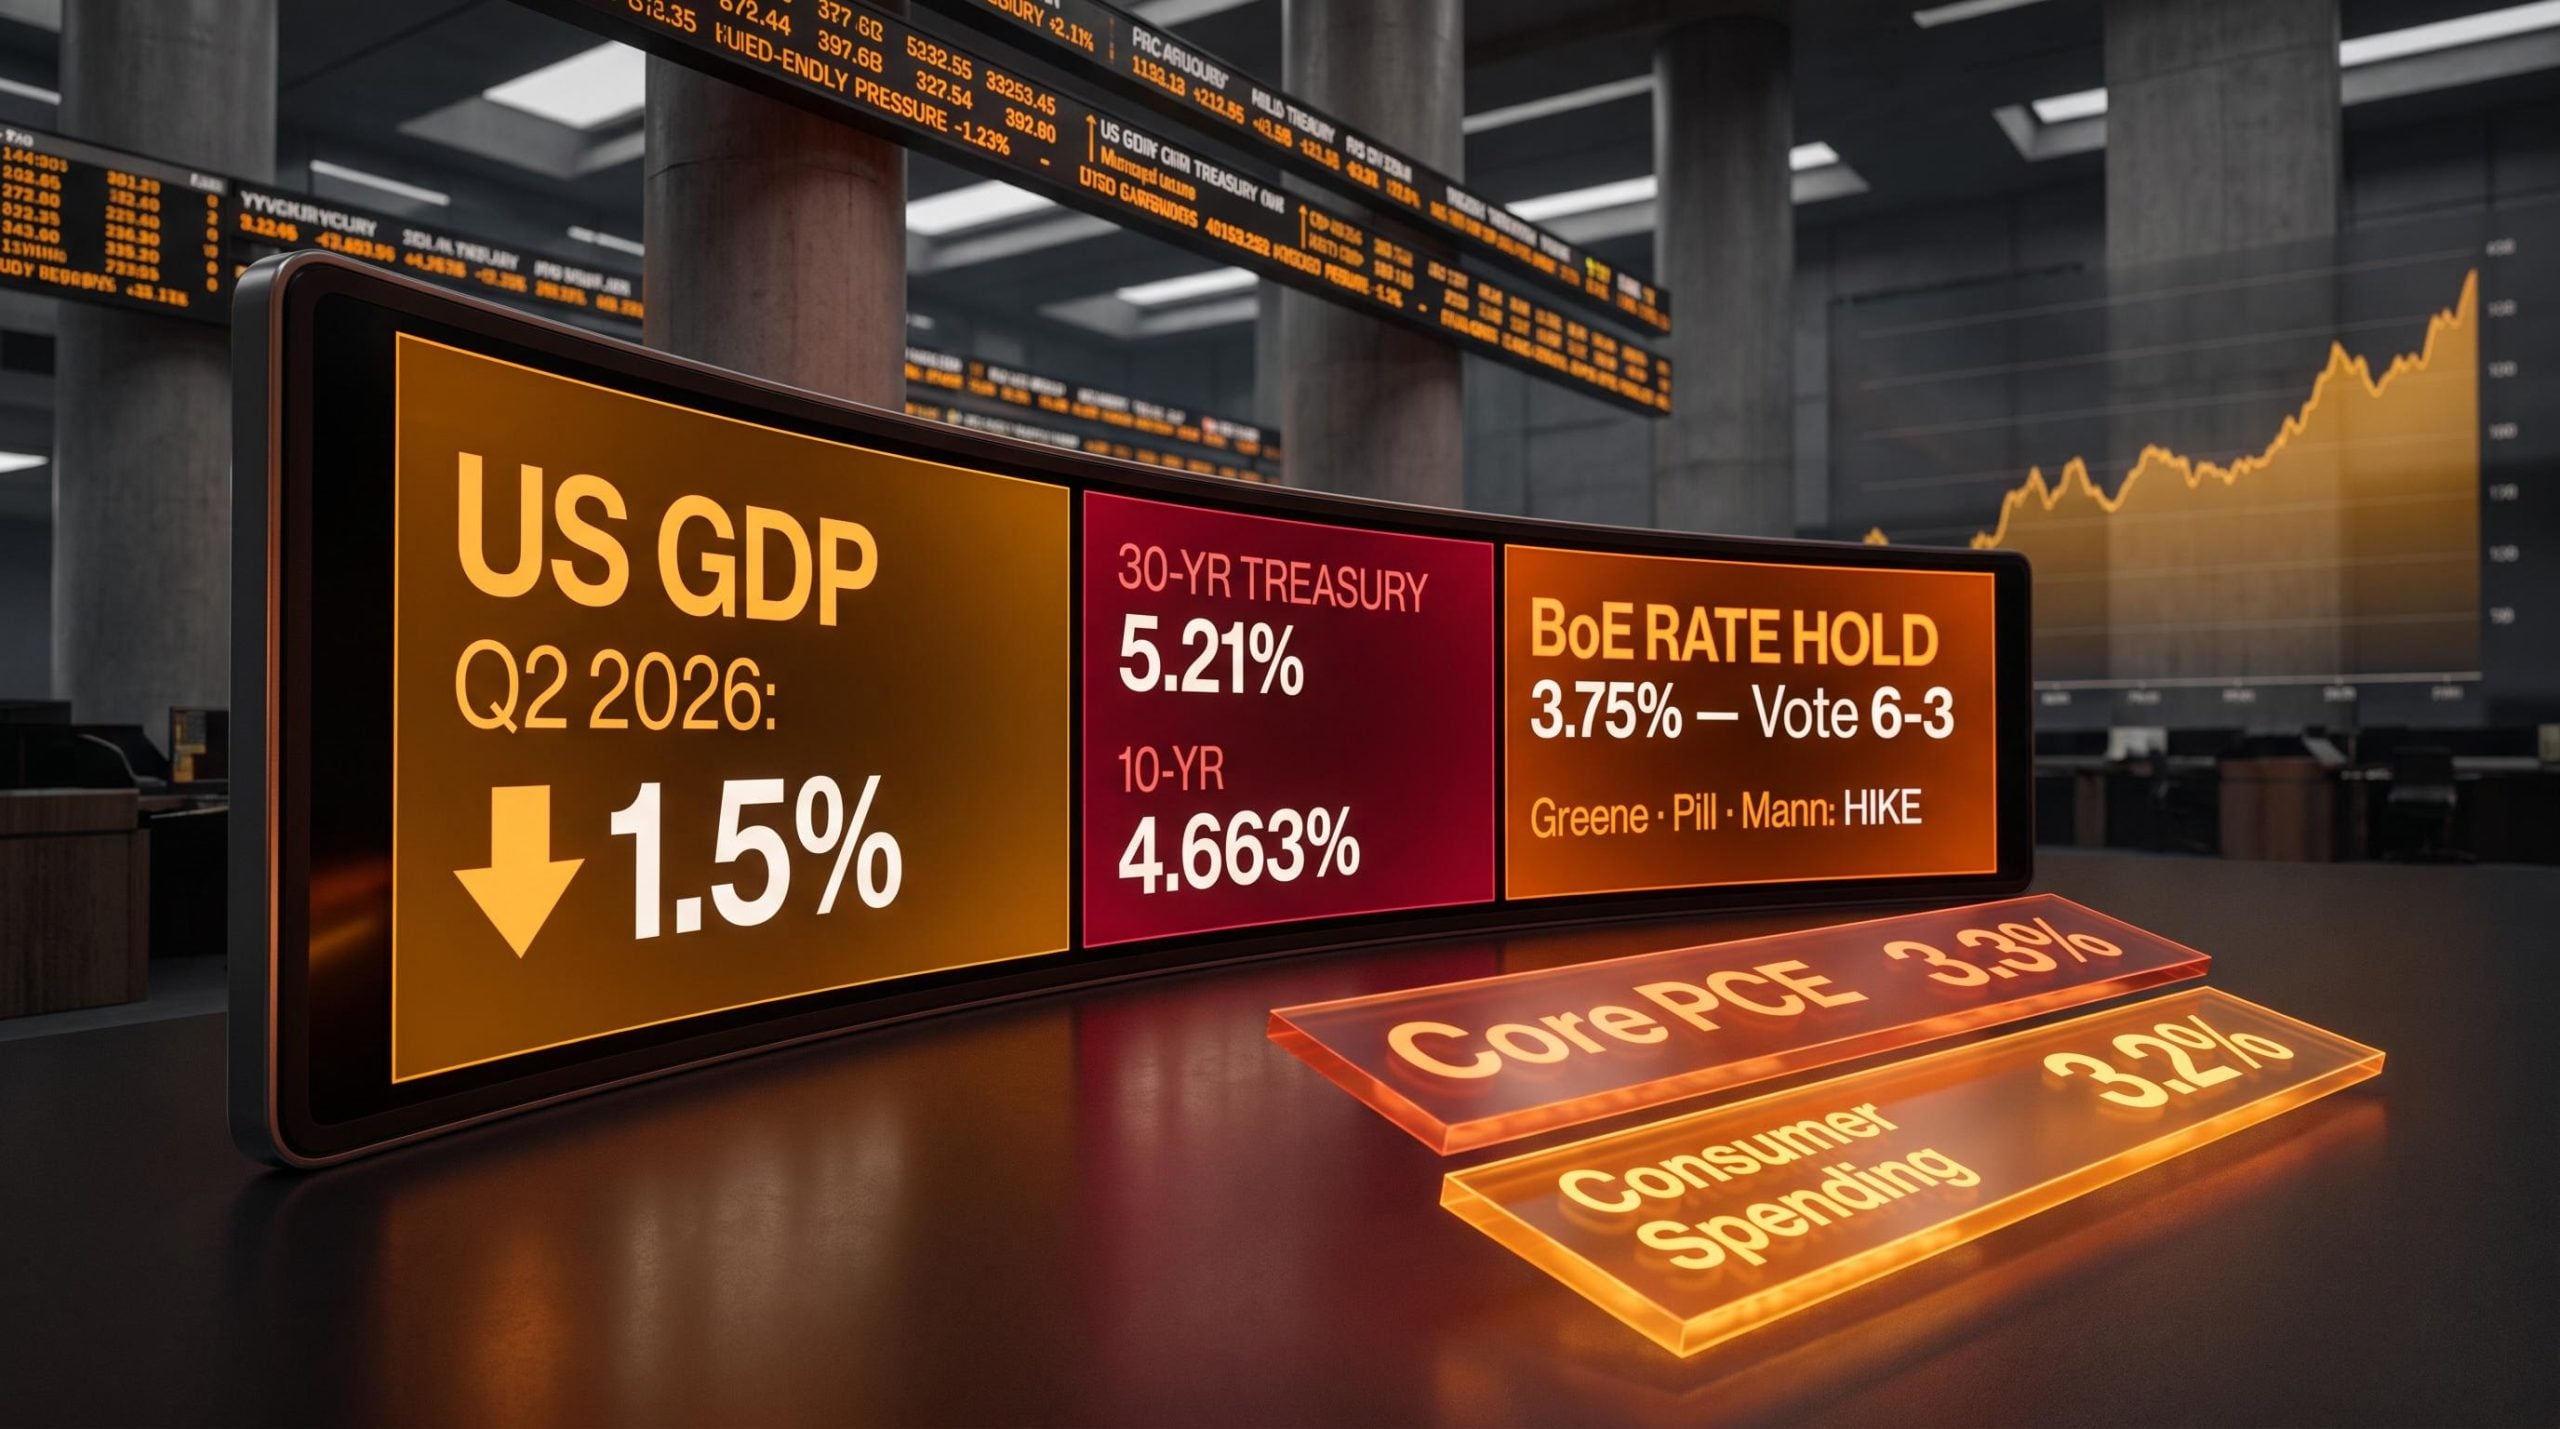
- The headline: 1.5% annualised growth, down from 2.1% in Q1 2026 and below consensus
- What drove the miss: a 1.5 percentage point drag from the import surge, concentrated in AI chip shipments
- What the underlying demand picture showed: consumer spending accelerated to 3.2% annualised, up from 0.5% in Q1
Consumer spending at 3.2% annualised, up from 0.5% the prior quarter, is the single most important number in this release. It tells you domestic demand is accelerating, not contracting.
The GDP miss tells you that import-driven distortions, not collapsing demand, are the story. Positioning for a recession trade based purely on this print would be premature. The AI chip import mechanism is structurally important: capital expenditure surging into AI procurement can simultaneously suppress GDP accounting and boost earnings for AI-linked companies. The headline and the underlying economy are saying different things.
AI hardware investment is systematically undercounted in GDP accounting because imported semiconductors reduce the net credit to output, meaning the import drag visible in Q2 2026 data reflects a known structural feature of how BEA methodology handles technology capex cycles rather than an anomalous distortion.
When big ASX news breaks, our subscribers know first
What rising Treasury yields are actually pricing in
Long-dated US Treasury yields reached multi-week highs on 31 July 2026 despite the GDP miss. That apparent contradiction resolves once you separate the growth and inflation sides of the Federal Reserve’s reaction function.
Yield normalisation, not a structural crisis, is the more defensible frame for current 30-year Treasury levels: bid-to-cover ratios across major sovereign debt markets remain at or above ten-year averages, and pre-QE US inflation averaged 2.8% annually during a decade when yields traded near current levels.
| Asset | Yield / Rate | Session Move | Context |
|---|---|---|---|
| US 30-year Treasury | 5.21% | Up 1bp | Highest since 7 July |
| US 10-year Treasury | 4.663% | Up 0.89% | Multi-week high |
| Core PCE (annualised) | 3.3% | In line with consensus | Still above 2% Fed target |
The growth side of the Fed’s dual mandate has softened, but not enough to trigger rapid or aggressive rate cuts. The inflation side remains the binding constraint. The June 2026 core PCE reading (the Fed’s preferred inflation gauge, stripping out food and energy price volatility) printed at 0.1% for the month, a touch softer than the 0.2% that had been expected. Even so, the annualised figure remains at 3.3%, still well clear of the 2% target. Headline PCE was reported at approximately 3.7% year-on-year, though that figure has not been independently verified across all sources.
The term premium is rising for a reason
The term premium is the extra yield investors demand to hold long-dated bonds instead of rolling shorter-dated ones. It is compensation for uncertainty, not just for current rate expectations.
When the growth signal is ambiguous and inflation remains sticky, the bond market does not rally on soft GDP prints. It demands more yield to hold duration. The result is a steepening bias at the long end of the curve that makes this environment structurally difficult for long-duration assets. Not full stagflation, but a slower-growth-plus-elevated-inflation mix that punishes anyone sitting in 20- or 30-year paper without compensation.
What the yield move tells you is that bond markets are not treating the GDP miss as the opening of a rate-cutting window. If you hold long-duration bonds, you may be sitting on an unrewarded inflation risk rather than a well-priced soft-landing bet.
The Bank of England’s divided hold and what dissent signals
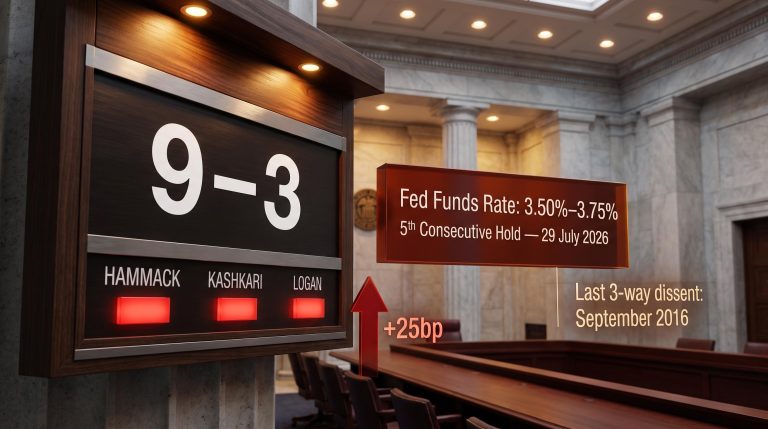
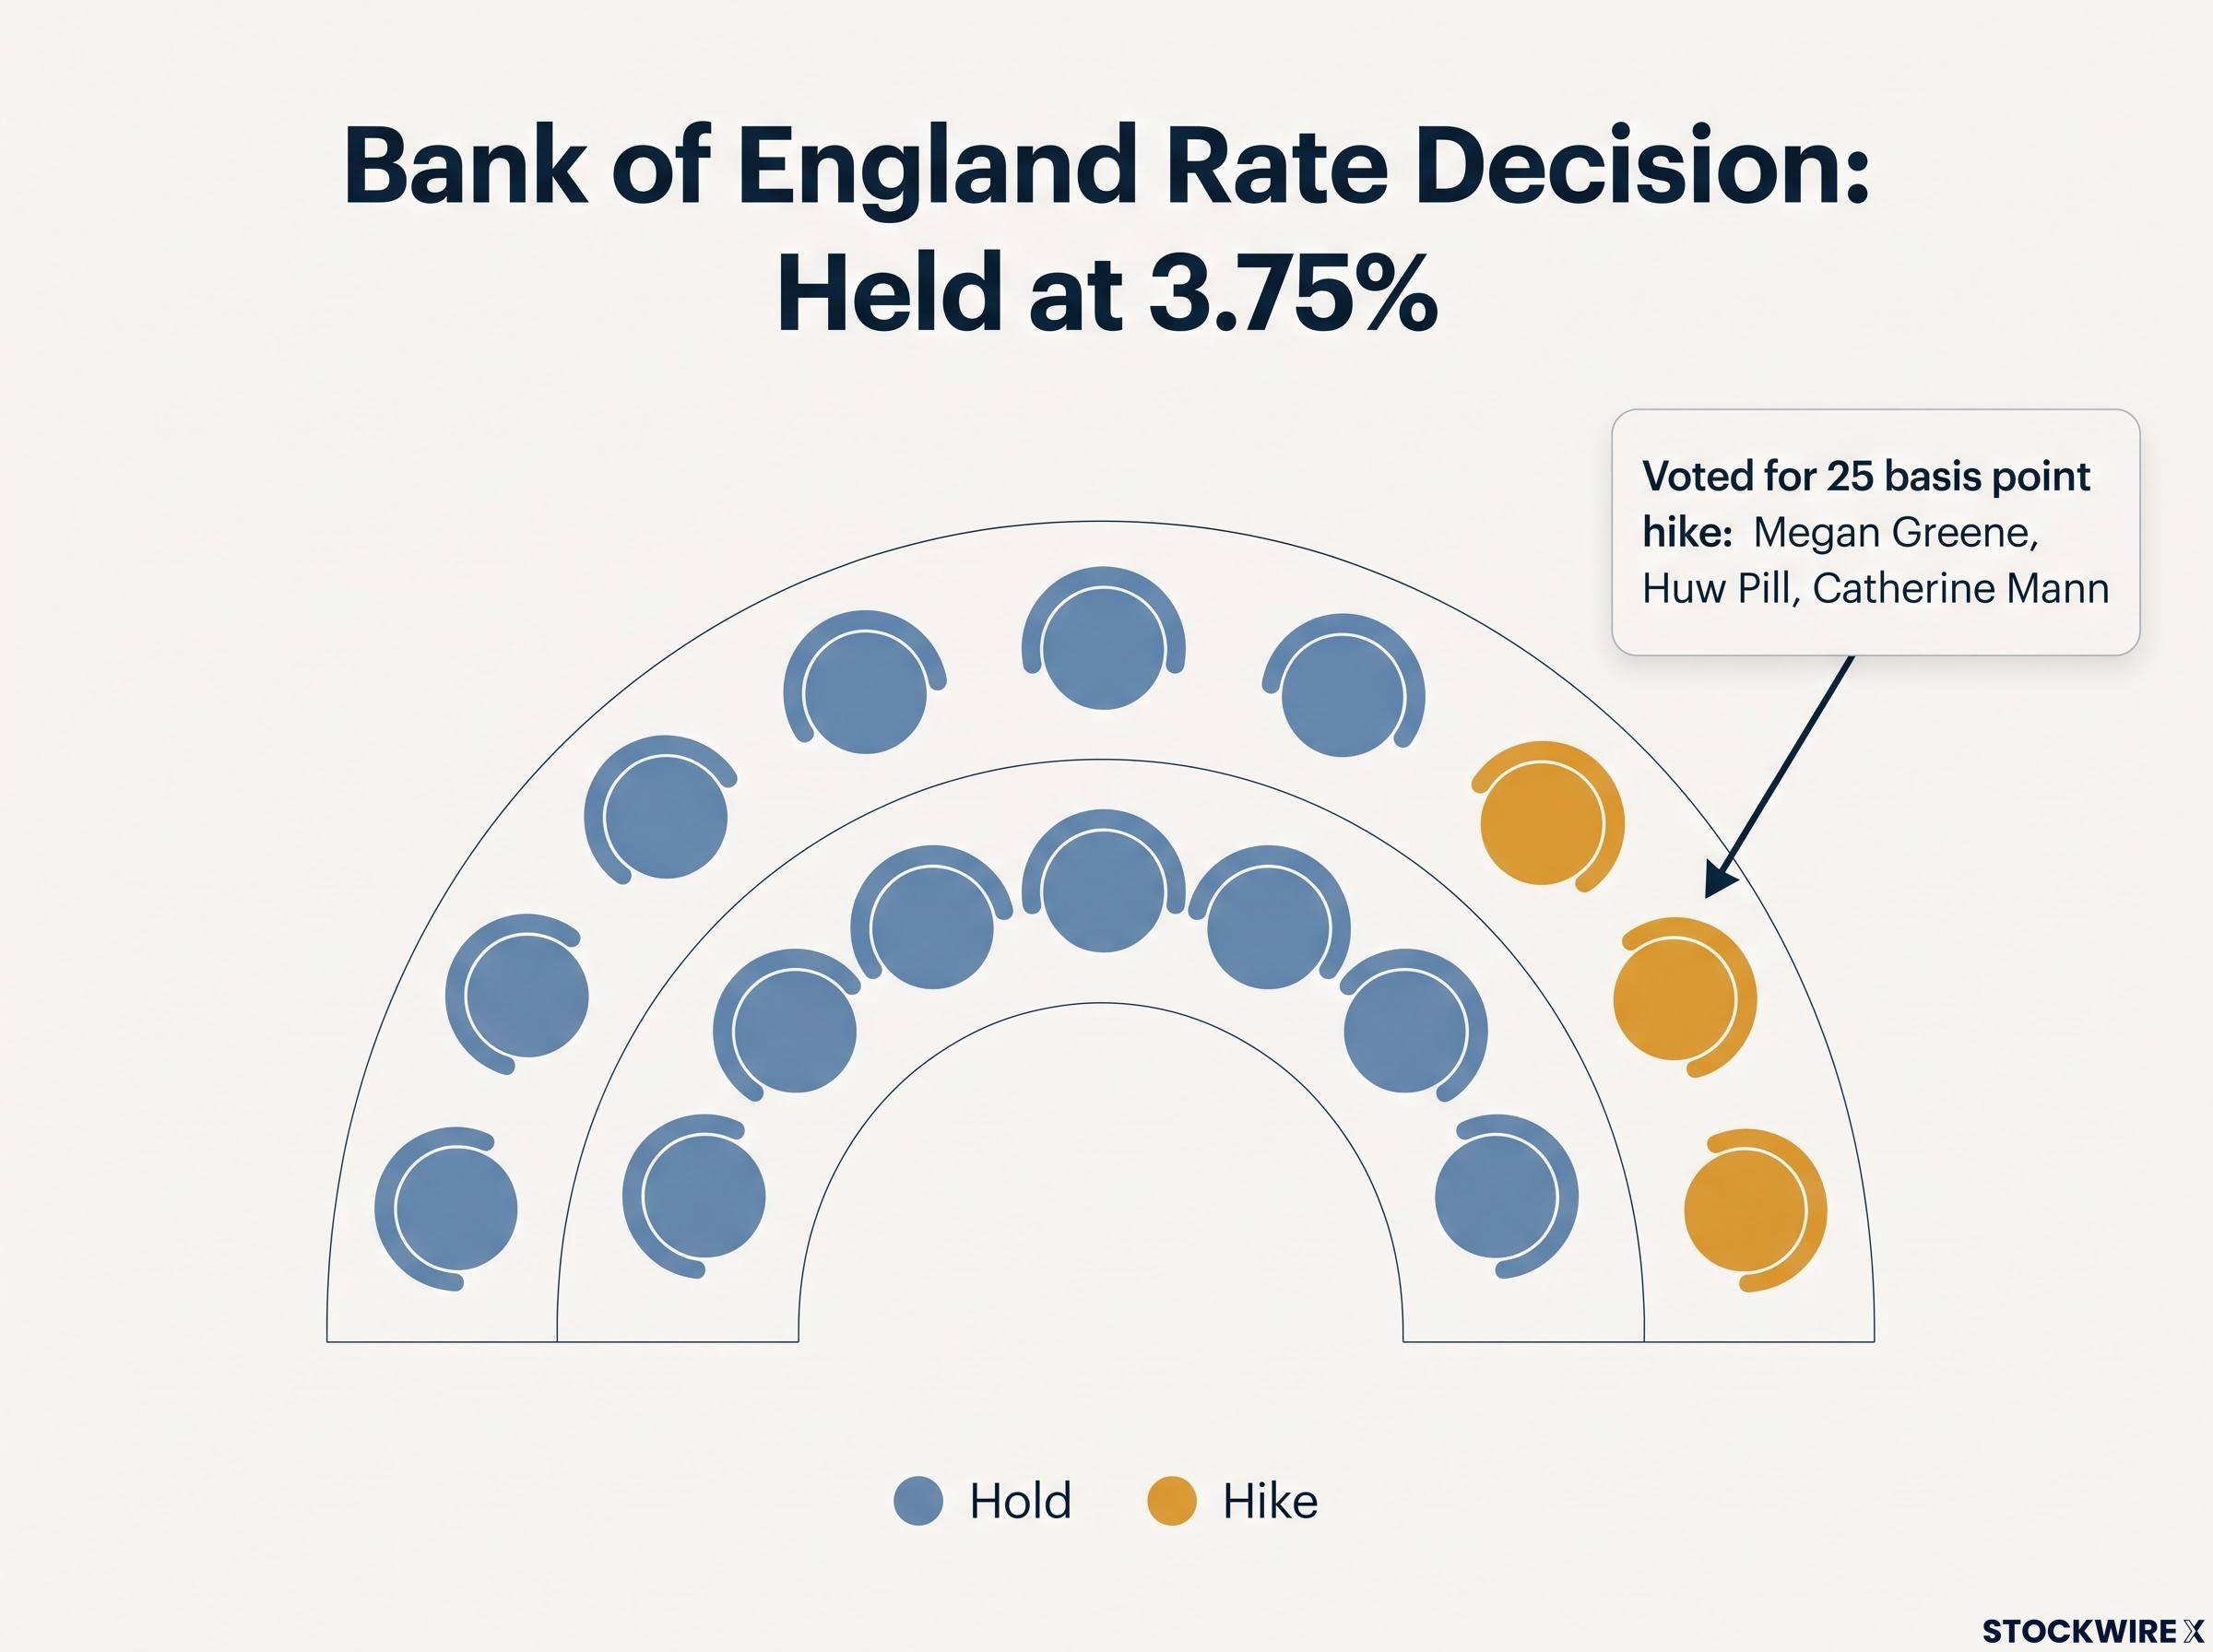
The Bank of England held its benchmark rate at 3.75% on 30 July 2026. The decision itself is unremarkable. The vote split underneath it is not.
The Monetary Policy Committee (MPC), the nine-member body that sets UK interest rates, reached its hold decision by a margin of six to three, with every dissenter pushing for a 25 basis point increase rather than a hold:
- Megan Greene (external member) voted for a hike
- Huw Pill (Chief Economist) voted for a hike
- Catherine Mann (external member) voted for a hike
(Some sources report a 7-2 split; the 6-3 figure is used here because it comes with named dissenters attributed to CNBC and Reuters reporting.)
The Bank of England MPC minutes for July 2026 confirm the 6-3 vote split, naming Greene, Pill, and Mann as the three dissenters who each sought a 25 basis point increase, providing the primary sourced record of the committee’s internal division on the inflation outlook.
Governor Andrew Bailey pushed back against market expectations of imminent tightening, seeking to dispel speculation that the Bank was moving toward a rate increase. But the direction of the dissent matters more than the Governor’s messaging.
A hold with three members voting for a hike is a hawkish signal, not a neutral one. The direction of dissent tells you more than the outcome.
For you as an investor, the BoE vote signals that UK rate cuts are not arriving soon, that inflation risk in the UK economy is real and contested within the committee, and that sterling and UK short-end yields may stay supported longer than consensus expects. When the Fed is on hold amid mixed signals and the BoE has active hawks on its committee, currency and rate markets in those two economies can move in genuinely different directions, opening cross-market opportunities that do not exist in synchronised policy cycles.
How institutional rotation reveals the real trade in global bonds
Abstract macro arguments about duration and yields become concrete when you see how the world’s largest fixed income managers are actually positioning. Schroders, with approximately US$1.1 trillion in assets under management according to Bloomberg, made its repositioning public on 30 July 2026: trimming allocations to long-dated US Treasuries while adding to shorter-dated government bonds across Australia, the UK, and the Eurozone.
The logic of the trade maps directly onto the macro environment described in the preceding sections.
| Bond Market | Schroders Direction | Rationale |
|---|---|---|
| US long-dated Treasuries | Reducing | Highest inflation uncertainty and term premium risk |
| Australian front-end sovereigns | Adding | More benign central bank path; relative value |
| UK front-end sovereigns | Adding | Yield pickup with BoE-anchored short end |
| Eurozone front-end sovereigns | Adding | Policy path more advanced toward easing |
This is a global relative value duration rotation. US long-end bonds carry the greatest inflation uncertainty and term premium risk. Front-end sovereigns in markets where central bank paths are more benign offer better risk-adjusted returns. When a manager of Schroders‘ scale makes this rotation publicly, it is both a signal about conviction and a market-moving force, particularly for the target sovereign markets.
What the Schroders rotation tells you is that the “higher for longer” concern in the US is already being acted on at institutional scale. Waiting for a cleaner signal before repositioning duration is a choice with a known cost. For Australian investors specifically, institutional inflows into Australian front-end government bonds can anchor local yields below the trajectory of US long-end yields, with downstream effects on ASX rate-sensitive sectors and the AUD.
The Australian bond market has expanded structurally over the past five years, with offshore investors consistently absorbing 40-50% of new issuance, a dynamic that amplifies the transmission of global rate moves into domestic yields and gives institutional rotations like the Schroders trade meaningful local price implications.
Understanding duration risk: the concept investors most need right now
Duration risk is the sensitivity of a bond’s price to changes in interest rates. It is the single most important concept for understanding why the yield movements described in this article matter for your portfolio, whether you hold bonds or equities.
The mechanism works in three steps:
- What duration measures: the weighted average time until a bond’s cash flows (coupon payments and principal) are received. A 30-year bond has far more duration than a 2-year bond because its cash flows extend much further into the future.
- How yield changes translate to price changes: when yields rise, bond prices fall. The longer the duration, the greater the price decline for the same yield increase. The US 30-year Treasury at 5.21% carries dramatically more price risk per basis point of yield change than the 10-year at 4.663%.
- How this extends from bonds to equities: the same mathematical logic applies through the discount rate. A company whose earnings are largely in the future is more sensitive to rate rises than a company generating strong cash flow today.
Duration in equities: the discount rate connects everything
A high-growth technology company with earnings expected five or ten years from now is, in financial terms, a long-duration asset. Its valuation depends heavily on the discount rate applied to those future earnings. When that rate rises because core PCE sits at 3.3% and 30-year yields push past 5%, the present value of those future earnings compresses.
This is why ASX rate-sensitive sectors, including REITs, infrastructure, and utilities, carry equity duration risk under this same mechanism. They underperformed in prior cycles when global yields were rising, and the current multi-week yield highs in the US matter for those sectors even if Australian domestic yields behave differently. Understanding duration risk tells you precisely why owning long-dated bonds or high-multiple growth equities in a sticky-inflation, rising-yield environment is not a neutral position.
What the three signals together mean for portfolio positioning now
The combination of soft-but-not-recessionary US growth, above-target inflation, rising long-end US yields, and a hawkish BoE hold defines an environment where duration discipline and geographic diversification matter more than directional macro bets.
The positioning implications break into three areas:
- Fixed income: shorten duration; consider front-end sovereigns across geographies where central bank paths differ from the Fed’s
- Equities: favour quality, cash-flow-generative companies and AI capex beneficiaries over long-duration growth names whose valuations depend on low discount rates
- Currency: central bank divergence creates active currency management opportunities across AUD, USD, GBP, and EUR that do not exist in synchronised policy cycles
| Asset Class | Headwind in This Environment | Positioning Consideration |
|---|---|---|
| Long-dated US Treasuries | Inflation persistence and rising term premium | Consider reducing or hedging |
| High-multiple growth equities | High discount rate sensitivity | Favour cash-flow-generative alternatives |
| ASX REITs and infrastructure | Elevated global yields compress valuations | Watch domestic yield trajectory |
| Inflation-linked bonds and real assets | Retain strategic value with core PCE above target | Maintain allocation |
| Short-duration front-end sovereigns | More benign risk-reward in Australia, UK, Eurozone | Consider adding exposure |
For ASX-focused investors, the transmission is specific. Institutional bond inflows could anchor Australian yields below the US long-end trajectory. The AUD is sensitive to those capital flows. ASX REITs and infrastructure names carry equity duration risk linked to global discount rate movements. And futures markets are already distinguishing between headline US GDP weakness and the underlying demand resilience that consumer spending at 3.2% confirms.
Investors who wait for a single clean macro signal, a decisive Fed cut, a UK rate reduction, a definitive US growth collapse, before repositioning may be waiting longer than the macro environment is willing to wait with them.
Investors wanting to translate the duration-shortening thesis into specific instrument choices will find our dedicated guide to bond portfolio management covers the 1-5 year curve positioning that BlackRock, PIMCO, and Vanguard all favour, with the trade-offs between short-duration ETFs, government bonds, and floating-rate notes laid out for different risk profiles.
This article is for informational purposes only and should not be considered financial advice. Investors should conduct their own research and consult with financial professionals before making investment decisions. Past performance does not guarantee future results. Financial projections are subject to market conditions and various risk factors.
The macro regime is not a riddle waiting for one more data point
The three signals of 30 July 2026 are not contradictory noise. They are a coherent description of a higher-rate, higher-volatility, inflation-persistent macro regime. US GDP at 1.5%, core PCE at 3.3%, a 30-year yield at 5.21%, and a BoE hold at 3.75% with three members voting for a hike: these are the coordinates of a world that is not in recession but is not returning to a low-rate equilibrium either.
The most useful analytical frame is not “will there be a soft landing or a recession?” The answer to that question is not actionable. The better question is: what does a world of moderately weak growth and above-target inflation require of a portfolio? That question has specific answers, and the Schroders rotation away from US long-end duration is one institutional-scale example of acting on them.
The three variables to watch from here are not additional GDP prints. They are:
- Core PCE trajectory: whether the annualised rate begins moving below 3% or stalls above it, which determines how long the Fed stays constrained
- Central bank dissent patterns: further hawkish dissent at the BoE or emerging dissent at the Fed would confirm the regime is deepening, not resolving
- Institutional flows into non-US sovereigns: continued rotation into Australian, UK, and Eurozone front-end bonds would signal that the duration trade identified here is becoming consensus, with price implications for latecomers
These are not passive items to monitor. They are the framework for turning ongoing data releases into portfolio-relevant signals rather than headline noise. The evidence is already clear enough to act on. Waiting for certainty in a macro environment that structurally resists certainty is itself a positioning decision, and not a neutral one.
—