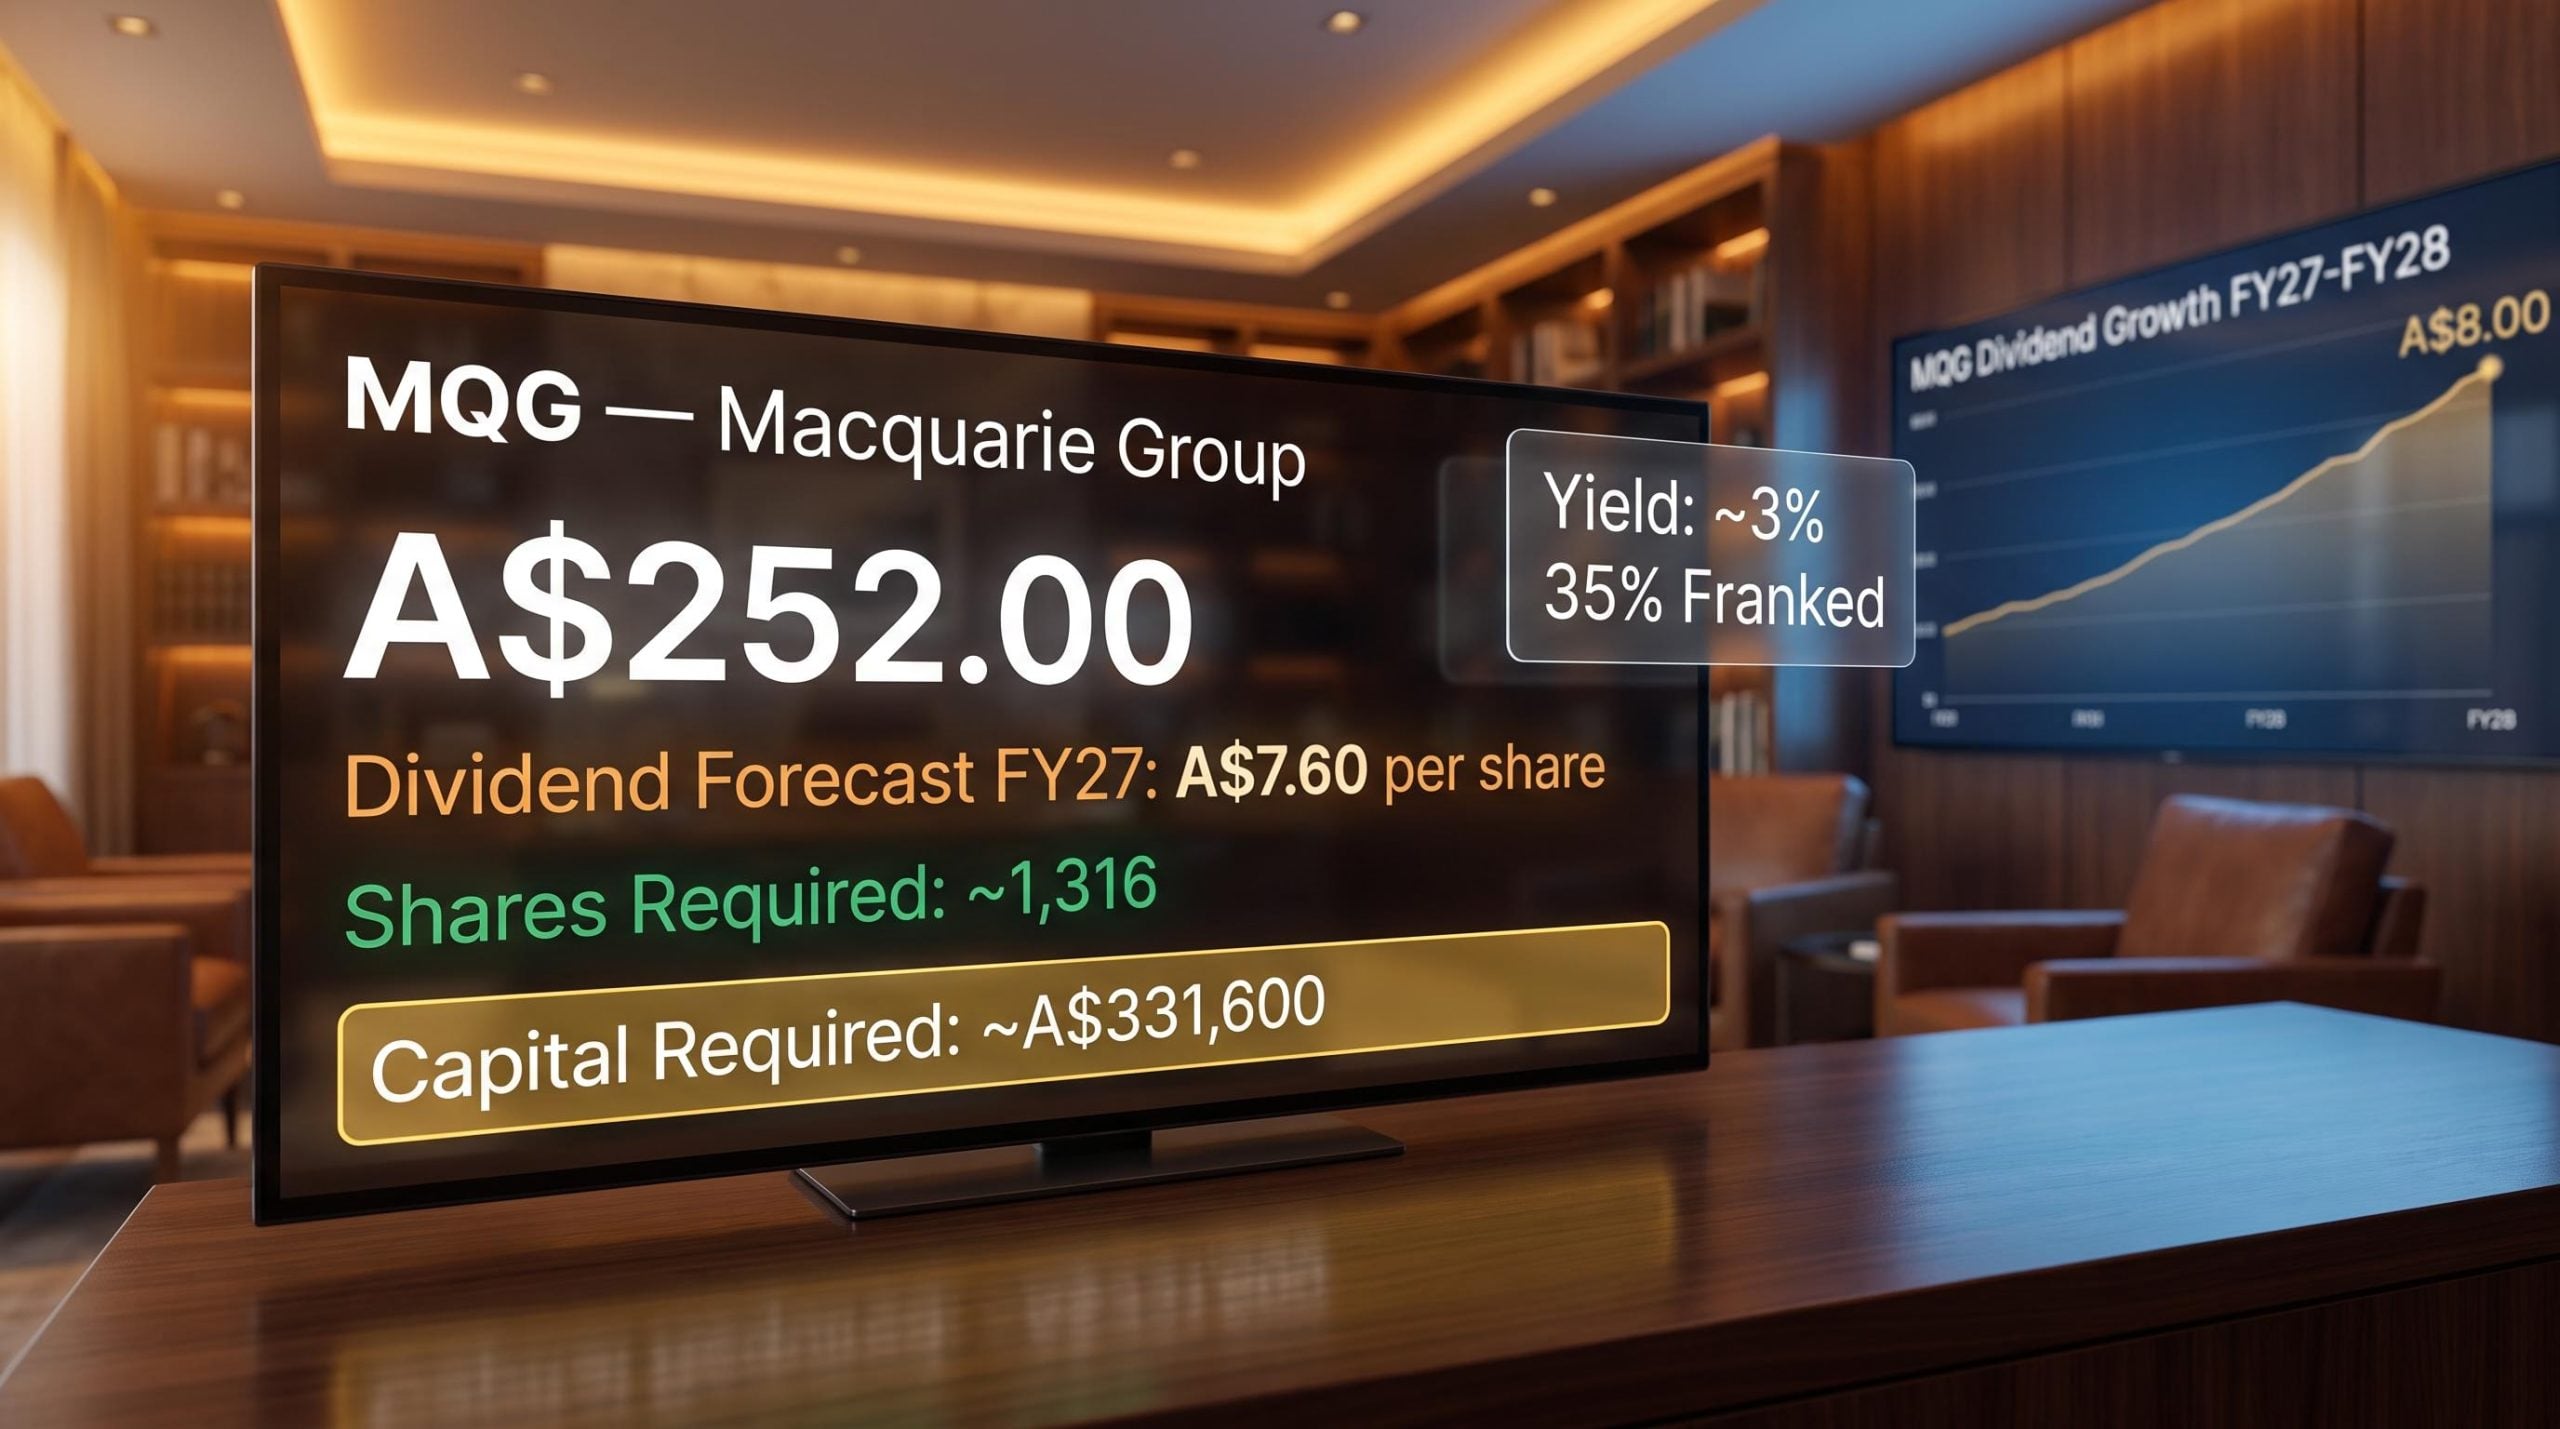
Roughly A$330,000 invested in a single ASX-listed company, held patiently, generating A$10,000 a year in dividends without selling a single share. That is the number. The company is Macquarie Group, and the arithmetic is straightforward once you know where to start.
What makes Macquarie an interesting choice for this calculation is also what makes it a non-obvious one. Its forward dividend yield sits around 3%, which is lower than most stocks investors typically associate with passive income on the ASX. That gap between expectation and reality is worth understanding, because the headline yield does not tell the full story.
Here is what you will walk away with: the specific share count and capital figure you need, and a reusable three-step calculation method you can apply to any dividend stock you are evaluating. Practical arithmetic, not theory.
The exact maths: how many Macquarie shares get you to A$10,000?
The formula is simple enough to fit on a napkin. To find the number of shares you need, divide your target annual income by the dividend per share:
Shares required = A$10,000 ÷ Dividend per share
Start with the FY27 CommSec forecast of A$7.60 per share. Plug it in, and you get A$10,000 ÷ A$7.60 = approximately 1,316 shares. That is your primary working figure.
But a single-point estimate only tells you part of the story. Dividend forecasts vary depending on the source and the time horizon, so you want a range. Here is how the share count shifts across five scenarios:
| Dividend per share (forecast) | Shares needed for A$10,000 |
|---|---|
| A$7.00 (trailing) | ~1,429 |
| A$7.10 (forward consensus) | ~1,408 |
| A$7.40 (FY27 analyst consensus) | ~1,351 |
| A$7.60 (FY27 CommSec) | ~1,316 |
| A$8.00 (FY28 CommSec) | ~1,250 |
Primary working figure: approximately 1,316 shares at the FY27 CommSec forecast of A$7.60 per share.
Your working range lands between roughly 1,250 and 1,430 shares. Notice how the share count narrows as the dividend per share grows. If Macquarie’s dividend reaches the FY28 forecast of A$8.00, you need 179 fewer shares than you would at the trailing A$7.00 figure. That is the compounding logic of dividend growth expressed in plain arithmetic: a growing dividend means you can reach the same income target with fewer shares over time.
When big ASX news breaks, our subscribers know first
Turning share count into dollars: what this position actually costs
Knowing you need approximately 1,316 shares is useful. Knowing what those shares cost at today’s prices is where the decision gets real.
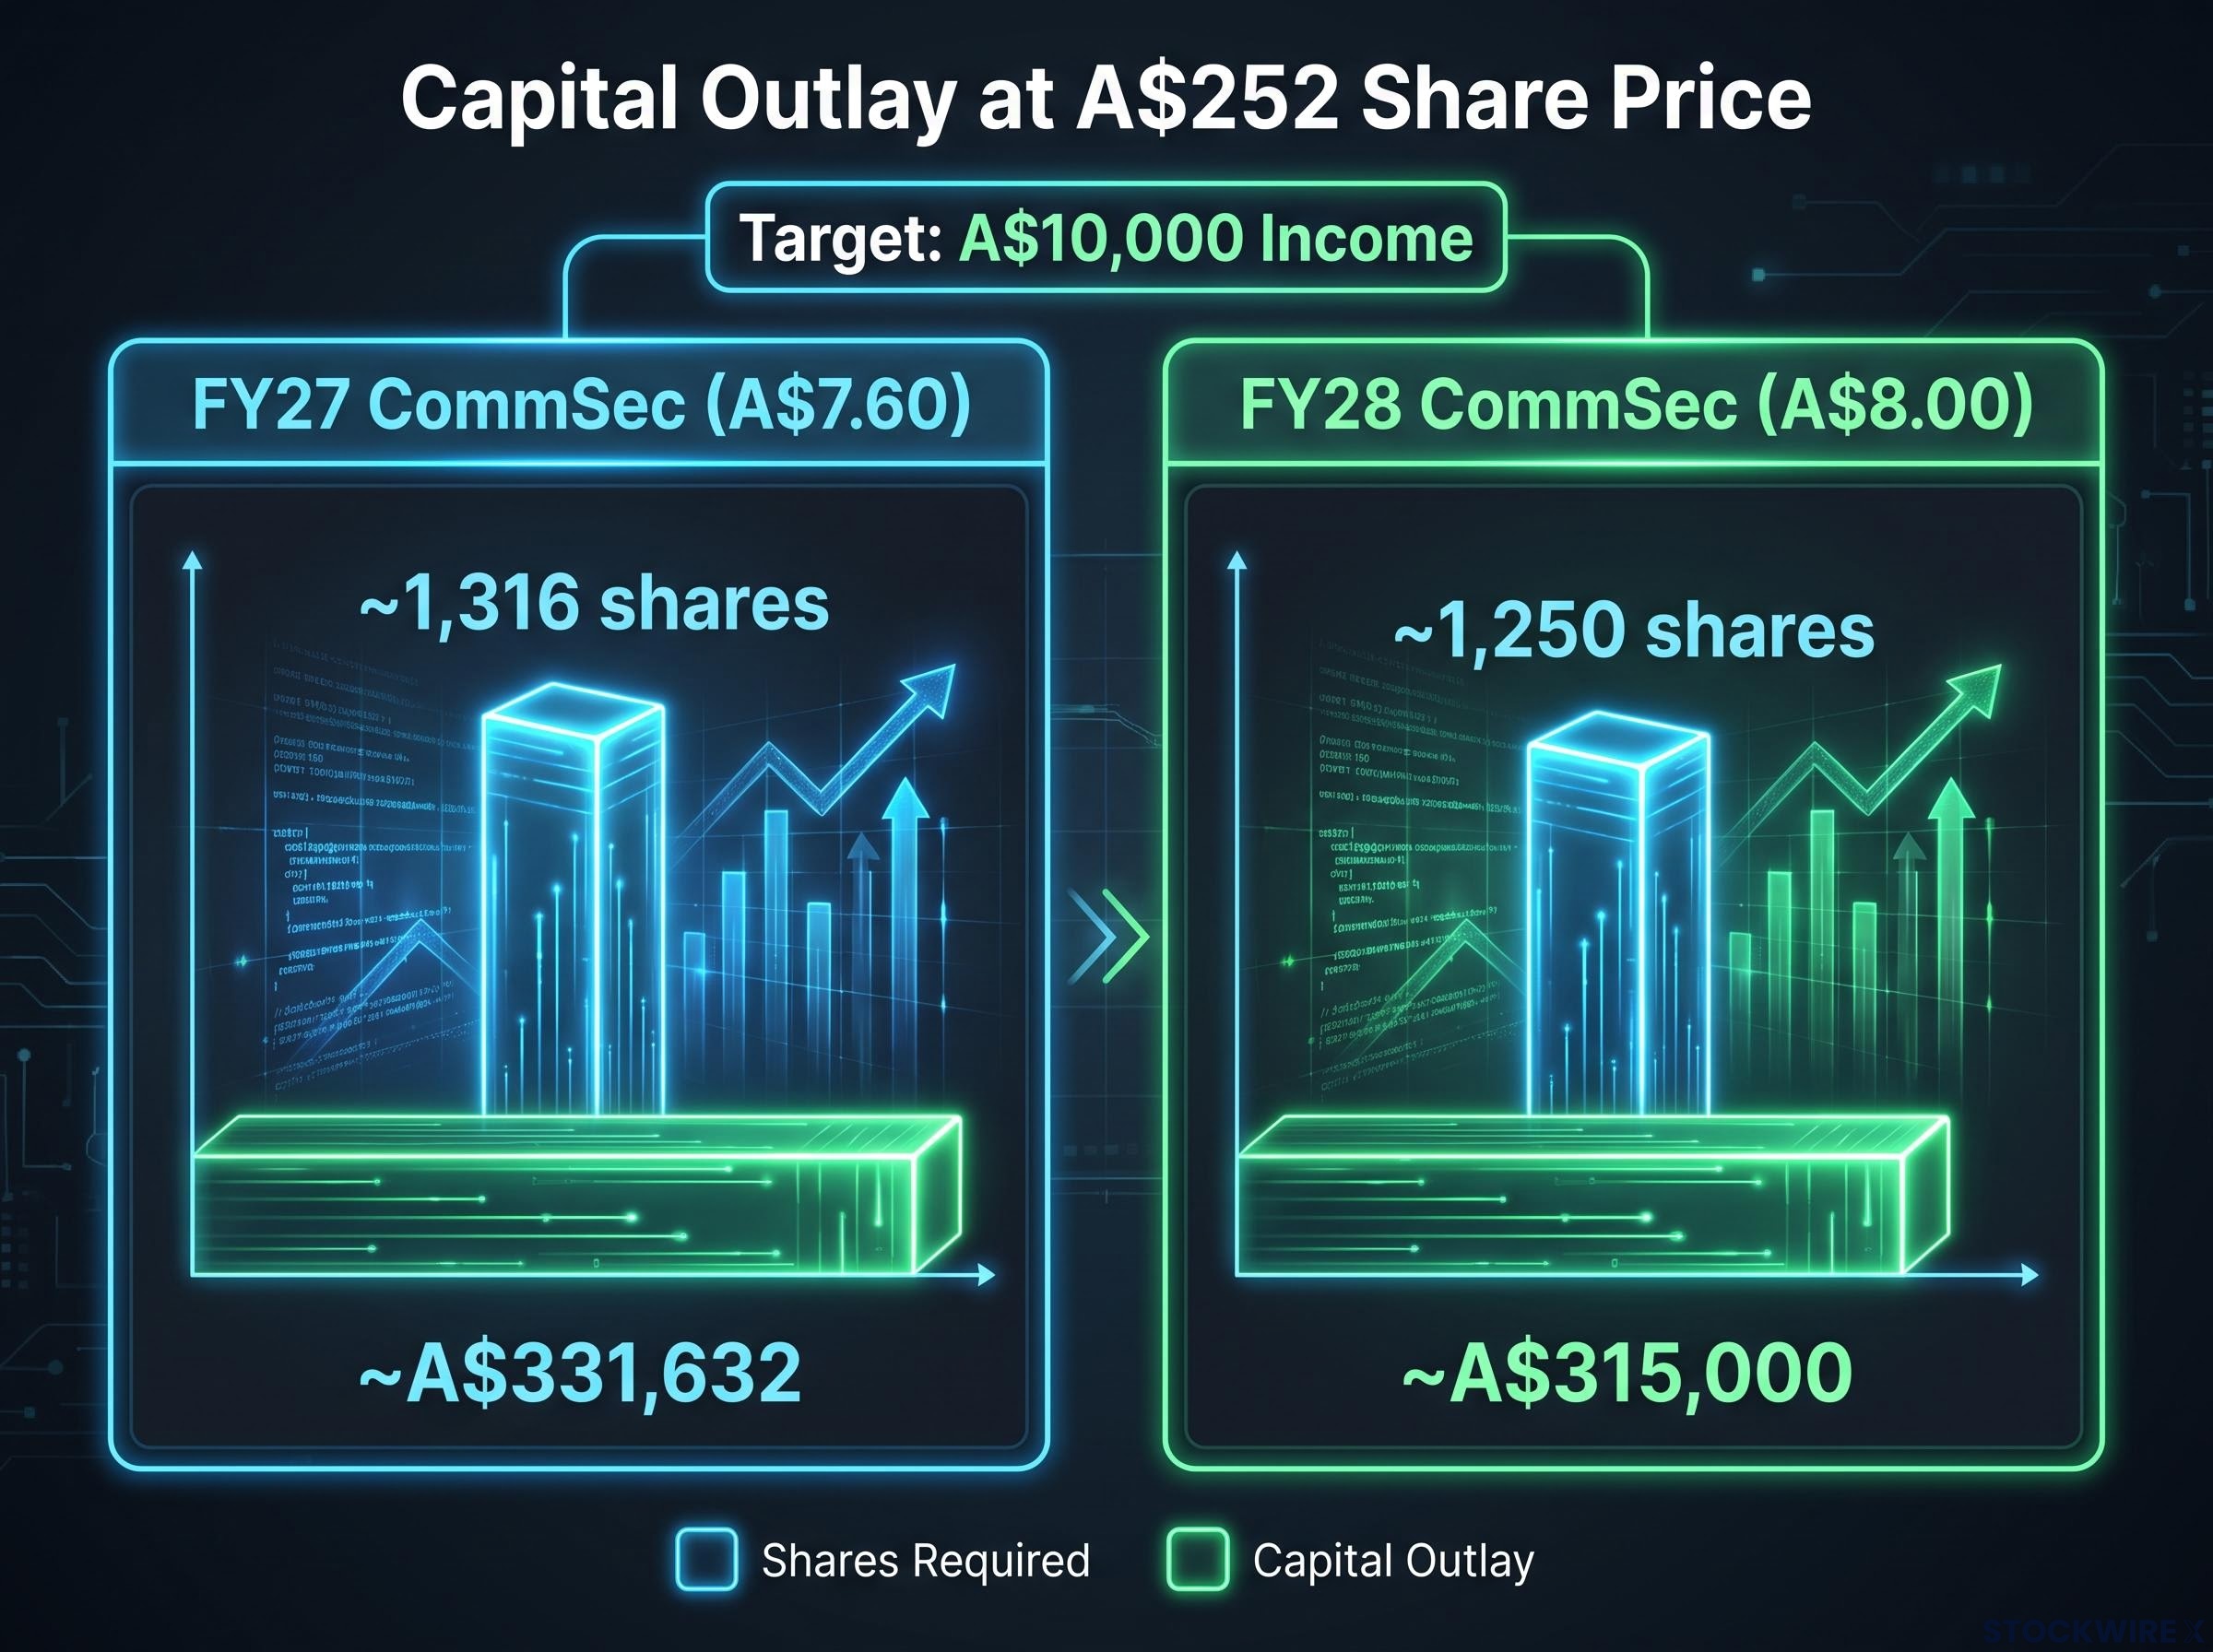
The second formula is equally straightforward: Capital required = Shares × Current share price. With Macquarie Group trading in the A$252 to A$258 range as of late July 2026, here is what each scenario looks like using A$252 as the reference price:
| Forecast | Shares required | Capital outlay at A$252 |
|---|---|---|
| Forward consensus (A$7.10) | ~1,408 | ~A$355,000 |
| FY27 analyst consensus (A$7.40) | ~1,351 | ~A$340,000 |
| FY27 CommSec (A$7.60) | ~1,316 | ~A$331,632 |
| FY28 CommSec (A$8.00) | ~1,250 | ~A$315,000 |
There is a quicker way to cross-check these numbers. Divide your income target by the forward yield percentage, and you arrive at the same capital figure from a different angle.
Yield-based shortcut: A$10,000 ÷ forward yield = capital required. At a 3% yield, that is A$333,333. At 2.8%, it is A$357,143.
The most realistic single-point estimate sits in the mid-A$300,000s. That is a significant concentrated position in one stock. Before you run any further calculations, it is worth asking whether that level of concentration is appropriate for your overall portfolio.
What franking credits add to the picture (and why Macquarie’s are partial)
If you have spent any time researching ASX income stocks, you have probably assumed most dividends come fully franked. For the major banks and many real estate investment trusts (REITs), that is often true. For Macquarie, it is not.
Macquarie Group’s dividends are 35% franked, and that distinction matters when you are comparing it against other income options.
Franking credits represent company tax already paid at the corporate level on the profits used to fund the dividend. As an Australian tax resident, you can use those credits to offset your personal income tax. If your marginal tax rate is lower than the corporate rate, the excess credits can come back to you as a tax refund. A fully franked dividend passes on the full corporate tax credit; a 35% franked dividend passes on roughly a third of it.
The most recent data confirms this pattern. The FY26 interim dividend was A$2.80 per share at 35% franking, and the FY26 final dividend was A$4.20 per share, also at 35% franking. The total FY26 dividend of A$7.00 per share was consistently partially franked throughout.
The A$10,000 income target in this article refers to pre-tax cash dividends only. The grossed-up value, which includes the benefit of franking credits, will be modestly higher depending on your personal tax position.
How to compare yields fairly across stocks with different franking levels
The grossed-up yield concept gives you the tool you need. To find the pre-tax equivalent yield, divide the cash dividend by one minus the corporate tax rate applicable to the franked portion. This produces a figure that lets you compare a partially franked stock like Macquarie against a fully franked alternative on equal footing. Your personal tax circumstances determine the actual benefit, so treat this as a comparison tool, not a promise of a specific return.
The grossed-up yield calculation for a 35% franked dividend applies the standard formula to only the franked portion of the payment, producing a smaller uplift than the same formula applied to a fully franked dividend of equivalent cash value.
Three practical implications of 35% franking for you:
- After-tax cash: You receive a real but smaller tax benefit compared to fully franked dividends, and the difference widens the higher your marginal tax rate.
- Comparison methodology: Headline cash yields are not apples-to-apples when franking levels differ. Always compare grossed-up yields when evaluating income alternatives.
- Refund potential: If your marginal tax rate falls below the corporate rate, you may still receive a franking credit refund, though it will be smaller than from a fully franked dividend.
The yield versus growth trade-off every Macquarie investor faces
Macquarie’s forward yield of approximately 2.8-3.5% is materially lower than what you can get from the major banks, REITs, or infrastructure funds. That is not a flaw to apologise for. It is a signal about what kind of asset Macquarie actually is.
The yield sits lower primarily because Macquarie’s share price has appreciated strongly over time, compressing the yield relative to the dividend paid. A stock whose price doubles while its dividend grows 50% will show a lower yield, even though the investor who held it is earning significantly more in absolute dollar terms than when they bought in.
Historical dividend growth rate: approximately 5-9% per year over Macquarie’s multi-year record.
That growth rate is the partial offset to the lower starting yield. The FY27 CommSec forecast of A$7.60 growing to an FY28 forecast of A$8.00 illustrates the trajectory in near-term numbers. And Macquarie’s payout ratio policy of 50-70% of net earnings tells you there is headroom for further increases if profits grow, because the company is retaining a meaningful share of earnings to reinvest in the business.
Here is the trade-off in plain terms:
- Macquarie’s profile: Lower starting yield, demonstrated dividend growth potential, quality compounder characteristics, capital appreciation track record.
- High-yield alternative profile: Higher starting cash income, potentially more limited dividend growth, sector-specific risks (interest rate sensitivity for banks, property cycle exposure for REITs).
Whether Macquarie’s lower yield makes sense for you depends on your time horizon and your priority. If you need to maximise cash income right now, higher-yielding sectors may serve you better. If you are building a position whose dividend income grows meaningfully over the next decade, Macquarie’s growth profile becomes the more relevant number.
The MQG income versus growth debate has sharpened in 2026 as the share price surge compressed the trailing yield below 3%, with the 35% franking disadvantage relative to the major banks becoming a more prominent consideration for investors comparing pure income alternatives.
A reusable framework for calculating passive income from any ASX dividend stock
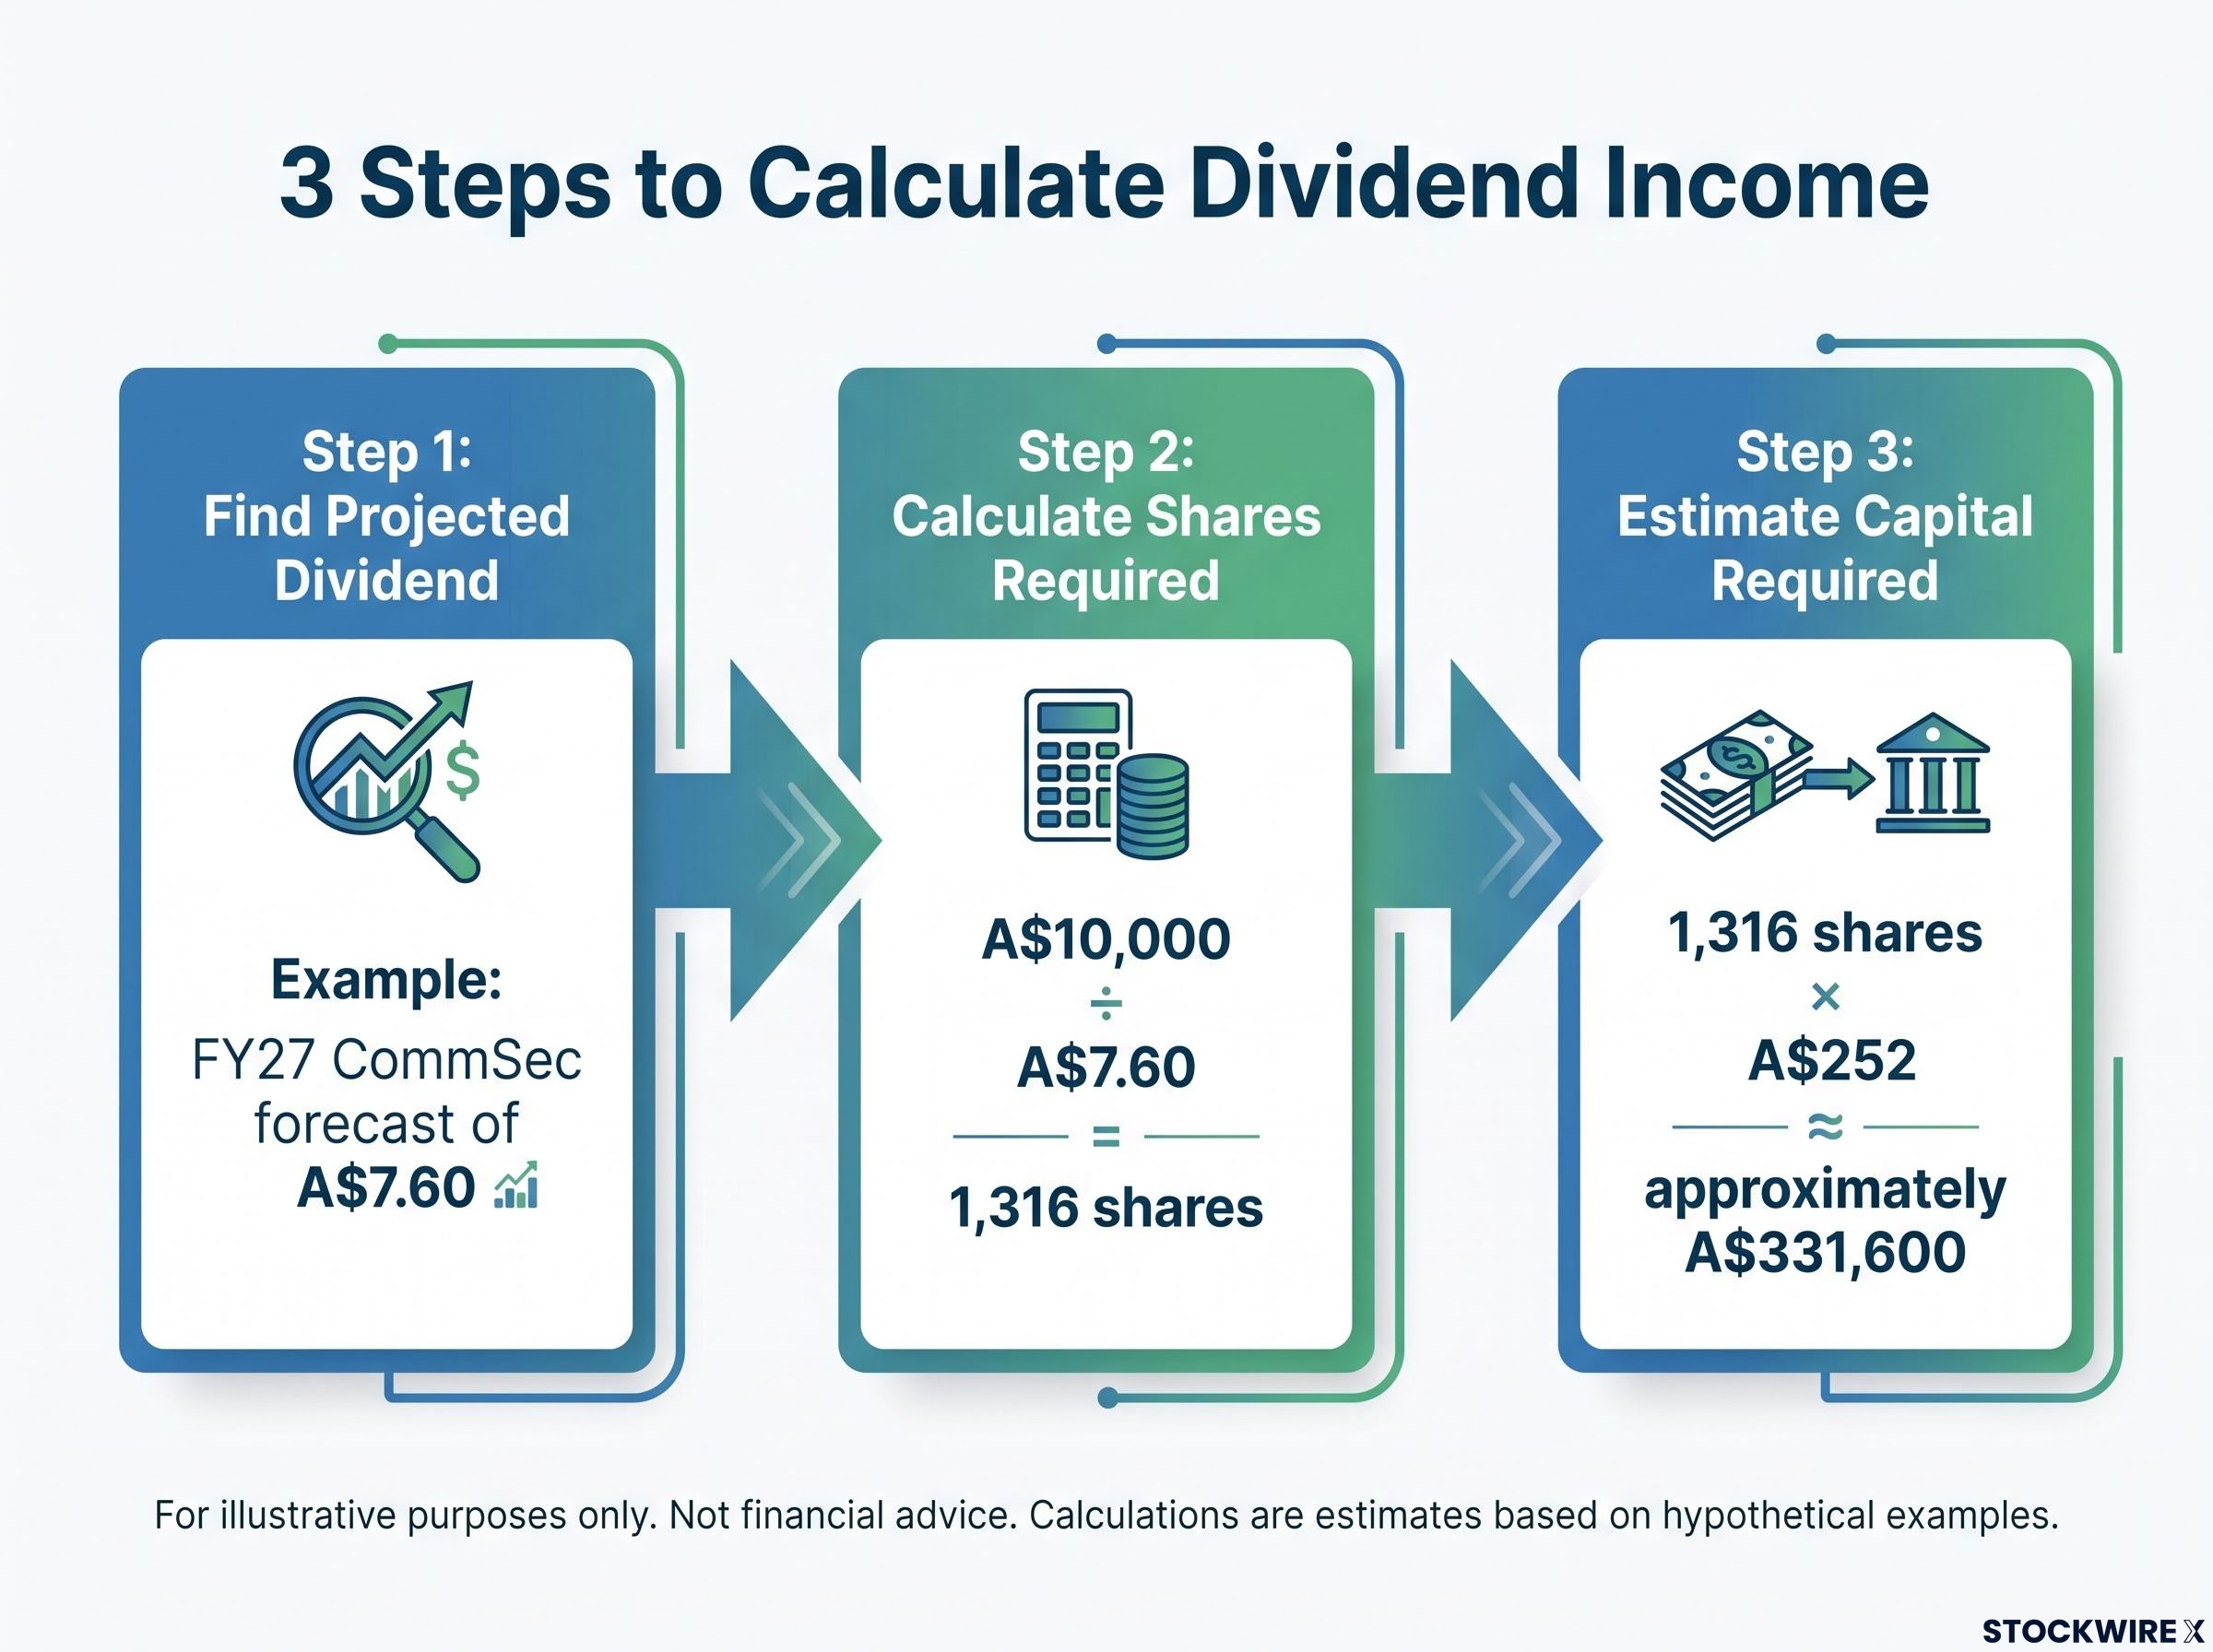
The method you have just seen applied to Macquarie works for any dividend-paying ASX share. Here are the three core steps:
- Find the projected annual dividend per share. Use broker platforms such as CommSec, Nabtrade, or Westpac Online to locate consensus forward dividend estimates for the next 12 months or a specific financial year. The FY27 CommSec forecast of A$7.60 was the input used in this article.
- Calculate shares required. Divide your target income by the dividend per share. A$10,000 ÷ A$7.60 = 1,316 shares.
- Estimate capital required. Multiply shares by the current share price. 1,316 × A$252 = approximately A$331,600.
That gives you the base answer. The four refinements below are what separate a reliable estimate from a rough guess.
Four refinements that make the calculation more reliable
- Adjust for franking credits. Add the grossed-up value to compare fairly across stocks with different franking levels. A 35% franked dividend and a fully franked dividend are not equivalent at the same headline yield.
- Assess dividend growth prospects. Review earnings trends and payout ratio headroom. A growing dividend means you need fewer shares over time to maintain the same income, which is the dynamic you saw in Macquarie’s FY27-to-FY28 progression.
- Compare against alternatives. Benchmark the yield, risk, and growth profile against other income options, including bank shares, REITs, ETFs, and infrastructure stocks. No single stock should win by default.
- Check payout ratio sustainability. A payout ratio of 50-70% (as with Macquarie) is generally considered sustainable. Payout ratios above 90% warrant additional scrutiny, because they leave limited room for dividend growth and may signal vulnerability to a cut if earnings decline.
The payout ratio check is the most underused step in this framework. Skip it, and you risk building an income calculation on dividends that may not survive the next earnings cycle.
What this means if Macquarie is part of your income portfolio
Committing A$315,000 to A$360,000 to a single stock is a material portfolio decision. Macquarie’s earnings are driven by financial markets, commodities, and global infrastructure deal flow, which makes them more cyclical than bank net interest margin income. That cyclicality means dividends are less predictable year to year, even if the long-term growth trend has been strong.
The capital requirements for dividend income scale significantly once you move from a single income target like A$10,000 to the full retirement income benchmarks, with ASFA comfortable retirement figures implying A$1.3 million to A$1.9 million depending on how franking credits are factored into the yield calculation.
The alternative approach is to spread your A$10,000 income target across multiple stocks or funds. Diversifying across sectors smooths dividend volatility throughout the year and reduces the impact of any single company cutting or pausing its payout.
Here is a quick self-assessment:
- Macquarie fits well if you value a blend of income and long-term capital growth, can tolerate some dividend variability, and are using it as one component within a diversified income portfolio.
- Macquarie fits less well if your primary goal is maximising near-term cash income, you need predictable quarterly payments, or the position would represent a disproportionate share of your total portfolio.
- The middle ground: Holding Macquarie alongside higher-yielding, fully franked stocks lets you capture the growth characteristics while higher-yielding positions anchor your immediate cash flow needs.
Macquarie’s 35% franking still delivers a real tax benefit. It is simply less powerful than fully franked alternatives, and your portfolio construction should reflect that.
Making the numbers work for your income target
Generating A$10,000 a year from Macquarie Group dividends requires approximately 1,316 shares and roughly A$330,000 in capital at current prices and FY27 forecasts. If the dividend reaches the FY28 forecast of A$8.00, that share count drops to approximately 1,250, and the capital requirement eases accordingly. That narrowing is the compounding logic of dividend growth at work.
The three-step method you have seen here, find the dividend, calculate the shares, estimate the capital, applies to any ASX dividend stock. The four refinements (franking, growth, alternatives, and payout ratio sustainability) are what turn a rough estimate into a number you can plan around.
Pick one other ASX stock you are holding or considering and run the same calculation this week. The exercise takes five minutes, and it will tell you whether your income expectations match reality. This article is for informational purposes only and should not be considered financial advice; always conduct your own research and consult a financial professional before making investment decisions.
For investors weighing whether to hold Macquarie directly or access similar exposures through a managed vehicle, our dedicated guide to income investing structures covers the specific trade-offs between direct shares, LICs, and dividend ETFs, including how each structure handles franking credit pass-through.