
The two sectors that dominate the ASX by market capitalisation, banks and miners, account for a disproportionate share of the index’s weight. They also account for a disproportionate share of income investor complacency. Morningstar analyst projections for the ten largest ASX companies indicate that banking sector dividends are growing at a pace that fails to keep up with inflation over the next three years, while payouts from miners are expected to fall.
That creates a problem for anyone who built an income portfolio around the top of the index and assumed the work was done. With FY26 recently concluded and investors reassessing portfolio income through FY28, the gap between where most passive capital sits and where dividend growth is actually forecast to appear has widened into something worth examining carefully.
Here is the analytical map: which sectors are projected to deliver real dividend growth, which are likely to disappoint, and how to begin rethinking income allocation using a framework that separates headline yield from what your dividends will actually buy in three years’ time.
The structural problem with relying on the big four banks
The assumption is reasonable on its face. Australia’s four largest banks have paid dividends through recessions, regulatory overhauls, and a global pandemic. For most income investors, they are the portfolio’s ballast.
The problem is that ballast does not grow. Meaningful dividend growth requires earnings growth, and bank earnings growth is constrained by several structural headwinds that are not resolving in this cycle:
- Net interest margins are normalising as competition for mortgage lending intensifies
- Tax system changes pushed home loan applications down 14% in June, creating a significant drag on residential lending volumes
- Regulatory capital requirements limit aggressive payout expansion
- The mature domestic franchise offers limited avenues for earnings acceleration
High payout ratios can sustain dividends for a time, but they function as a buffer that depletes rather than a growth mechanism. An expert sector view for 2026 recommends an underweight to the major banks heading into the next financial year, and the reasoning centres on the dividend, not just the share price.
What the projections actually show
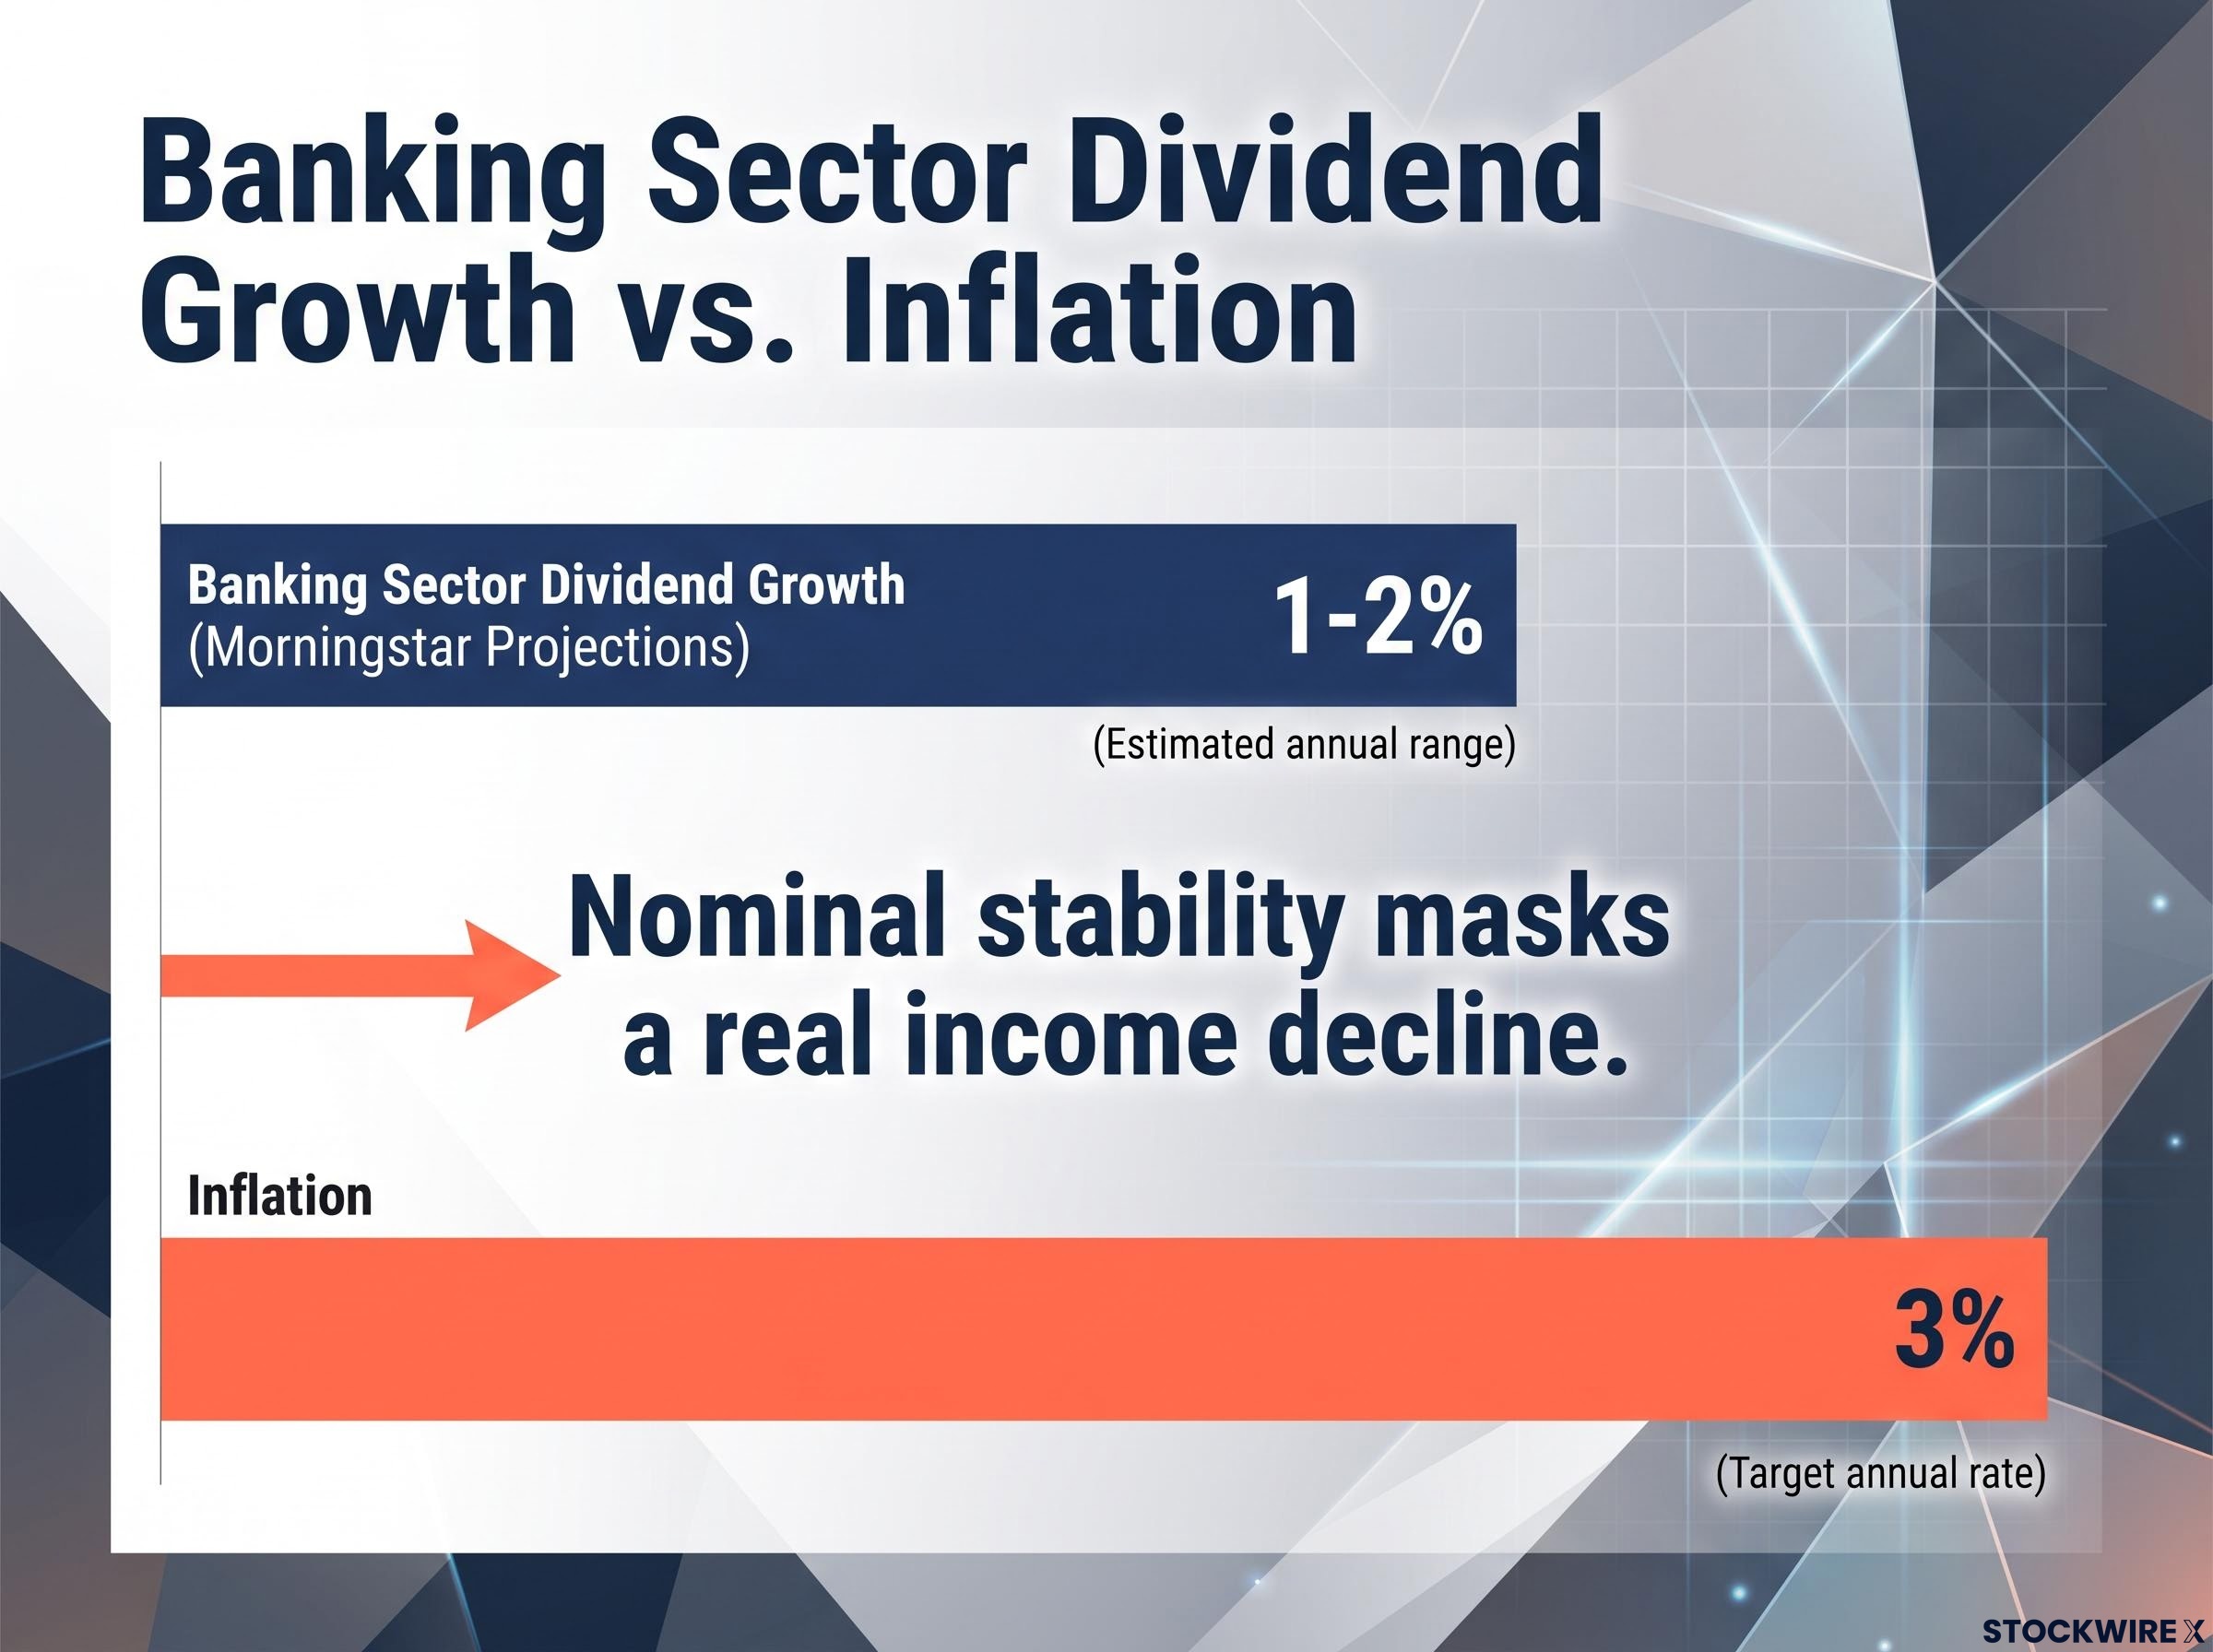
Morningstar analyst projections for the banking sector show dividend growth of roughly 1-2% nominally over each of the next three years. With inflation running near 3%, that nominal stability masks a real income decline.
A bank dividend that grows at 1-2% while the cost of living rises at 3% is a pay cut in purchasing power terms. Investors anchored to the nominal dollar figure on their distribution statement are likely underestimating how much their income stream is quietly losing in real terms. The risk here is not a dividend cut. It is slow erosion that never triggers an alarm.
ABS Consumer Price Index data for the twelve months to May 2026 recorded headline CPI growth of 4.0% and trimmed mean inflation of 3.6%, figures that place the article’s 3% inflation benchmark on the conservative side of the current pricing environment.
When big ASX news breaks, our subscribers know first
Why mining dividends are cyclical, not structural income
Mining valuations have climbed sharply, with copper enthusiasm among investors pushing share prices higher even as the underlying earnings picture deteriorates. That decoupling between share price momentum and dividend trajectory is where income investors get caught.
The mechanism is straightforward. Shifting production capacity toward copper and other metals requires enormous capital expenditure, leaving a much smaller pool of free cash available to fund shareholder distributions. Morningstar forecasts project declining dividends from mining companies within the ten largest ASX stocks over the following three years.
BHP is forecast to deliver an average yield of approximately 5% over the next two years, compared with roughly 3.3% for the broader ASX 200. Growth, however, is expected to steady rather than accelerate.
The factors constraining free cash flow are specific:
- Capital expenditure requirements for production transition and replacement
- Commodity price sensitivity, particularly to iron ore and copper cycles
- Earnings exposure to Chinese steel demand and construction sector conditions
Buying a miner because its share price is rising is a capital growth thesis, not an income thesis. Confusing the two is how dividend expectations get built on foundations that cannot support them. A rising share price and a shrinking dividend cheque can coexist for years, and the current capex cycle suggests that is precisely what lies ahead.
The mining capital expenditure cycle driving dividend compression is the same force attracting institutional capital into mining ETFs: assets under management surged 136% to $87.4 billion in twelve months as investors positioned for a commodity supercycle, even as the capex commitments funding that thesis were simultaneously reducing the free cash flow available for shareholder distributions.
What the ASX index structure hides from income investors
Market-capitalisation weighting is the architecture behind the ASX 200. Companies with the largest market values receive the highest index weightings, which means banks and miners dominate the index not because they are the best income investments but because they are the biggest companies.
This creates a structural concentration that most passive investors do not examine closely. The ASX 200 broad dividend yield sits at approximately 3.3%, but that figure aggregates returns in a way that masks significant divergence between the largest constituents and the rest.
| Company / Sector | FY26 Yield Estimate | FY27 Yield Estimate | Gross Yield Notes |
|---|---|---|---|
| BHP | ~5% | ~5% | vs ~3.3% ASX 200 average |
| ASX 200 Broad | ~3.3% | Benchmark reference | Cap-weighted aggregate |
The index can rise while the majority of its constituent companies underperform on dividend growth. That is not a bug; it is how cap-weighting works.
Why index-level dividend data misleads
A cap-weighted index aggregates returns in a way that allows a small number of heavily weighted names to pull the average in their direction. An investor checking their ASX 200 fund’s yield and assuming it reflects the full Australian income landscape is reading a number shaped overwhelmingly by the top ten holdings.
Within Morningstar’s Australian analyst coverage, 124 domestic companies have maintained uninterrupted dividend payments across the past decade. That universe tells a materially different income story than the top-ten framing alone. An investor holding a passive ASX 200 product is not holding a diversified income strategy; they are holding a concentrated bet on the dividend trajectories of a small cluster of large-cap banks and miners, and the index label obscures that concentration.
The structural conditions behind ASX concentration traps extend beyond passive indexing: the ASX’s unique architecture, with resources at roughly 25% of market capitalisation and the big four banks dominating financials, creates behavioural conditions that make over-concentration feel rational even when the income data points in the opposite direction.
Where the dividend growth is actually forecast to come from
Three sectors stand out in Morningstar forward projections for FY26-FY28 dividend growth:
- Utilities: Attractive current yields plus forecast growth into FY27-FY28, with valuation pressure easing as bond yields stabilise
- Consumer staples: Moderate yield underpinned by stable demand and pricing power, with credible growth trajectories
- A-REITs (Australian Real Estate Investment Trusts): Above-market yields following the bond-yield-driven sell-off, with analyst-forecast dividend growth as conditions normalise
Selected financial services names outside the big four, including asset managers, insurers, and specialty lenders, also screen well for income without the specific earnings headwinds facing the major banks.
| Company | FY26 Yield | FY27 Yield | Grossed-Up Yield (approx) | Franking Status |
|---|---|---|---|---|
| Woolworths | ~3.2% | ~3.6% | ~4.6% / ~5.1% | 100% franked |
| Woodside | ~5.5% | ~5.0% | Meaningful gross-up | Franked (not always 100%) |
| ASX 200 Broad | ~3.3% | Benchmark | Varies | Benchmark reference |
Woolworths illustrates the point well. A 3.2% yield in FY26 growing to 3.6% in FY27, fully franked, grosses up to approximately 4.6% and 5.1% respectively according to Morningstar estimates. Woodside offers a higher starting yield of approximately 5.5% in FY26, with meaningful franking gross-up, though franking levels do not always reach the full 100% rate applicable to Woolworths.
A franked yield of 5.1% from a consumer staple growing its dividend is a materially different income proposition than a nominally higher but flat yield from a bank. Investors who compare only the headline number before franking will systematically underrate these alternatives.
The franking credit gross-up transforms a 3.2% cash yield into something closer to 4.6% for eligible investors, a structural advantage that is systematically understated when income comparisons stop at the headline dividend number.
The arithmetic of dividend growth versus static yield
Morningstar identifies two distinct categories of income holdings:
- High current yield, low growth: Positions paying 5-6% today with minimal dividend growth forecast
- Lower current yield, higher growth: Positions paying 3.5-4% today with 5-6% annual dividend growth projected
The intuition says the higher yield wins. The arithmetic over three years tells a different story.
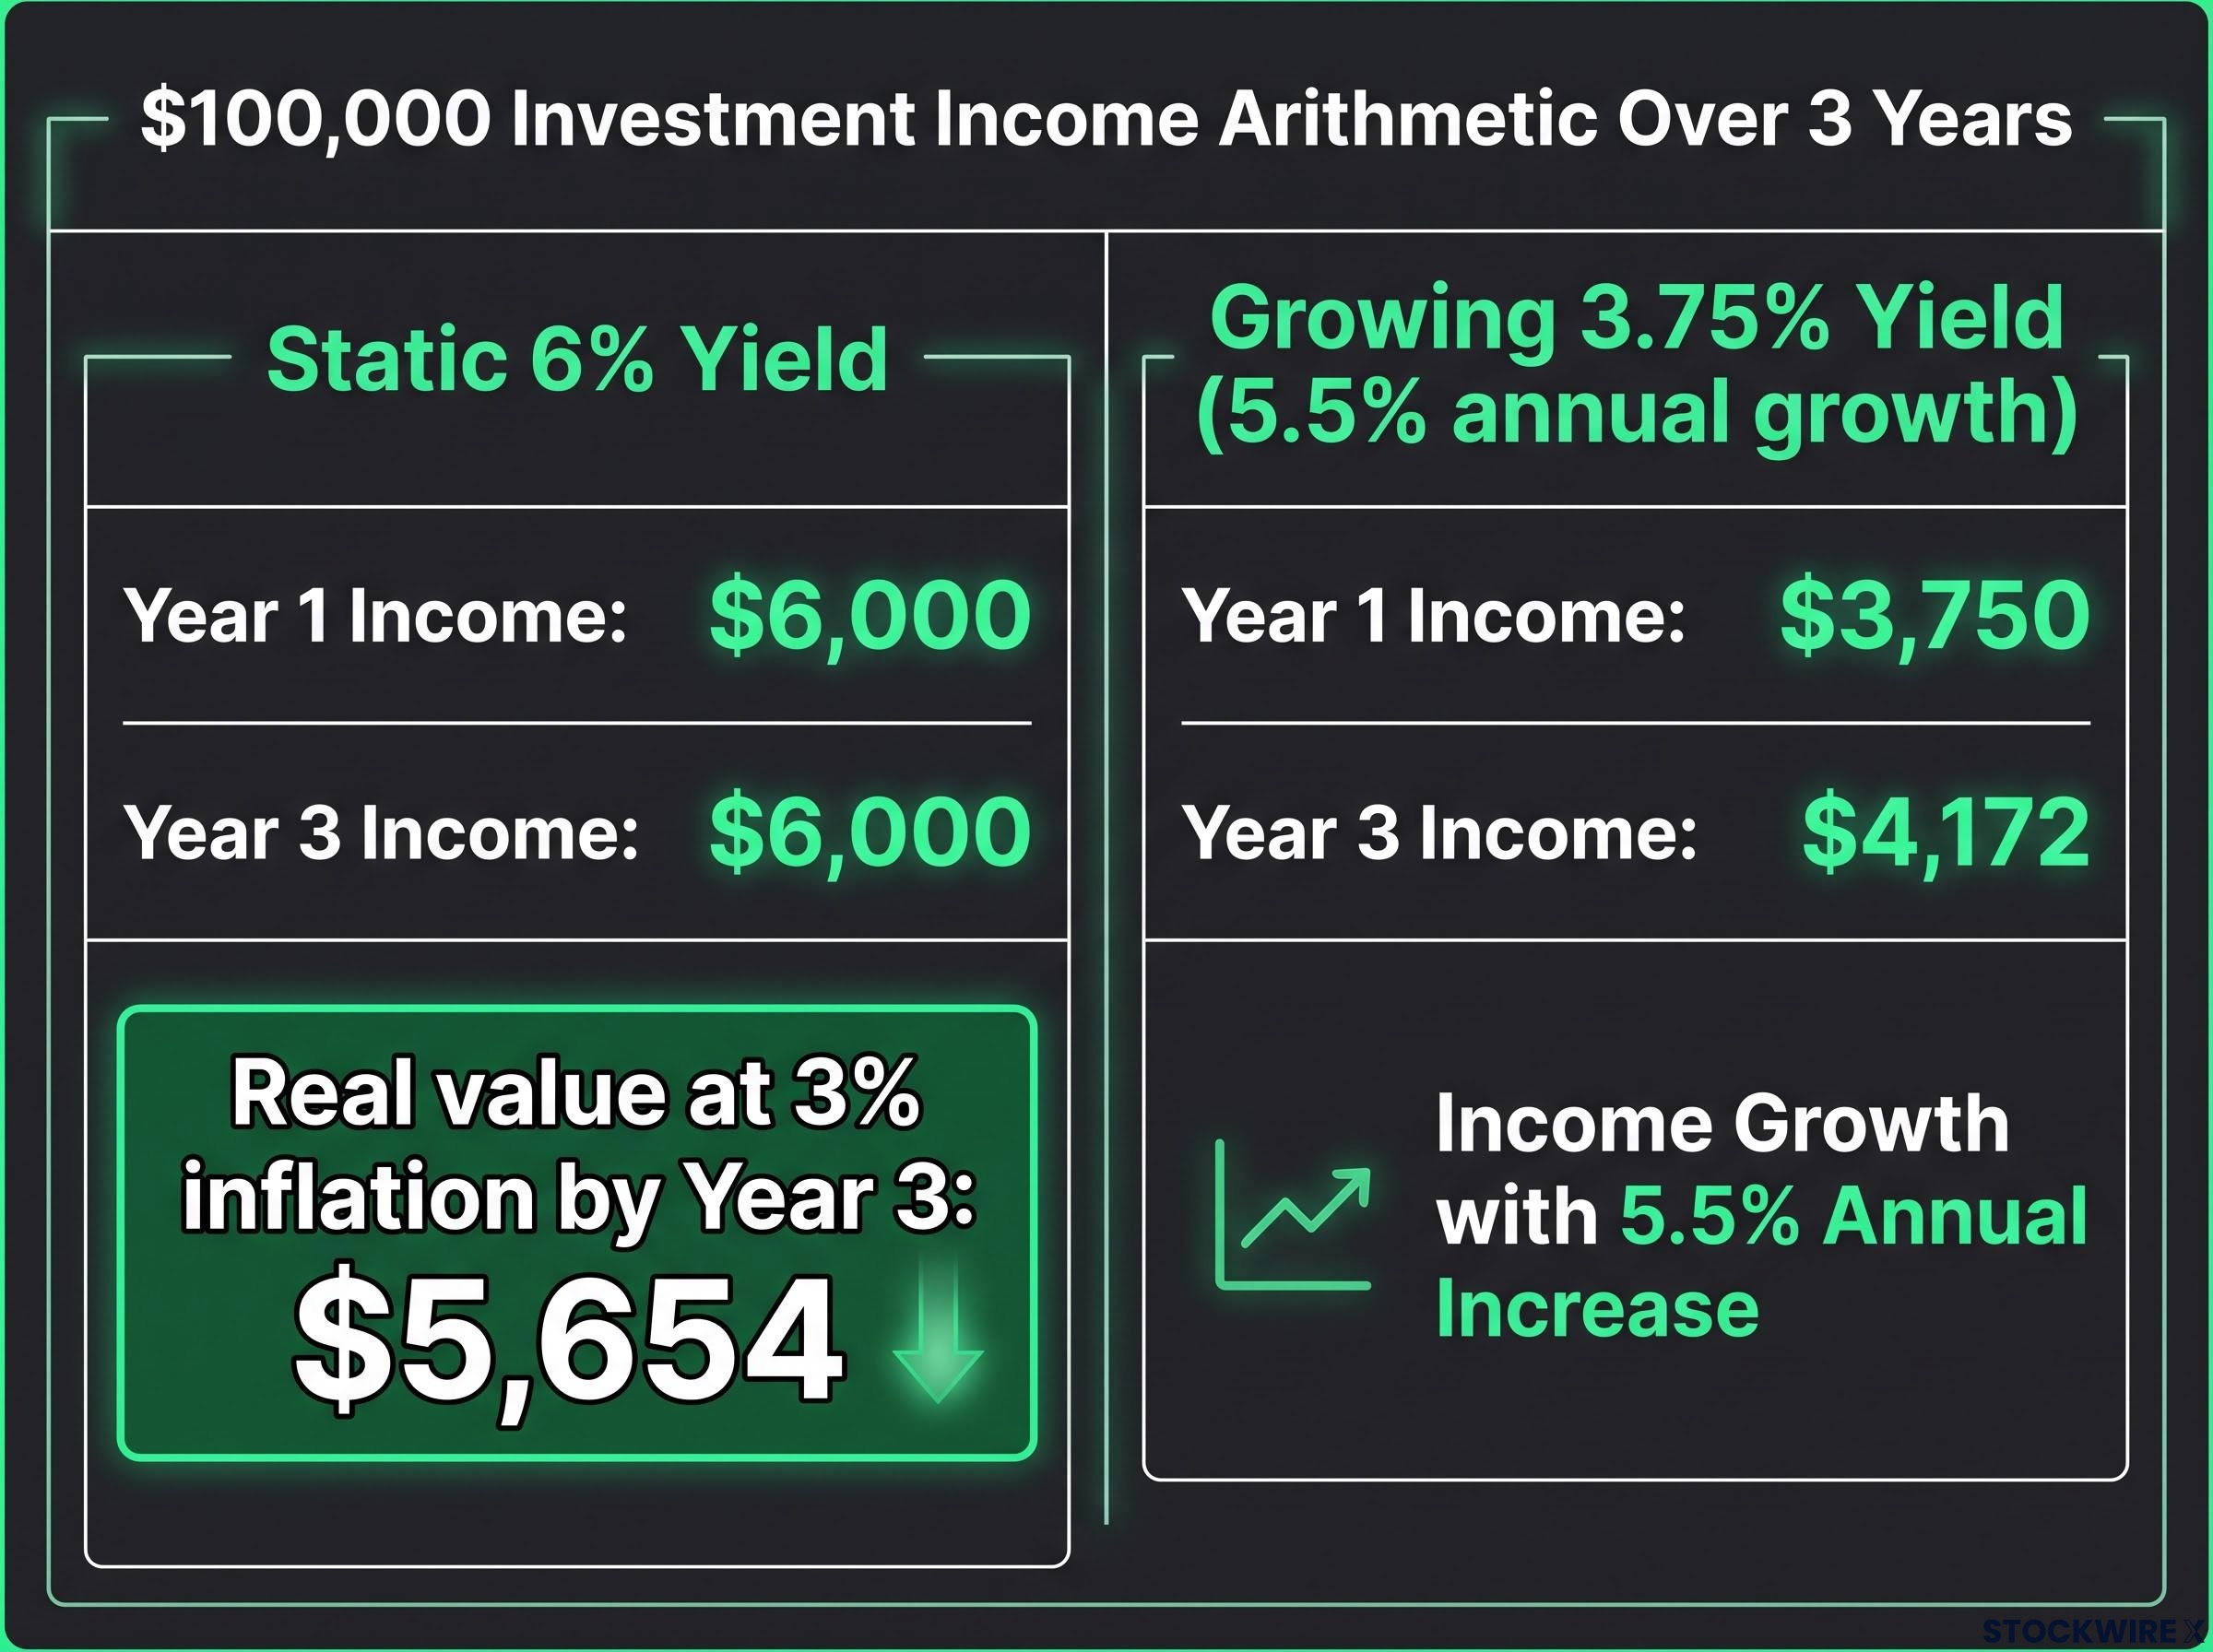
| Scenario | Year 1 Income (per $100,000) | Year 3 Income (per $100,000) | Three-Year Total Income |
|---|---|---|---|
| Static 6% yield | $6,000 | $6,000 | $18,000 |
| Growing 3.75% yield (5.5% annual growth) | $3,750 | $4,172 | $11,856 |
| Real value of static 6% at 3% inflation | $6,000 | $5,654 | $17,474 (real) |
The static yield still produces more total income over three years in nominal terms. But the gap narrows faster than most investors expect, and the real income line reveals the hidden cost. A $6,000 annual payout that stays flat while inflation runs at 3% is worth only $5,654 in purchasing power by year three.
The investor anchored to headline yield and ignoring the growth trajectory is not necessarily wrong over three years. But they are likely underestimating how quickly the growing yield closes the gap, and they are almost certainly ignoring the fact that their real income is shrinking. Extend the comparison to five or seven years and the grower overtakes the static position outright.
This article is for informational purposes only and should not be considered financial advice. Investors should conduct their own research and consult with financial professionals before making investment decisions. Past performance does not guarantee future results. Financial projections are subject to market conditions and various risk factors.
Building a forward-looking income position from mid-2026
The diagnosis is clear. The prescription requires a structured portfolio review, not a wholesale overhaul. Five sequential steps translate the analysis into action:
- Measure concentration in banks and miners across both direct holdings and index fund exposure. Most investors underestimate the overlap.
- Separate current yield from growth trajectory for each income position. A high yield with no growth forecast belongs in a different category than a moderate yield with a credible growth path.
- Apply the real income lens using an inflation deflator near 3%. If a position’s dividend is growing below that rate, real income is shrinking regardless of what the nominal payout says.
- Tilt toward sectors with forecast growth: utilities, consumer staples, and A-REITs offer the combination of current income and forward growth that the bank and miner positions increasingly cannot match.
- Consider active income management or targeted stock selection. Passive ASX 200 products hard-wire concentration in the sectors facing the weakest dividend growth outlook.
The income is still in Australian equities. It is just no longer concentrated where most passive investors are looking for it.
Across Morningstar’s Australian analyst coverage, 124 domestic companies have paid dividends without interruption for at least ten years, representing a concrete starting point for investors seeking credible income alternatives. The FY26-FY28 planning horizon gives investors time to reweight without urgency, but the divergence between the top ten and the broader opportunity set is already wide enough to act on.
For investors wanting to translate the FY26-FY28 sector reweighting framework into a specific capital plan, our dedicated guide to income capital targets for Australian investors walks through the ASFA retirement benchmarks, franking-adjusted yield calculations, and asset location hierarchy that determine how much capital a well-constructed Australian income portfolio actually needs.
What the next three years actually require from an income investor
Banks and miners will likely provide income stability at best, not growth. Utilities, consumer staples, A-REITs, and selected financials outside the big four offer the more credible three-year income growth case according to Morningstar projections. The gap between these two groups is not speculative; it is embedded in the earnings and capex trajectories that analysts can already see.
The investor decision is whether to accept the passive index concentration and the real income erosion it implies, or to take deliberate steps toward sectors where the dividend growth is actually forecast to appear. Both are valid choices, but only one of them is an informed one.
The single analytical frame worth carrying forward: measure your dividends in purchasing power, not nominal dollars. That lens changes which positions look safe and which are quietly falling behind.