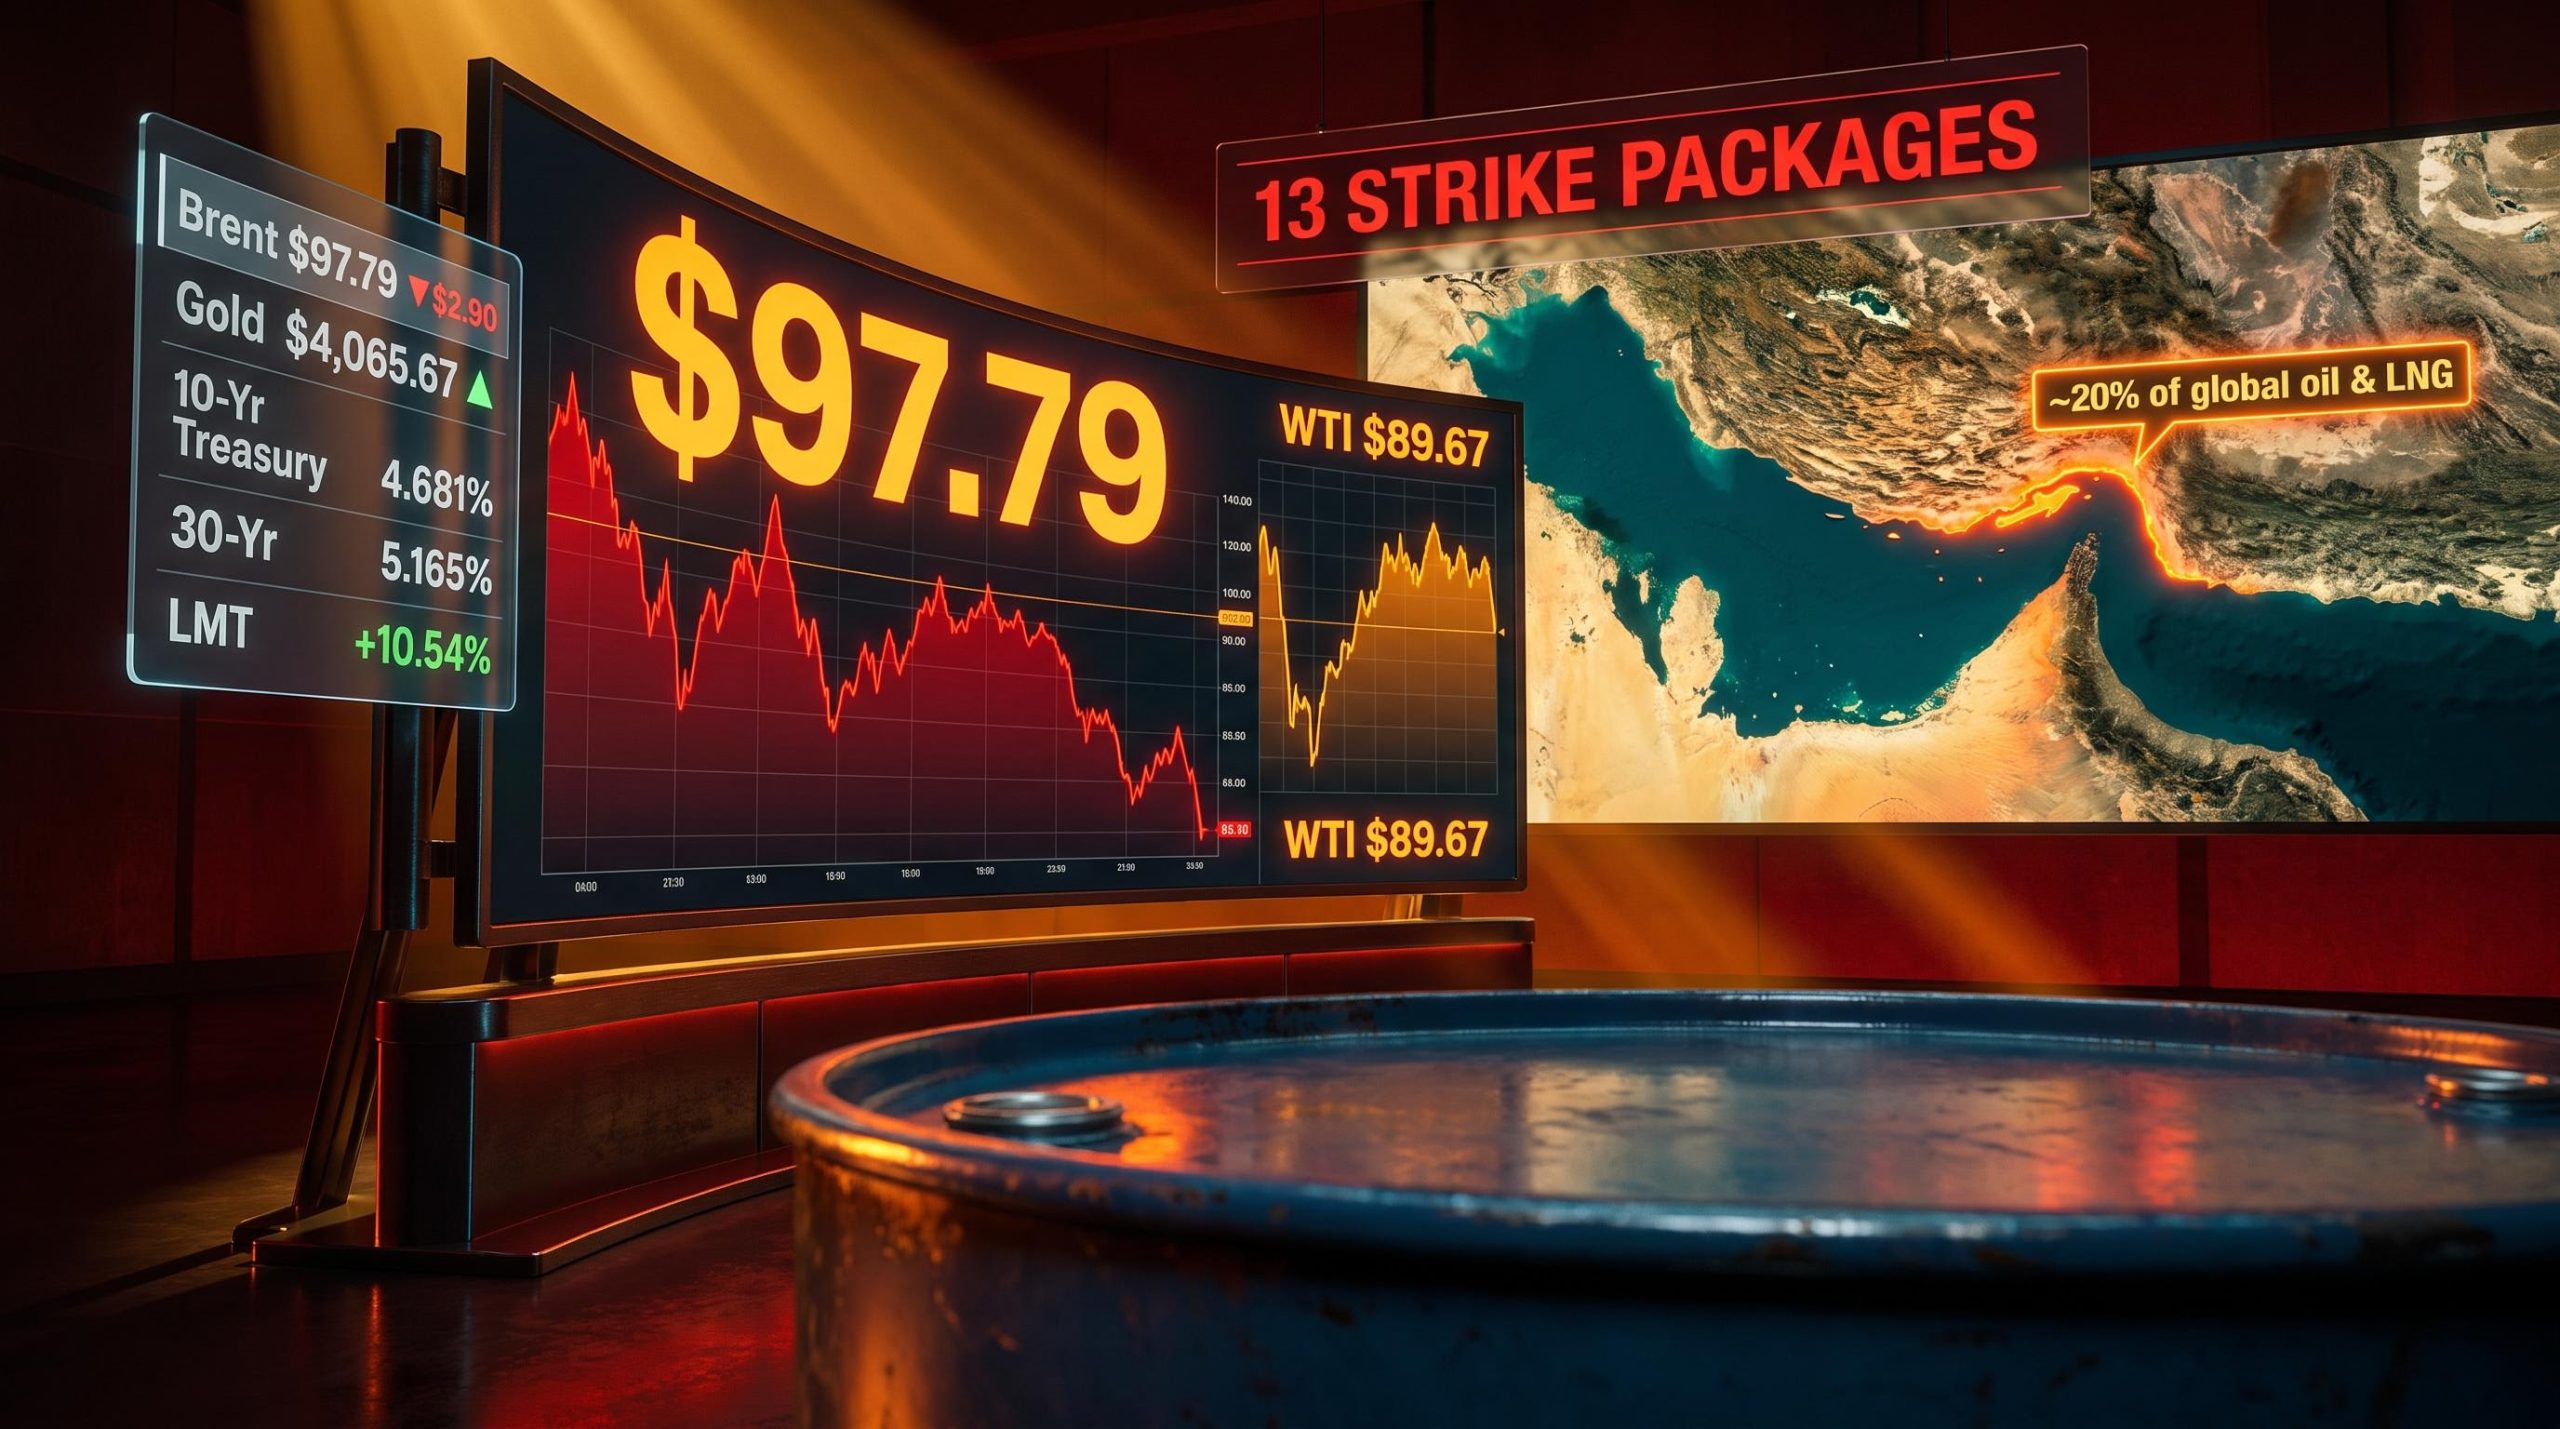
On Thursday, 23 July, Brent crude briefly crossed $100 per barrel. By Friday morning it had pulled back to $97.79. Neither fact tells you whether the worst is over or just getting started.
The price action is the surface signal. Beneath it, American forces have now completed 13 successive strike packages against Iranian military infrastructure, Tehran has formally turned down the only ceasefire proposal currently on the table, and the Strait of Hormuz, through which roughly 20% of the world’s oil and LNG normally flows, remains under active threat. Two chokepoints are simultaneously at risk, and they do not carry equal consequences.
Here is a clear map of the forces pushing oil prices right now, a framework for reading the two very different risk scenarios still in play, and the specific indicators worth watching before making any judgements about where this goes next.
Iran rejects the ceasefire, and the Strait of Hormuz is why
According to the New York Times on 23 July 2026, which cited Iranian and Iraqi officials, Tehran turned down a U.S.-backed ceasefire proposal that had been conveyed via Iraqi Prime Minister Ali al-Zaidi. Iran’s position was precise: it would not accept any interim arrangement while the question of who controls the Strait of Hormuz remained open.
No alternative proposal is currently being discussed, meaning this rejection removes the near-term diplomatic off-ramp entirely.
The July ceasefire collapse followed a near-identical pattern to earlier episodes in the conflict, with Iran attacking commercial vessels near Hormuz and U.S. forces responding with strikes on dozens of Iranian military targets, each cycle resetting the risk premium upward from whatever floor diplomacy had briefly established.
Three facts define the current diplomatic position:
- Iran rejected the only ceasefire proposal on the table
- No alternative proposal is currently under consideration
- Hormuz control, not broader conflict terms, was the stated objection
At the time of writing, the U.S. military has carried out 13 rounds of strikes since operations began on 28 February 2026, with the latest package hitting Iranian drone depots and shore-based surveillance infrastructure. The ceasefire did not collapse over a generic disagreement. It collapsed over the specific geography that matters most to oil markets, which means the chokepoint risk is structural, not a bargaining chip that dissolves with the next round of talks.
When big ASX news breaks, our subscribers know first
Why the Strait of Hormuz is not the same risk as the Red Sea
Red Sea disruption via the Bab el-Mandeb strait can be partially mitigated. Tankers reroute around the Cape of Good Hope at the cost of higher freight rates and longer transit times. It is expensive and inefficient, but the oil still moves.
The Strait of Hormuz has no equivalent bypass. It is the primary export corridor for Saudi Arabia, the UAE, Kuwait, Iraq, Qatar, and Iran. A sustained closure does not mean slower deliveries. It means physical supply disappears from the market.
| Chokepoint | Bypass Available | Oil Volume at Risk | Severity Rating |
|---|---|---|---|
| Red Sea / Bab el-Mandeb | Yes (Cape of Good Hope) | Moderate (reroutable) | High cost, manageable supply |
| Strait of Hormuz | No viable alternative | ~20% of global oil and LNG | Severe; physical supply loss |
Most coverage conflates the two disruptions. They are not equivalent. Any confirmed Hormuz closure is a fundamentally different signal from another Red Sea shipping incident.
What a real Hormuz closure would mean for prices
The March 2026 episode provides the empirical template. Brent moved from the high-70s to peaks near $120-$126 when Hormuz threats intensified. Analysts including JPMorgan have estimated that a serious disruption lasting three to four weeks could force Gulf producers to curtail output and drive Brent well above $100, with further upside depending on duration. That tail risk is what keeps a floor under oil prices even on days when the headline number pulls back.
How oil at $100 transmits into inflation and Fed policy
The transmission chain from crude prices to consumer prices runs through three stages:
- Direct CPI impact: Higher crude raises gasoline, diesel, and heating fuel costs, which move headline inflation quickly
- Indirect cost-push pressure: Elevated fuel costs raise transport and input costs across manufacturing, agriculture, and services, broadening inflation beyond energy line items
- Second-round expectations: If sustained high energy prices shift inflation expectations and trigger wage demands, the Fed loses the ability to treat the shock as transitory
That third stage is the one central banks fear most, particularly after the 2022-2023 inflation episode demonstrated how quickly expectations can become self-reinforcing.
CPI transmission from sustained triple-digit crude operates on two distinct timelines: gasoline and diesel feed headline inflation within weeks, while freight, food, and petrochemical cost pressures build through a 3-6 month lag that means the June and July CPI prints carry more policy weight than any single month’s energy data.
Jonas Goltermann, Chief Markets Economist at Capital Economics, warned that there remains “substantial potential for further volatility” if the U.S.-Iran standoff intensifies, while noting that central banks are still taking a measured, cautious stance toward the renewed energy price surge.
The bond market has not dismissed the risk. The U.S. 10-Year Treasury yield stood at 4.681% on Friday, down only marginally from Thursday’s elevated levels. The 30-Year yield sits at 5.165%. The 10-2 Year Treasury Yield Spread widened to 31.32 basis points, up 15.27% on the day.
For anyone watching mortgage rates, savings yields, or equity valuations, that combination tells you the bond market is pricing relief, not resolution. The Fed’s room to cut has narrowed materially.
What the cross-asset data is actually showing right now
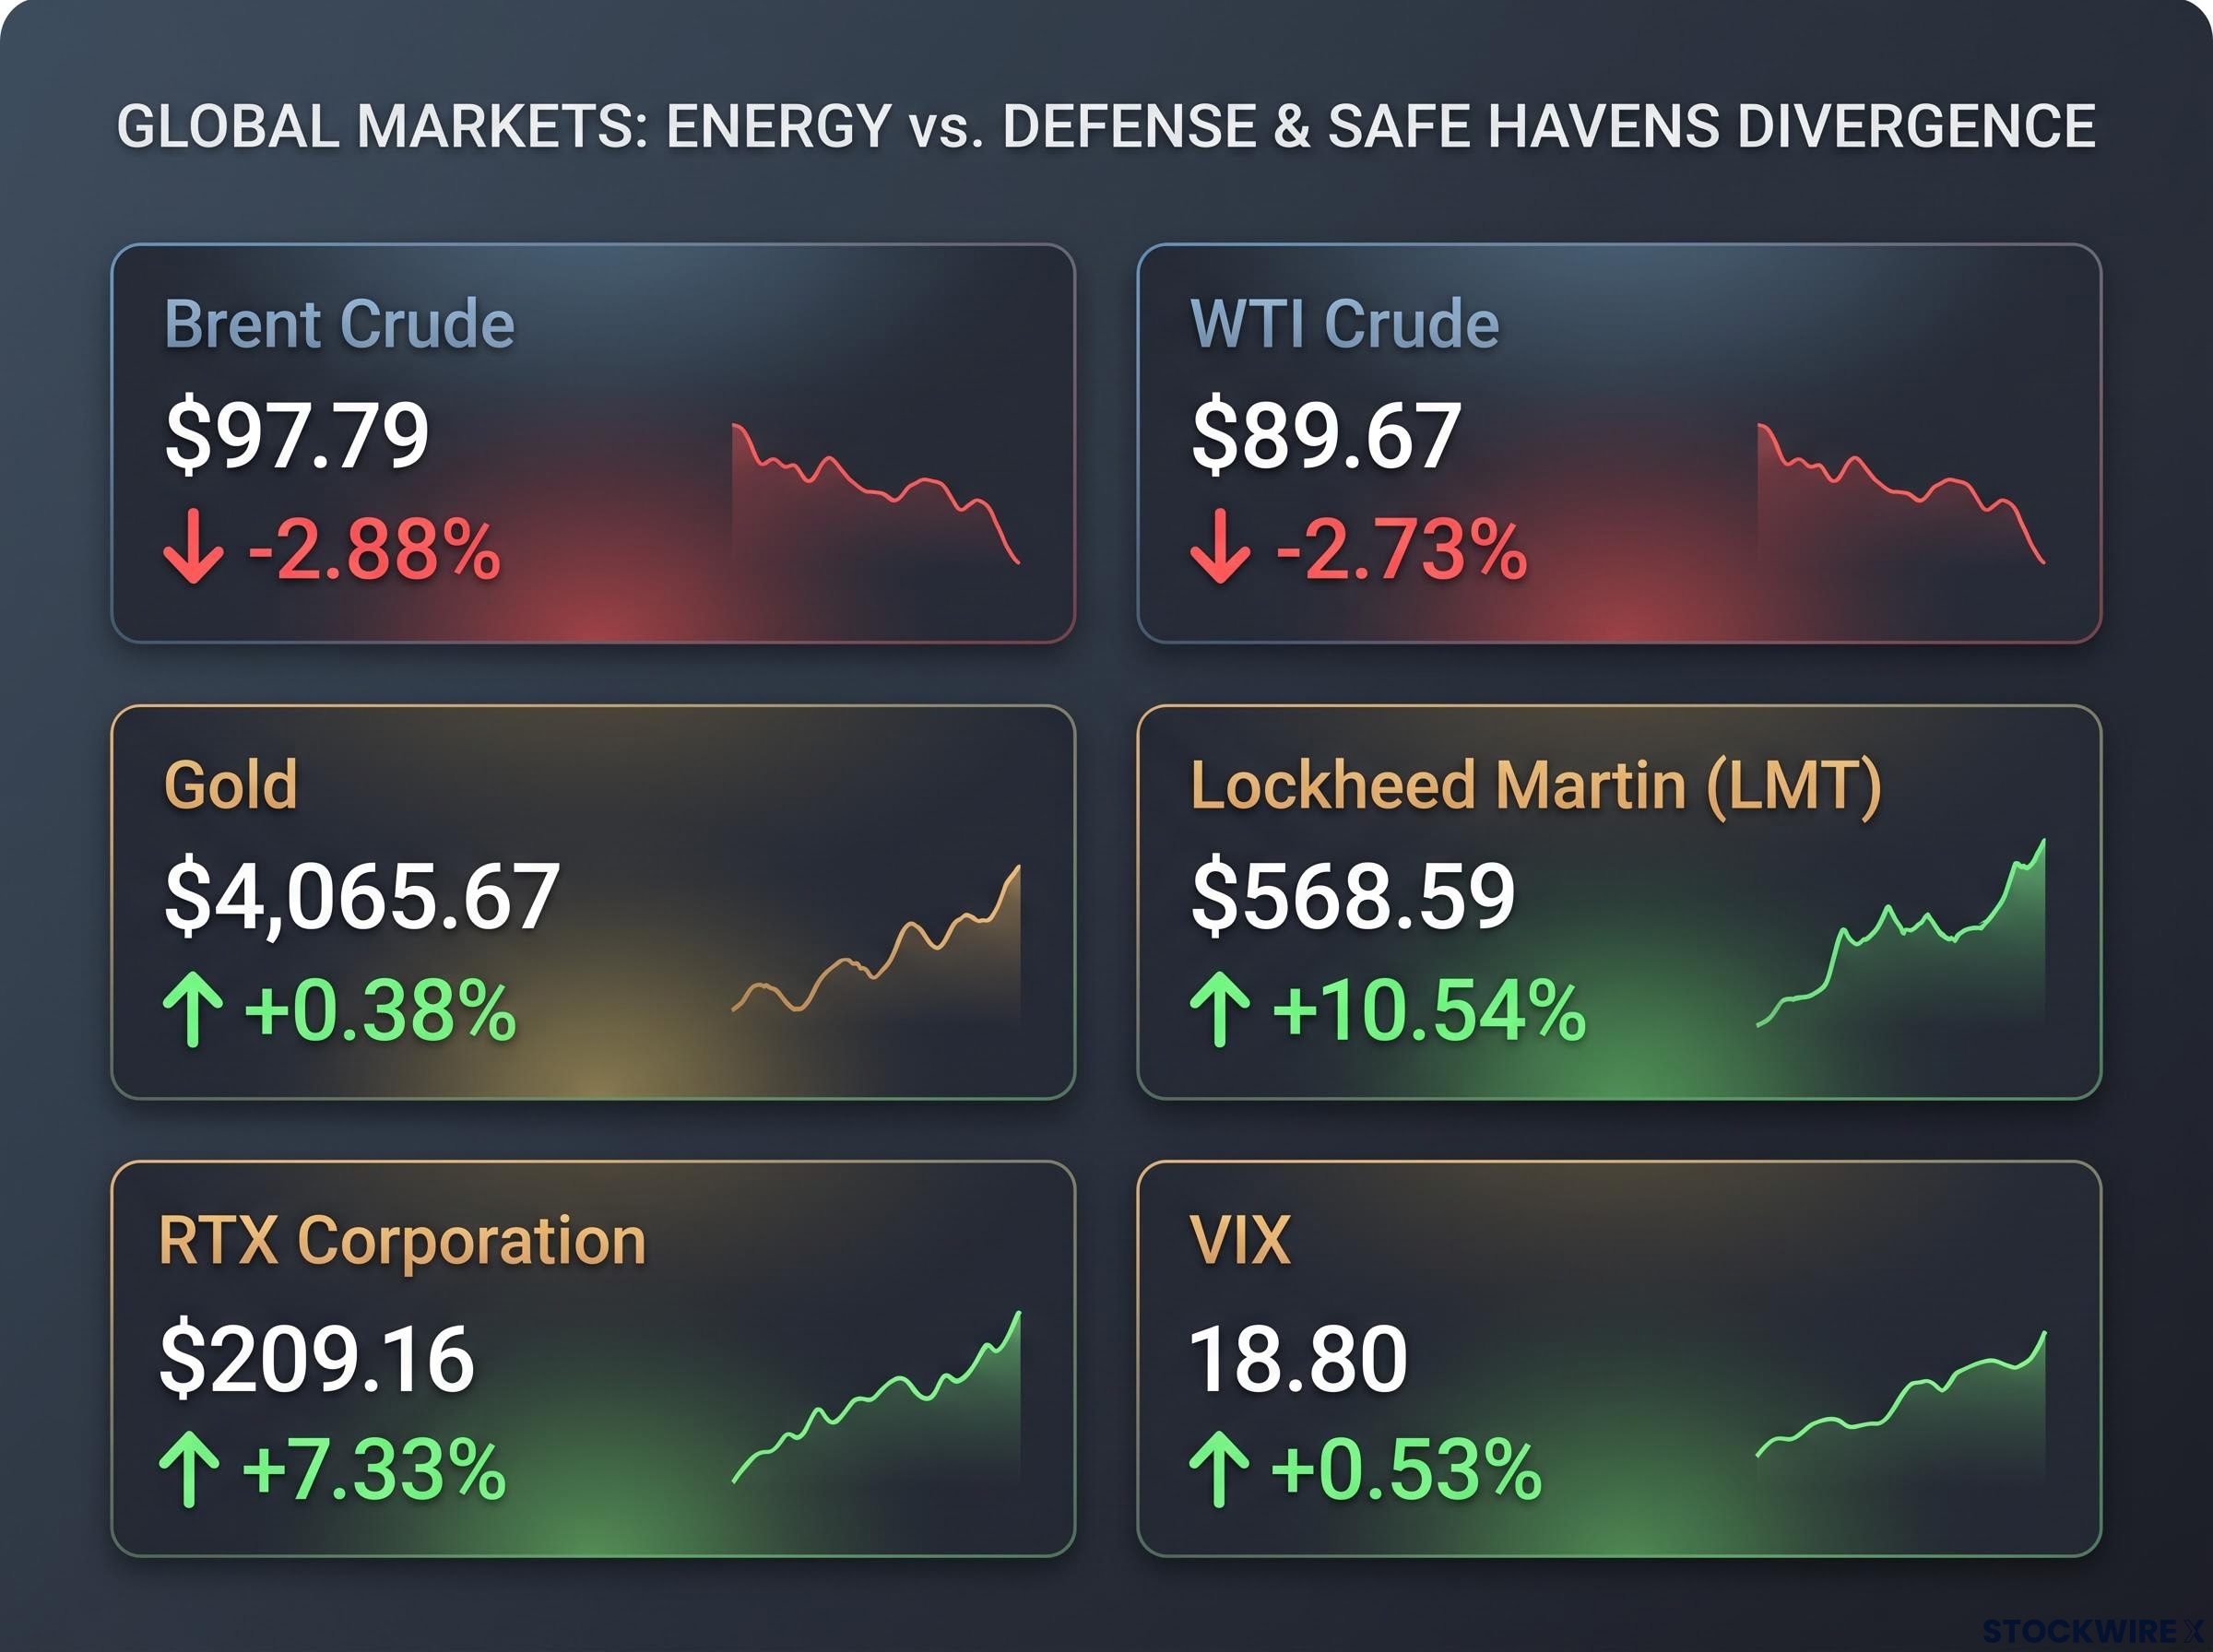
Friday’s session told a more nuanced story than crude alone. Brent pulled back $2.90 to $97.79, and WTI fell $2.52 to $89.67. On its own, that looks like cooling pressure.
But gold rose 0.38% to $4,065.67 and silver gained 1.41%. Safe-haven demand persisted even as oil retreated, which tells you risk sentiment did not fully recover with the crude pullback.
The clearest equity-market expression of ongoing military conflict expectations came from defence stocks. Lockheed Martin surged 10.54% to $568.59. RTX Corporation gained 7.33% to $209.16.
| Asset | Price / Level | Change | Signal |
|---|---|---|---|
| Brent Crude | $97.79 | -2.88% | Partial retreat, not trend reversal |
| WTI Crude | $89.67 | -2.73% | Tracking Brent lower |
| Gold | $4,065.67 | +0.38% | Safe-haven bid |
| Silver | $58.873 | +1.41% | Safe-haven bid |
| Lockheed Martin (LMT) | $568.59 | +10.54% | Military conflict premium |
| RTX Corporation | $209.16 | +7.33% | Military conflict premium |
| VIX | 18.80 | +0.53% | Elevated, not stressed |
| U.S. Dollar Index | 101.17 | -0.11% | Slight growth-fear softness |
| U.S. 10-Year Treasury | 4.681% | -0.47% | Inflation anxiety persisting |
Reading these together rather than watching oil in isolation gives a more honest picture. The divergence between falling crude and rising gold on the same session tells you markets are pricing a broader anxiety about the conflict’s trajectory that oil’s intraday retreat does not resolve.
Understanding geopolitical oil shocks: how conflict becomes a commodity price
A geopolitical risk premium is the portion of the crude price above what supply-and-demand fundamentals alone would justify. It reflects the market’s collective estimate of the probability and severity of a supply disruption. When that probability rises, the premium expands, and the barrel gets more expensive even before any physical supply is actually lost.
In this crisis, three distinct layers of risk premium are stacking on top of each other:
- Red Sea disruption: Iran-backed Houthi fighters have attacked Saudi tankers in the Red Sea shipping corridor, raising freight and insurance costs
- Iranian military degradation: Thirteen rounds of U.S. strikes have reduced Iranian maritime and surveillance capacity, increasing uncertainty about Tehran’s next move
- Hormuz threat posture: Iran’s refusal to resolve the Hormuz control question keeps the most severe disruption scenario alive as a priced-in possibility
The early-phase jump of 10-13% in Brent within days of the conflict’s onset in late February illustrates how quickly risk premium can inflate. The gap between today’s $97.79 and the March peak near $120-$126 shows how much it can also deflate when immediate escalation pauses.
The distinction matters because risk-premium-driven price spikes can reverse rapidly on a diplomatic headline, while fundamental supply-loss-driven spikes persist until physical barrels return to the market. The current situation contains elements of both.
A geopolitical risk premium deflates rapidly when escalation pauses because markets process geopolitical events as probability-adjusted inputs to future earnings rather than proportional headline shocks, a dynamic that explains why consensus predictions have consistently overestimated equity damage across multiple recent conflict episodes.
Why prices can fall sharply even before a conflict ends
Risk premium deflates when escalation pauses, a ceasefire rumour circulates, or a diplomatic signal reduces the perceived probability of Hormuz closure, even if no physical supply has returned to market.
Friday’s $2.90 pullback in Brent fits this pattern: no material change in the physical situation, but a slight reduction in perceived imminent risk after Thursday’s spike. Knowing this prevents the most common error: treating every oil price move during a conflict as a direct reflection of physical supply conditions, when much of the movement is probabilistic pricing. That is why monitoring diplomacy signals matters as much as monitoring the barrel price itself.
Three scenarios and the one variable that separates them
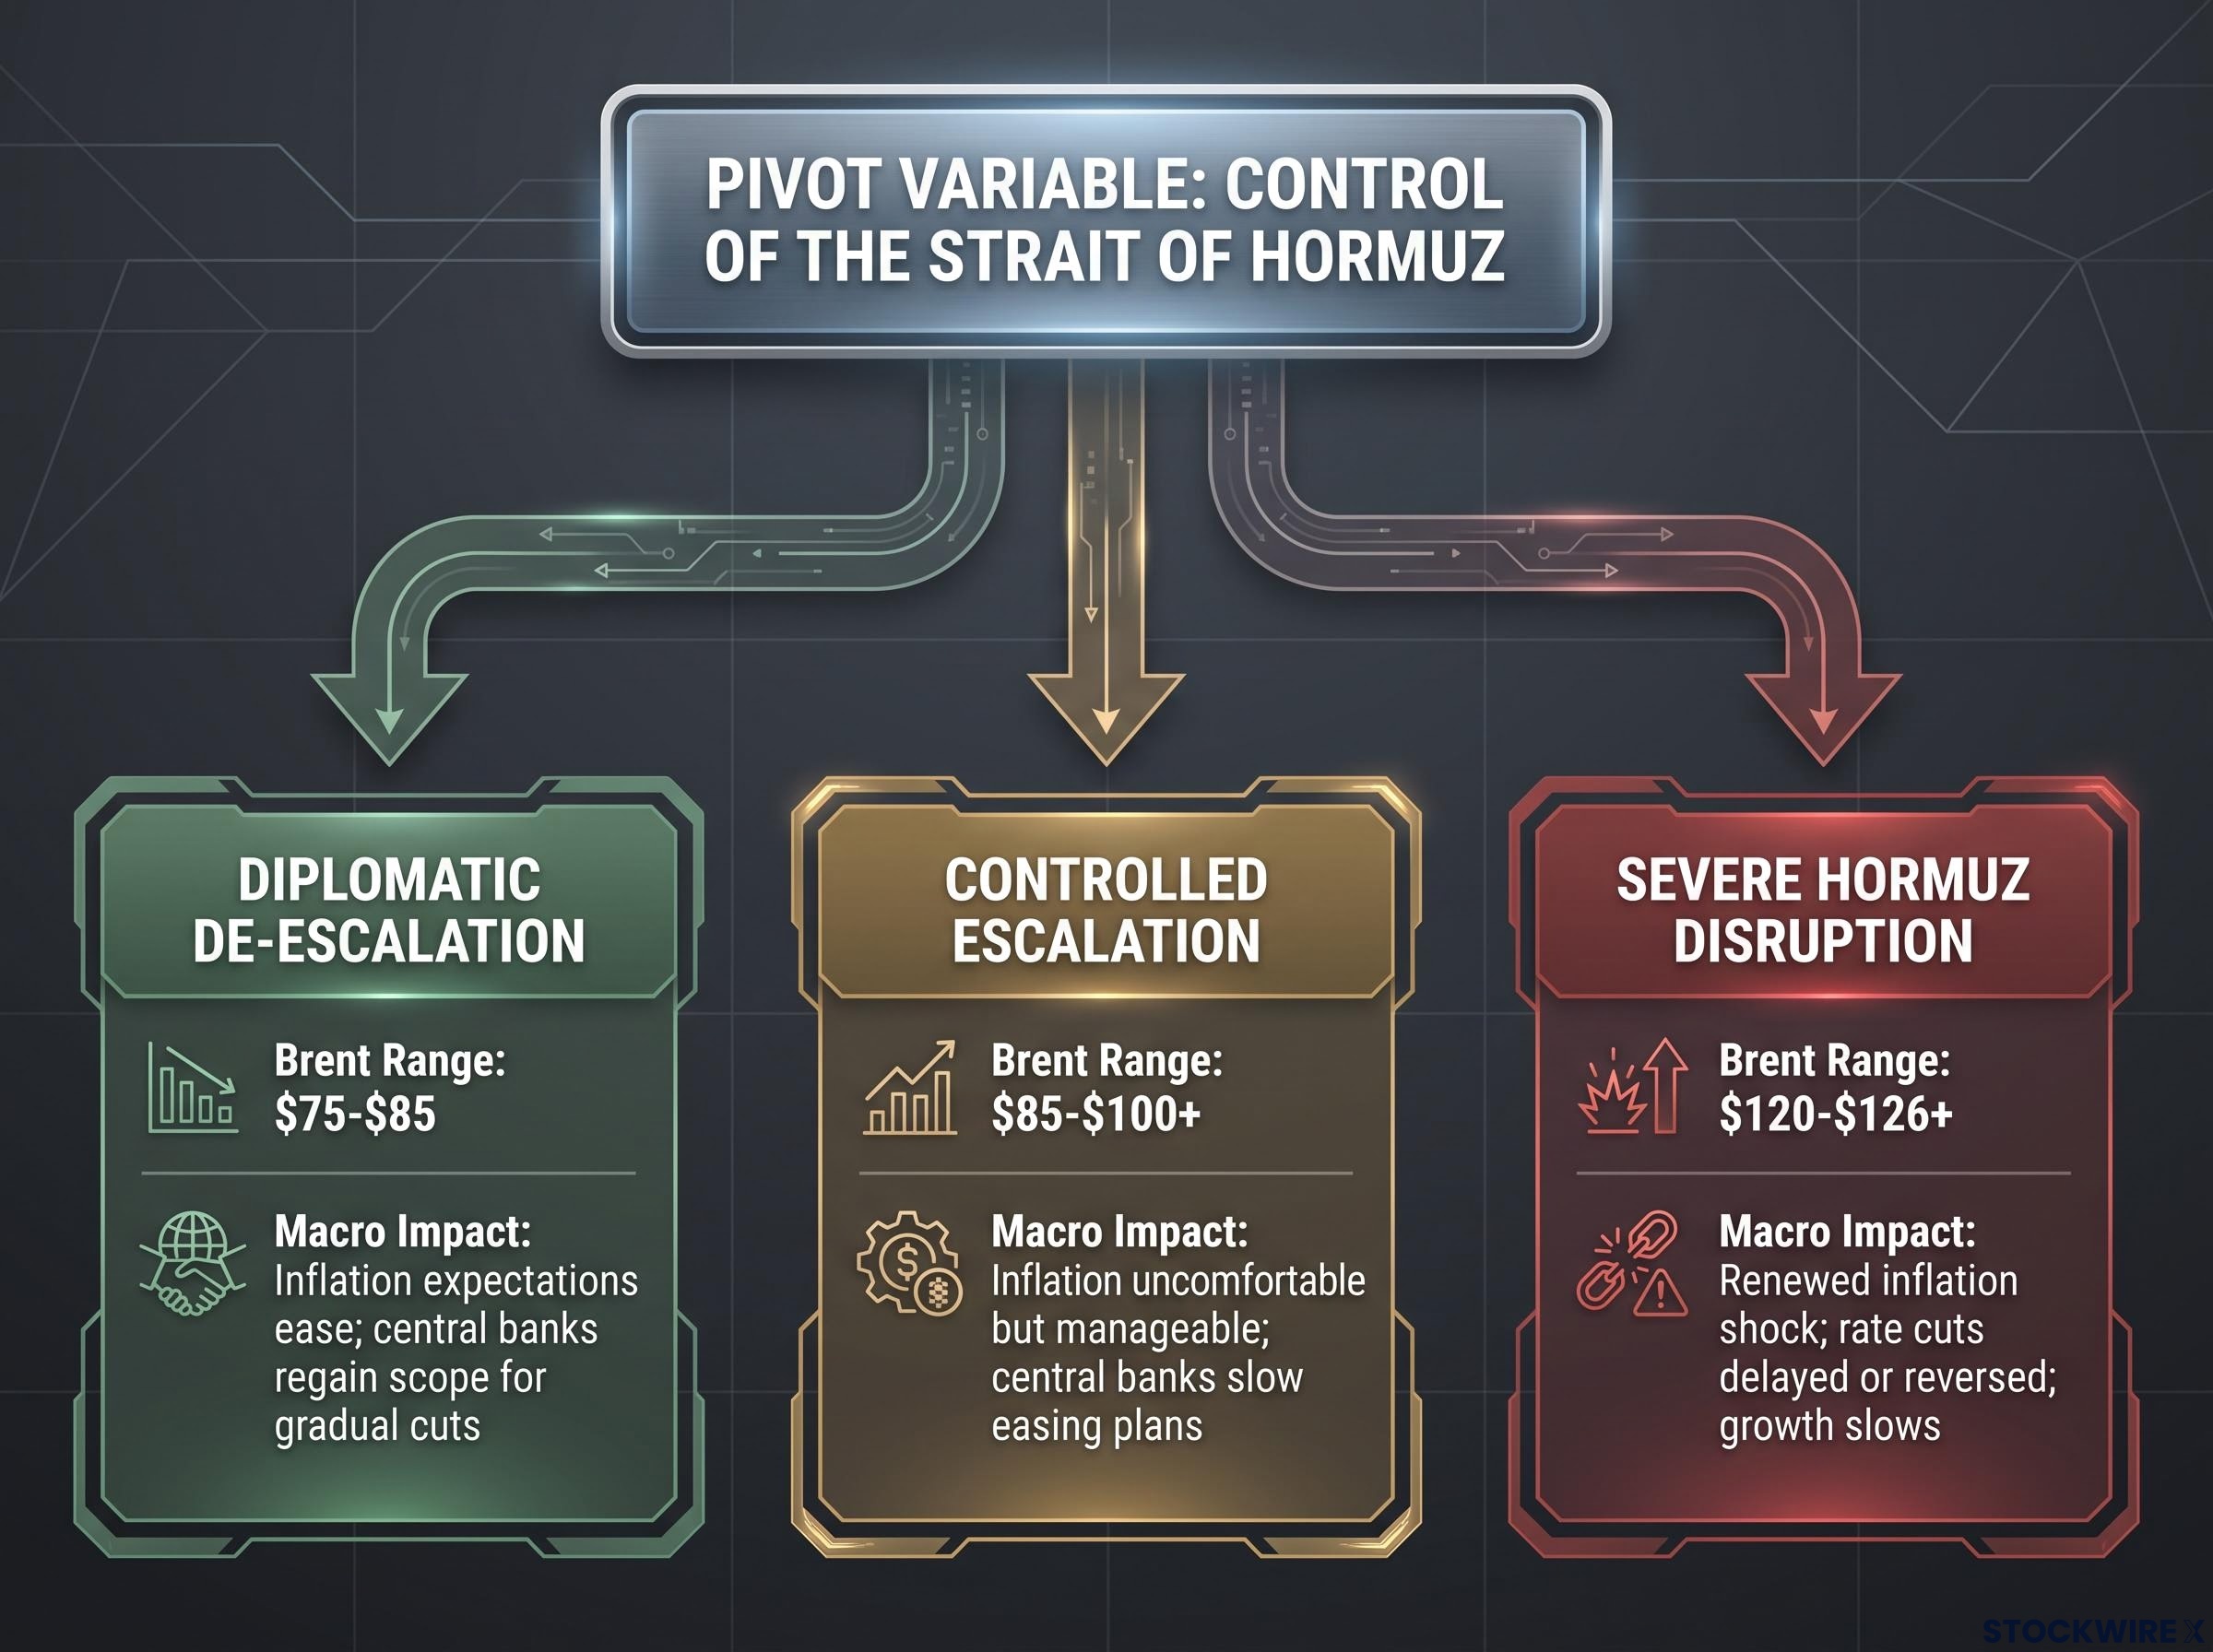
All three outcomes hinge on the same unresolved question: who controls the Strait of Hormuz.
| Scenario | Brent Range | Macro Impact | Asset Implications |
|---|---|---|---|
| Controlled Escalation | $85-$100+ | Inflation uncomfortable but manageable; central banks slow easing plans | Energy and defence outperform; rate-sensitive growth underperforms |
| Diplomatic De-escalation | $75-$85 | Inflation expectations ease; central banks regain scope for gradual cuts | Risk assets rally; cyclical and rate-sensitive sectors recover |
| Severe Hormuz Disruption | $120-$126+ | Renewed inflation shock; rate cuts delayed or reversed; growth slows | Equities enter deeper correction; credit spreads widen; VIX spikes |
These scenarios are not equally likely. Iran’s formal rejection of the only proposal that addresses Hormuz makes the de-escalation path a watch-for positive tail, not a base case. The controlled escalation scenario is what markets are currently pricing.
Specific indicators to monitor in real time:
- Brent sustained closes above $100 (signals risk premium re-expanding)
- Confirmed Hormuz shipping changes or closures (signals physical supply loss)
- Federal Reserve communication shifts on inflation or rate path
- Any new ceasefire proposal explicitly addressing Hormuz control
A scenario framework with a clearly identified pivot variable converts an abstract threat into a specific watchlist. The pivot is Hormuz. Everything else follows from it.
For investors wanting to translate the scenario framework into specific portfolio positioning, our dedicated guide to geopolitical investing strategy covers gold allocation targets, defence sector exposure, bond duration management, and the rebalancing discipline that institutional managers apply across the 2025-2026 crisis cycle.
What the conflict’s unresolved geometry means for the weeks ahead
Thirteen rounds of U.S. strikes have not produced a ceasefire. Iran’s objection is specifically about Hormuz control. The market is pricing controlled escalation as the base case while holding the severe scenario as a live tail.
Capital Economics warned of “substantial potential for further volatility” if the standoff intensifies, while also observing that central banks are currently holding a measured stance. That balance is the current equilibrium, and it is fragile.
Friday’s partial Treasury yield retreat, with the 10-year at 4.681%, is evidence of that fragility. The VIX at 18.80 sits elevated but not in stress territory, consistent with controlled escalation pricing. The combination of a VIX below 20 and a 30-year yield above 5% tells you markets are not panicking, but they are pricing meaningful inflation persistence. That posture changes fast if Hormuz headlines shift.
The one variable that changes the scenario calculus is any new diplomatic proposal that explicitly addresses Hormuz control. Until that surfaces, the conflict’s geometry favours continued energy market pressure.
This article is for informational purposes only and should not be considered financial advice. Investors should conduct their own research and consult with financial professionals before making investment decisions. These statements regarding scenario outcomes are speculative and subject to change based on market developments and the trajectory of the U.S.-Iran conflict.