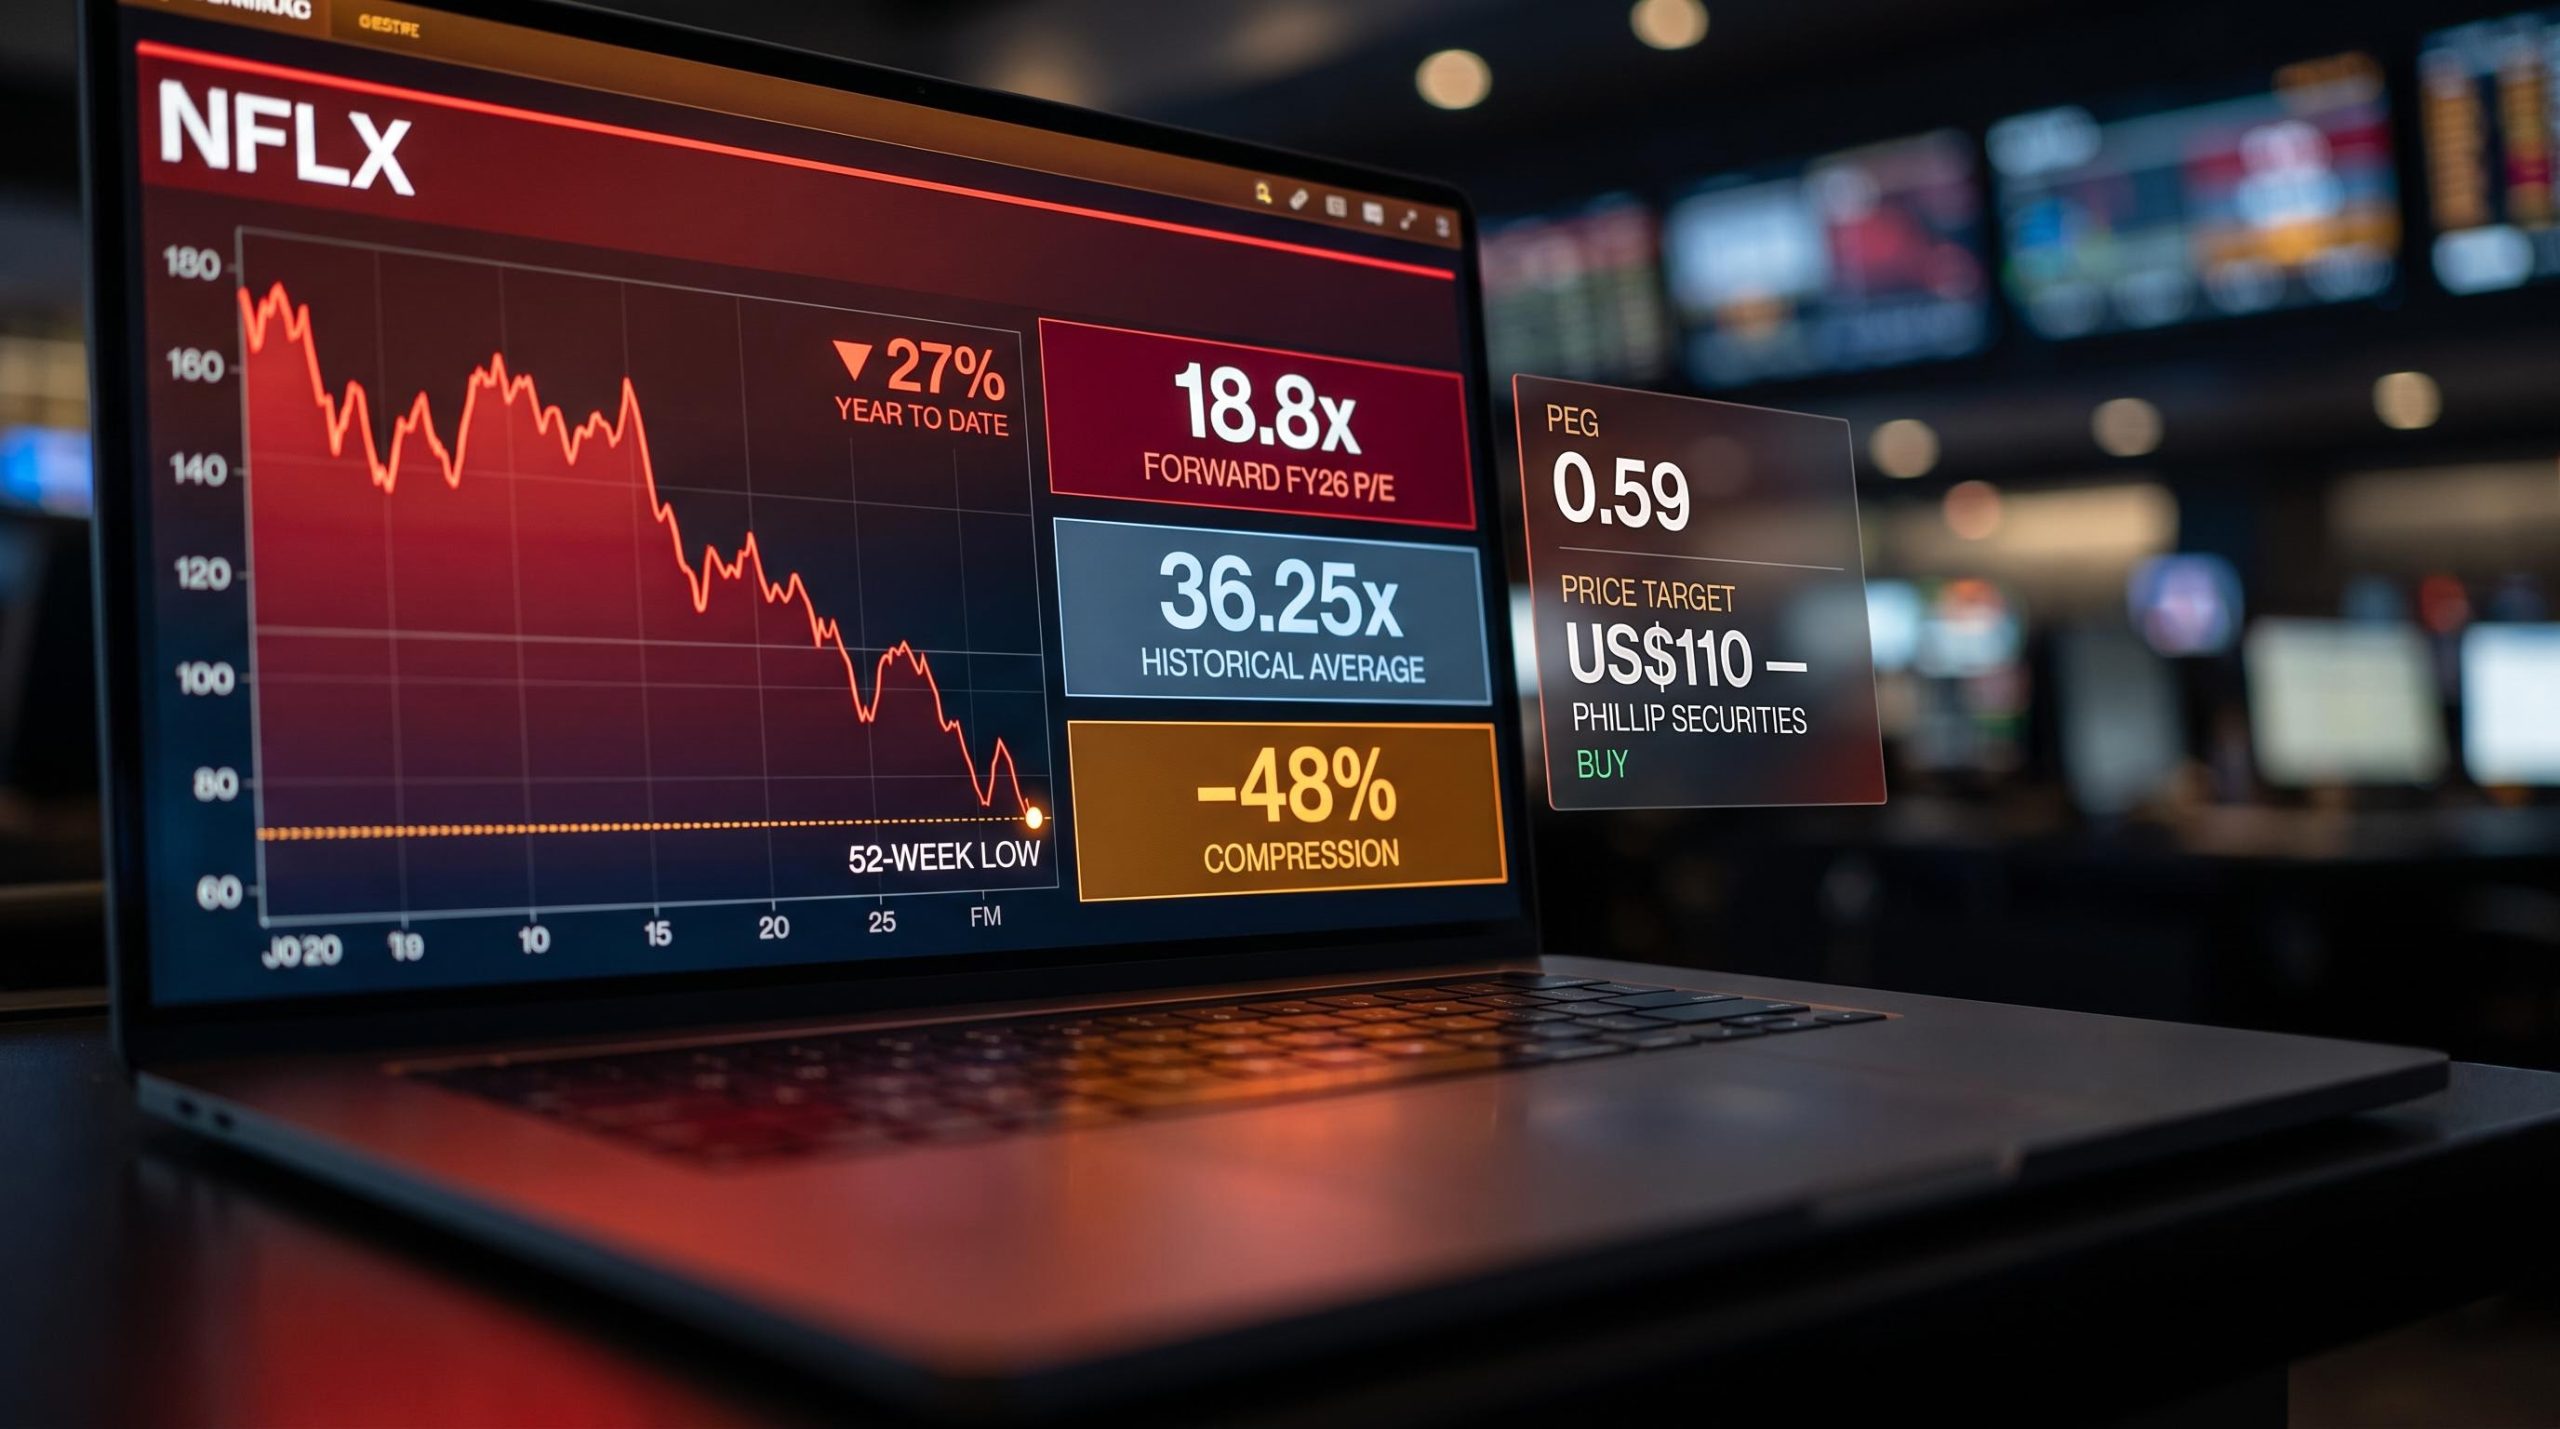
Netflix shares are down roughly 27% year-to-date in 2026, sitting near a 52-week low, and Phillip Securities Research just upgraded the stock to BUY. That combination is either a contrarian signal worth taking seriously or a value trap in disguise.
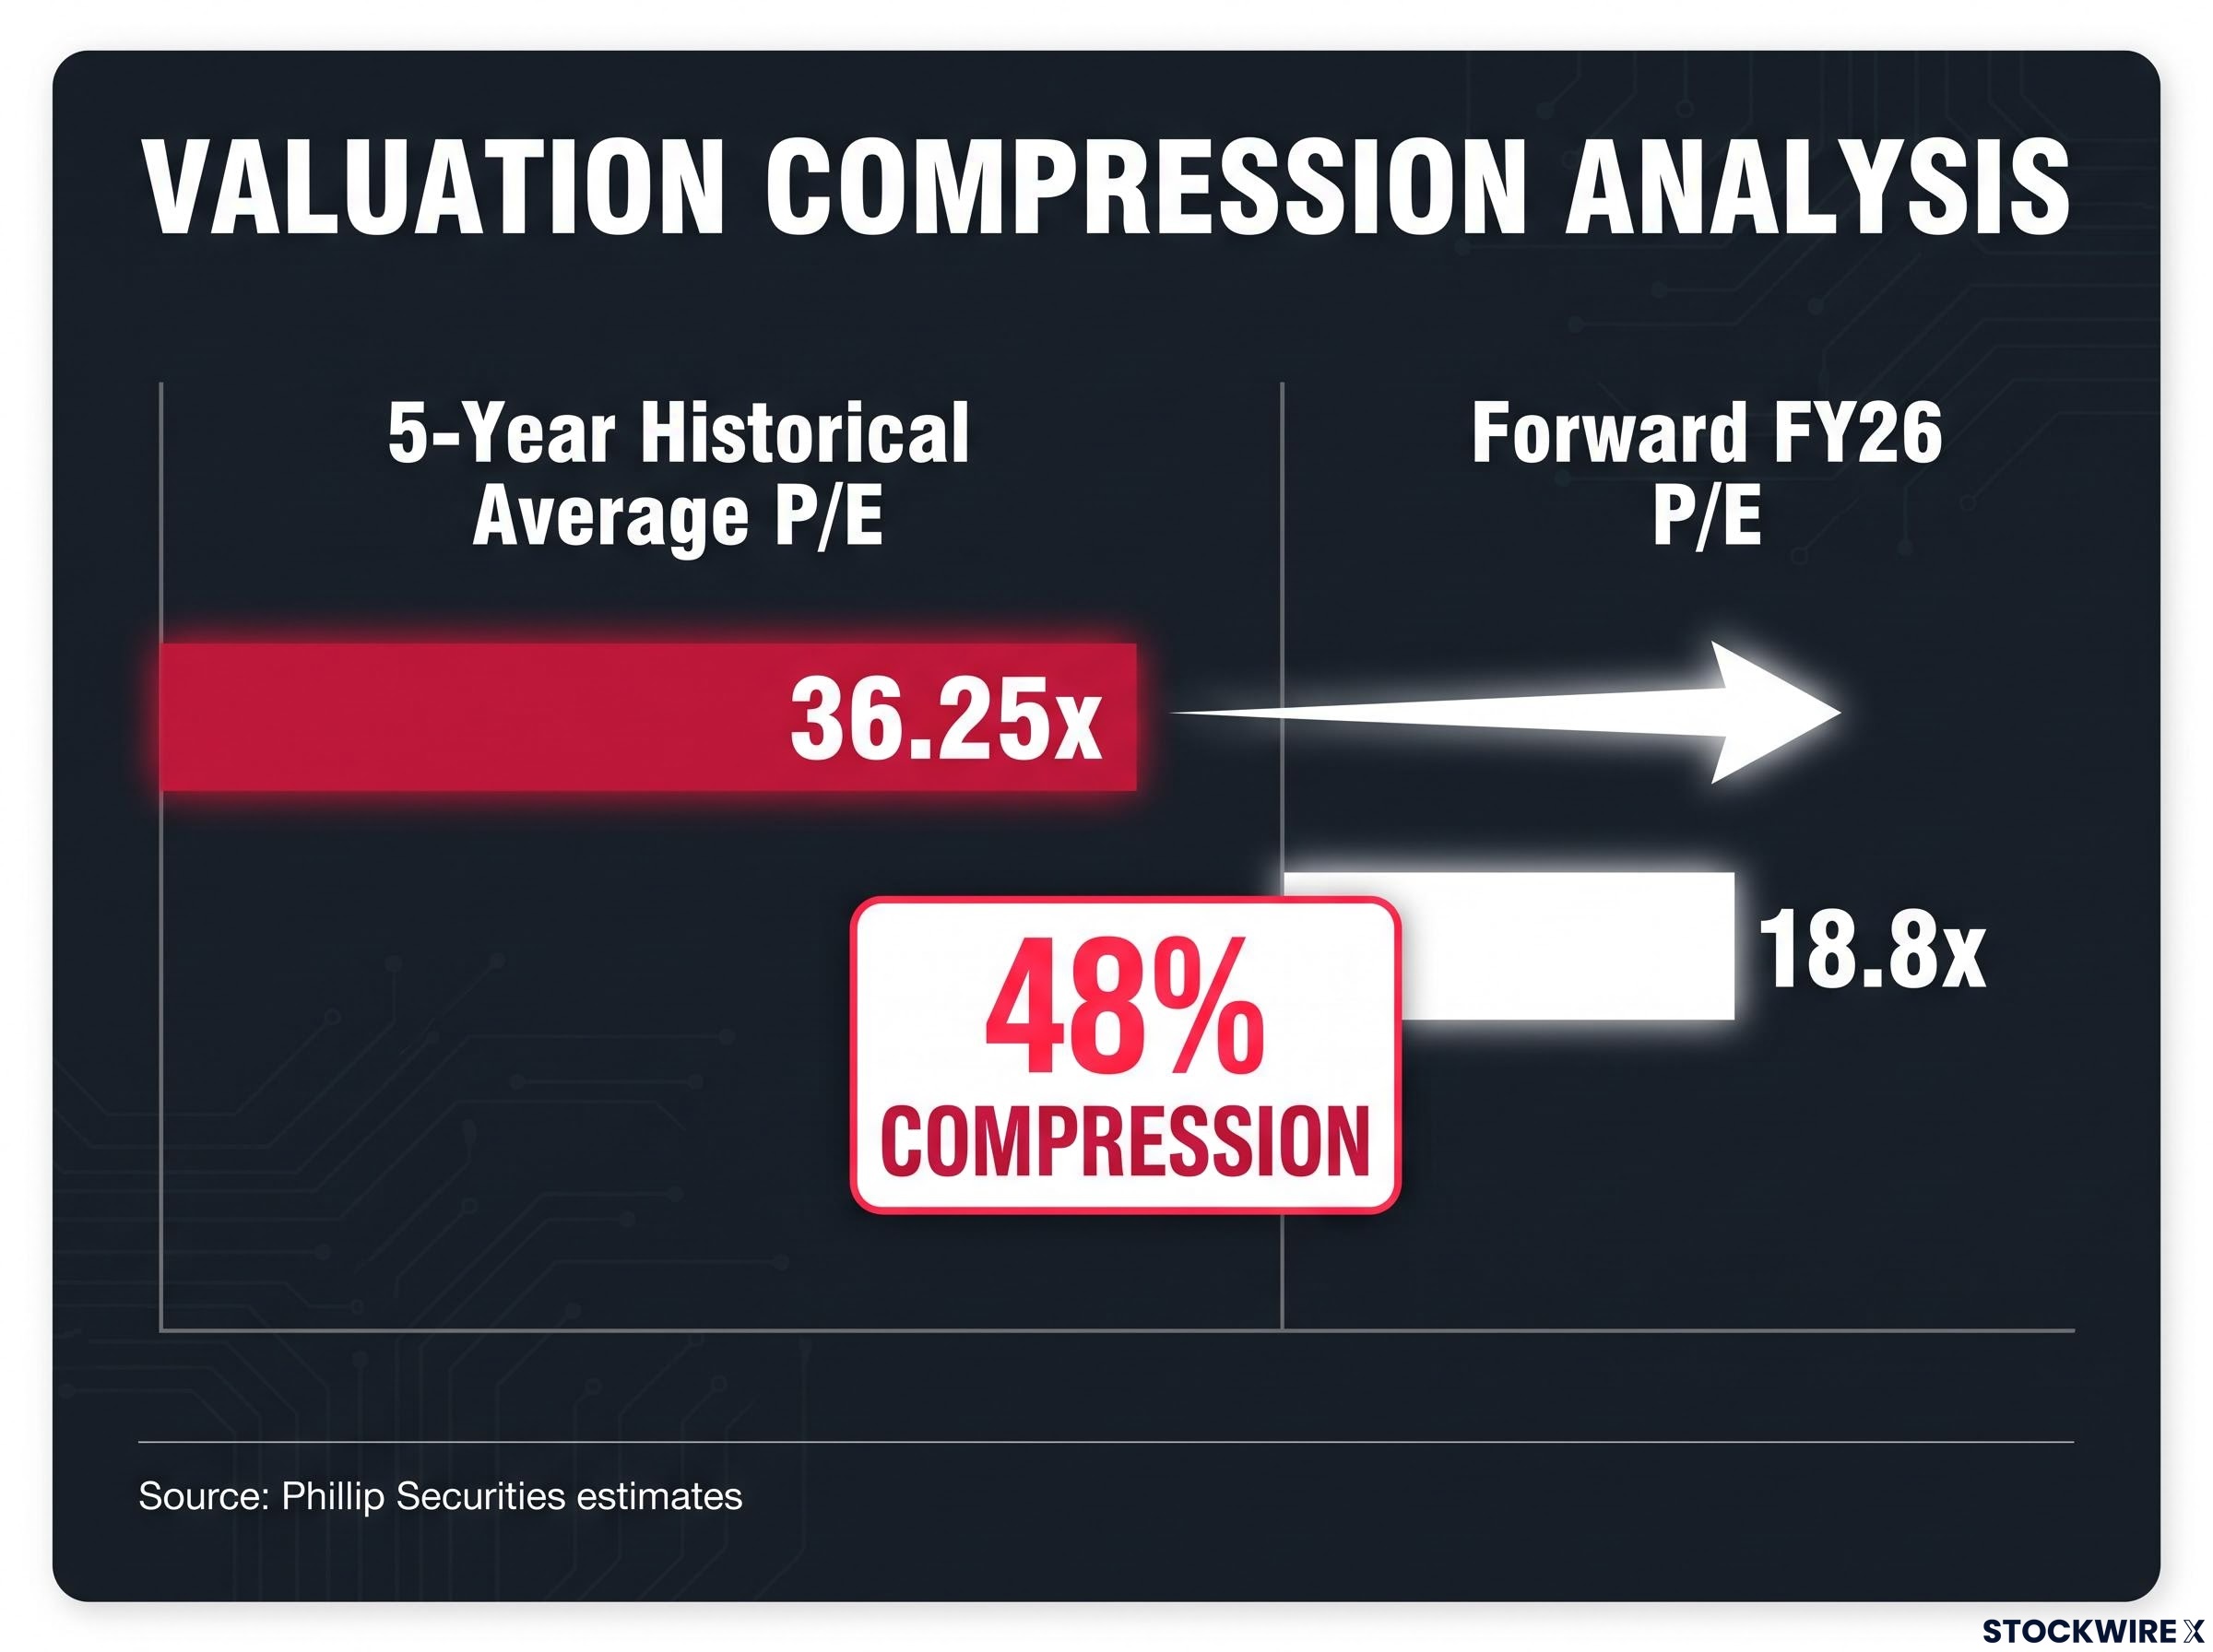
The data makes the case for the former. Phillip analyst Helena Wang flagged a specific and striking valuation dislocation: Netflix’s forward FY26 price-to-earnings (P/E) ratio of 18.8x sits nearly 48% below its five-year historical average of 36.25x. That compression has occurred not because the business deteriorated, but because near-term headwinds, a lighter content slate, softer guidance, and broad market risk-off sentiment, have weighed on investor confidence.
The gap between sentiment and fundamentals is the investment thesis. Here is the full case: the valuation mechanics, the business drivers still compounding in the background, the near-term headwinds creating the opportunity, and the risks that could make the bull case wrong. After reading, you will have a structured framework for deciding whether this entry point makes sense for your portfolio.
What the 18.8x forward P/E actually tells you
Start with the number that anchors the entire upgrade. Netflix’s forward FY26 P/E stands at 18.8x, according to Phillip Securities Research estimates. The five-year historical average is 36.25x. That is approximately 48% compression, the kind of gap that typically signals either genuine structural decline or a severe sentiment overshoot.
Bank of America offers a complementary lens. Its calculated PEG ratio (the P/E divided by the expected earnings growth rate) sits at 0.59. A PEG below 1.0 generally suggests a stock is trading at a low multiple relative to its near-term earnings growth. At 0.59, the market is pricing Netflix as though its growth profile has meaningfully weakened, which the revenue and engagement data do not yet support.
Not everyone agrees on the direction. Morningstar assigns a fair value of just US$80 and characterises the stock as moderately overvalued relative to its long-term discounted cash flow (DCF) assumptions, using a 2026 P/E assumption of approximately 25x.
Morningstar assigns a US$80 fair value and characterises the stock as moderately overvalued relative to its long-term DCF assumptions.
That dissent matters. It tells you the valuation argument is not unanimous; it depends on which growth and margin assumptions you believe. But across the broader sell-side, buy-rated analysts argue the 48% P/E compression relative to Netflix’s own history prices in sustained structural weakness that the underlying business metrics do not yet support. The question for you is whether that gap closes through earnings growth, multiple expansion, or both.
The 48% P/E compression encodes a specific market assumption that can be made explicit: the implied growth rate framework converts a share price into the minimum annual revenue growth Netflix must deliver for investors buying today to earn a target return, a figure that reframes the valuation question from ‘is this cheap’ to ‘what must be true for this price to be justified.’
A complementary valuation lens sits alongside the P/E and PEG frameworks: FCF yield and FCF multiple analysis places Netflix at approximately 3.9-4.0% FCF yield and a 23-27x FCF multiple at current prices, producing an indicative annualised return of roughly 9-14% in the base case before any multiple expansion.
| Firm | Rating | Price Target | Key Valuation Basis |
|---|---|---|---|
| Phillip Securities | BUY | US$110 | Forward FY26 P/E of 18.8x vs 36.25x historical average |
| Bank of America | Buy | US$105 | PEG ratio of 0.59; ad-tier growth as key driver |
| Morningstar | 2 Stars | US$80 | Conservative long-term DCF; 2026 P/E ~25x |
| Wedbush | Outperform | Not specified | Pricing resilience and ad-tier upside |
When big ASX news breaks, our subscribers know first
The business that supports the premium multiple history
A compressed valuation only matters if the business underneath still warrants a higher one. For Netflix, the engagement data provides the clearest starting point.
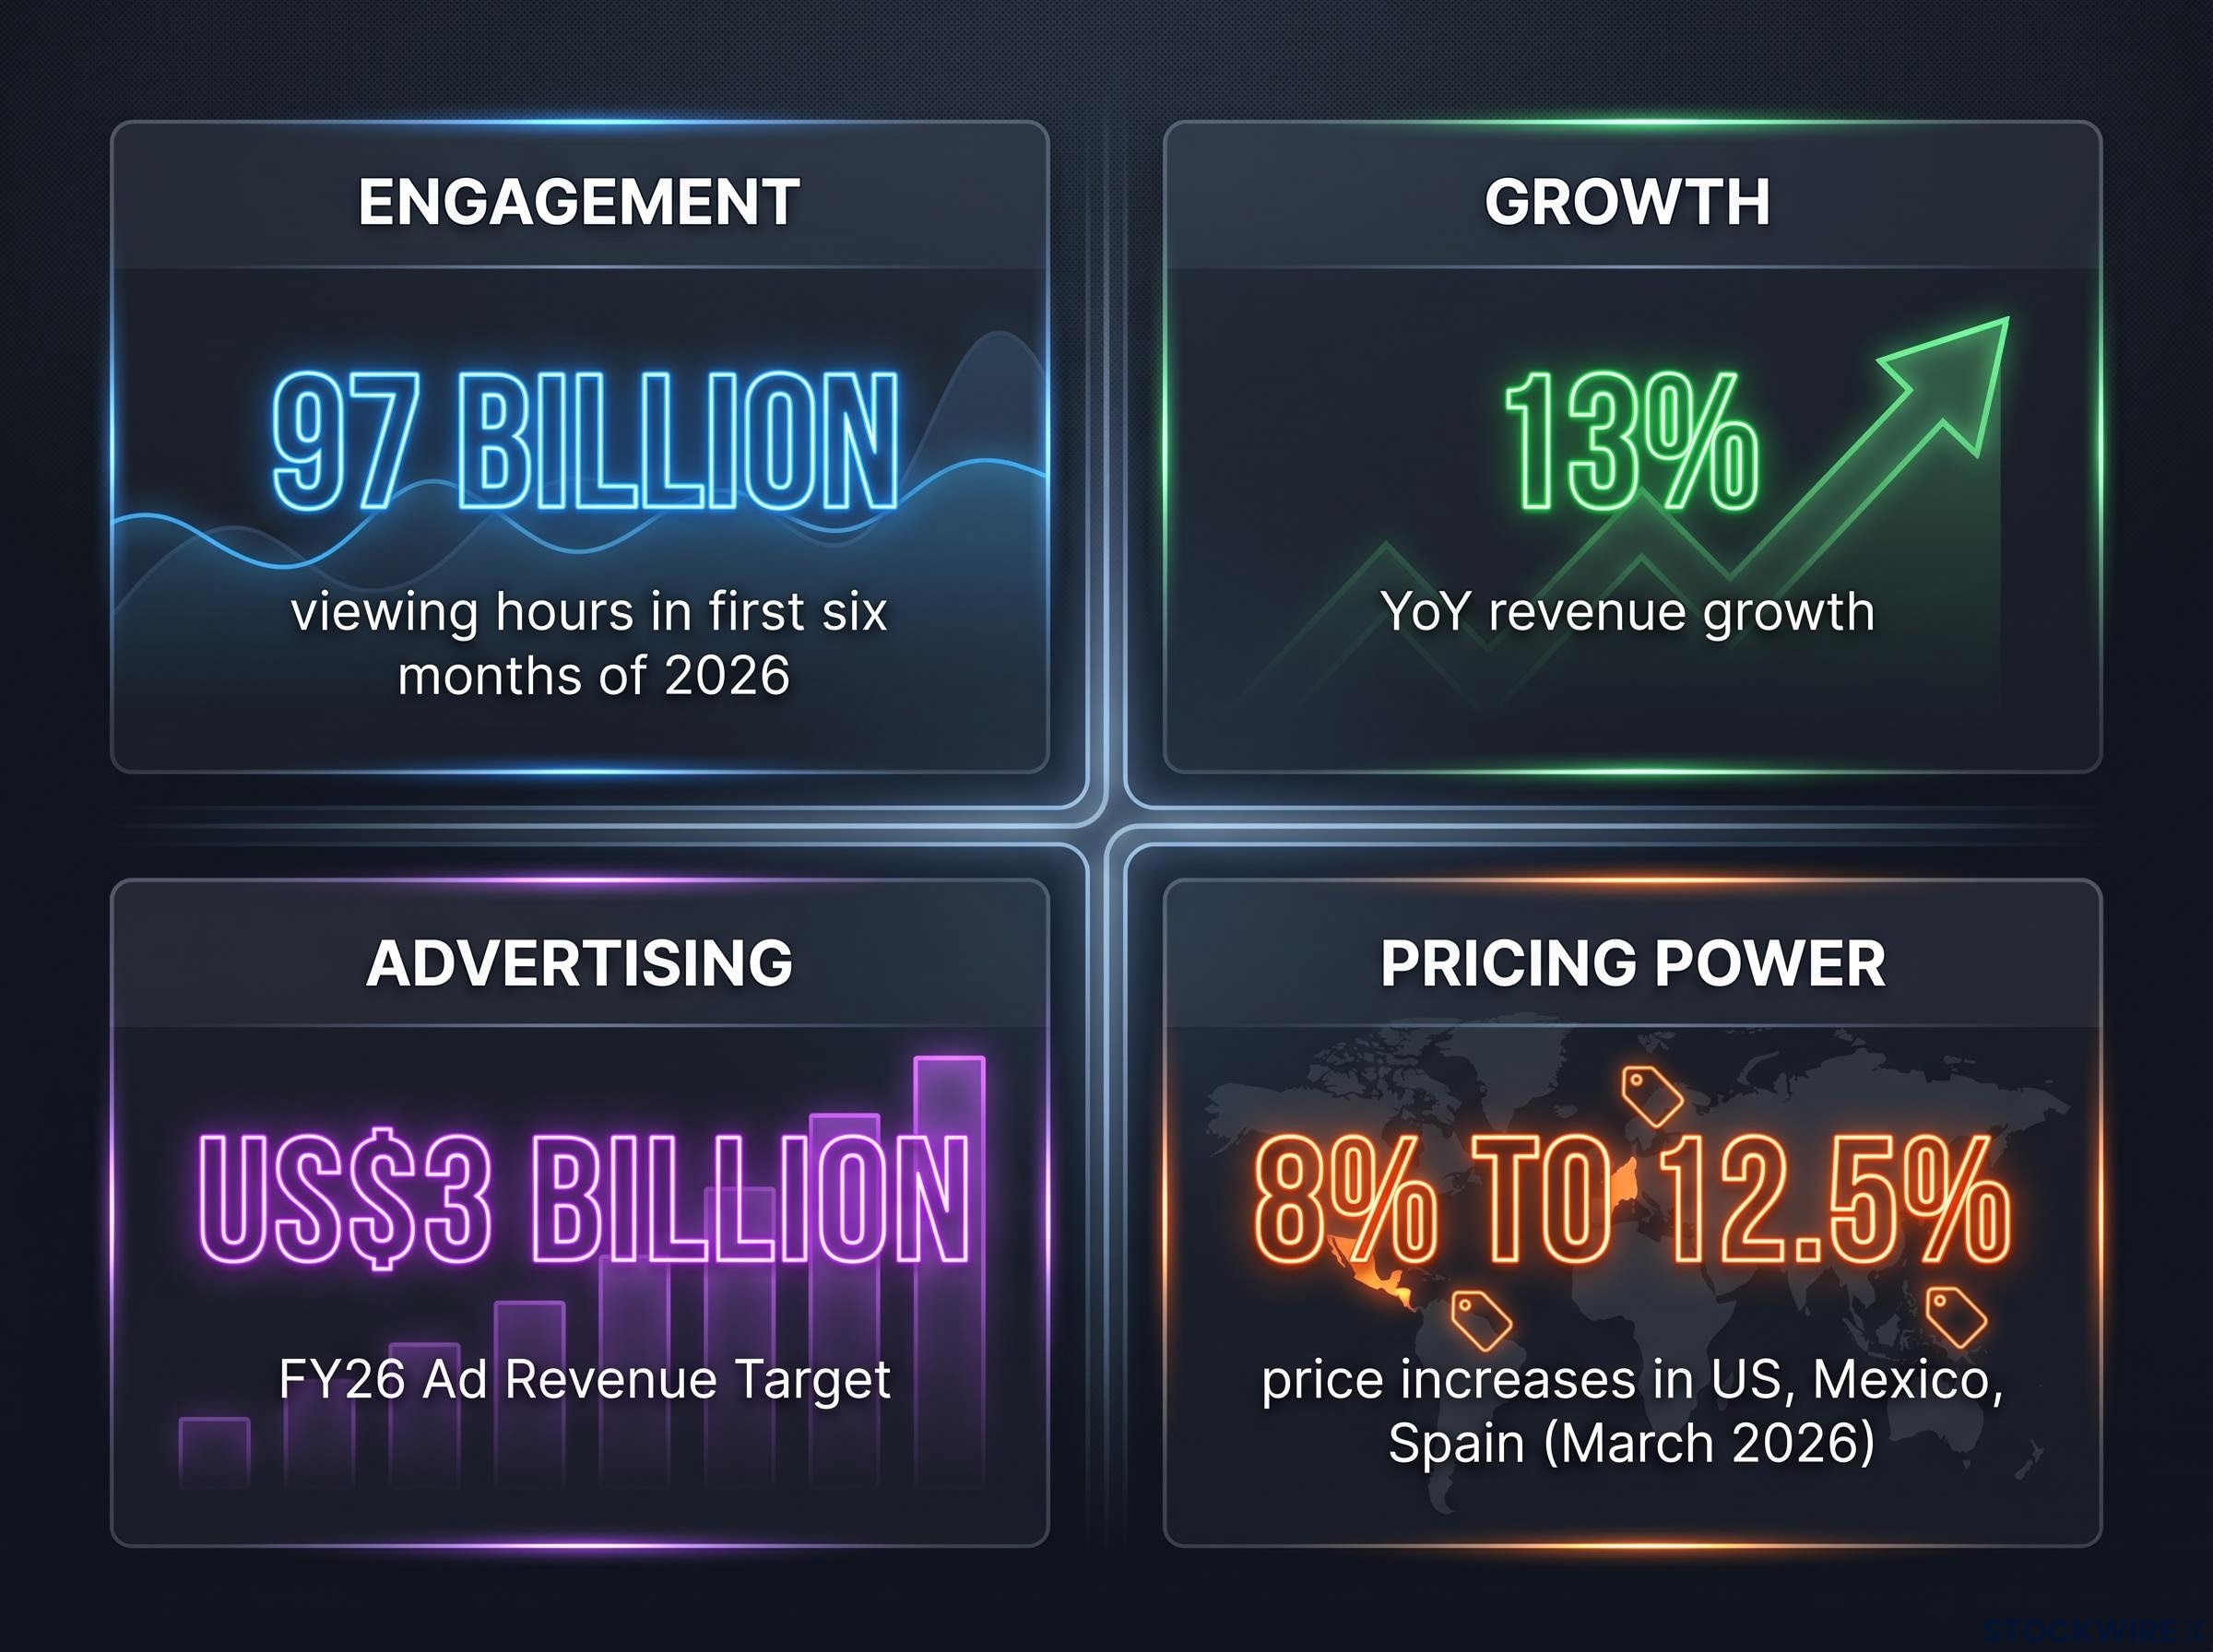
- The platform accumulated 97 billion viewing hours across the first six months of 2026, a 2% year-over-year increase that accelerated from the 1.5% growth recorded in the equivalent period of 2025
- That growth held despite direct competition from the Winter Olympics and FIFA World Cup, two of the most significant global viewing events of the year
- Year-over-year revenue growth across all regions came in at 13% for the most recently reported period, geographically diversified rather than dependent on any single market
What this tells you is that Netflix is not losing cultural relevance as it matures. That distinction matters enormously. Stable and improving engagement is the single most important precondition for sustaining pricing power and advertising value over time. A platform that people still watch 97 billion hours of content on in six months is a platform that can raise prices, sell advertising, and defend its position against rivals.
What the revenue mix shift signals
The 13% revenue growth is not coming from the same place it used to. Future growth is increasingly driven by average revenue per user (ARPU), which measures how much each subscriber generates, and advertising rather than raw subscriber additions. That shift toward a more monetisation-led model is structurally more defensible and margin-accretive than one that depends on adding new members in increasingly saturated markets.
Pricing power and the advertising engine: how Netflix is building a second revenue layer
If you still think of Netflix as a subscription-only business, the advertising numbers will reframe that assumption. Advertising revenue is projected to approximately double year-over-year in FY26, on track toward a US$3 billion target. That is not a marginal add-on. It is a genuine second revenue engine with multi-year compounding potential.
The foundation for that engine is pricing power, and the evidence for it is specific. Subscription tier price rises of 8% to 12.5% were rolled out across the United States, Mexico, and Spain in March 2026, and subsequent data shows no sign of elevated subscriber losses as a result. That is the primary empirical signal that Netflix possesses genuine pricing power, the ability to raise prices without losing subscribers.
Survey work suggests Netflix is resilient to price increases, and ad-tier growth should create significant upside later in the year. — Alicia Reese, Wedbush
The ad-supported tier plays a dual role that makes the entire pricing structure more flexible. Here is what makes it strategically valuable:
- Subscriber retention path: Price-sensitive users can downgrade to the ad tier rather than cancelling, keeping them within the ecosystem
- CPM-based revenue: Cost per thousand impressions (CPM) generates advertising income independent of subscription price, creating a second monetisation stream
- Improving revenue per user: As targeting capabilities scale, revenue per ad-tier subscriber can rise even if subscription prices stay flat
The combination of proven pricing power and a scaling ad business means Netflix can grow total revenue even in markets where subscriber growth is approaching saturation. That directly addresses the most common bearish concern about the platform’s long-term ceiling.
Why the stock is down 27% and what that actually means
A 27% year-to-date decline to approximately US$68-69 demands an honest accounting of what went wrong. The headwinds are real and specific:
The forces behind the drawdown are layered: four distinct forces have driven the repricing, including subscriber deceleration, governance uncertainty from Hastings’ board exit, a failed M&A pursuit of Warner Bros. Discovery, and sector rotation away from steady compounders toward AI-linked names.
- Q3 2026 revenue guidance of 12% year-over-year growth, which came in below the rate delivered in recent preceding quarters
- A weaker content calendar relative to 2025, which had blockbuster tentpoles in Stranger Things, Wednesday, and Squid Game driving outsized viewer numbers
- Reed Hastings’ departure from the board, which Wedbush commentary cites as a sentiment factor
- Broad macro risk-off environment weighing on growth-oriented names across the market
- An absence of new platform initiatives from management (for example, a free ad-supported streaming service), which left investors without fresh near-term growth catalysts
That is a meaningful list. Each item individually creates selling pressure. Together, they explain why shares recently approached the 52-week low of US$65.08.
How analysts separate the signal from the noise
The question that matters is whether these headwinds represent structural deterioration or timing and sentiment factors. Buy-rated analysts are firmly in the latter camp.
A lighter content slate is cyclical, not permanent. Softer guidance reflects management conservatism in a cautious macro environment, not collapsing demand. Hastings’ board exit is a governance headline, not a change to the platform’s competitive position. And the absence of new catalysts is a gap, not a verdict.
A 27% drawdown driven by a lighter content schedule and cautious guidance is a very different kind of risk from one driven by churn acceleration or margin deterioration. That distinction matters enormously for how you should weight the buy case. The drawdown has compressed the valuation; it has not, based on the available data, broken the business model.
The risks that could make the bull case wrong
A buy thesis without an articulated failure condition is not an investment case. Here are the four specific risk categories worth tracking:
- Churn response to price hikes: If Q3-Q4 2026 data reveal sustained churn spikes in the US, Mexico, or Spain, the pricing-power thesis that underpins most of the bull case will need revisiting. That single data point is worth watching more closely than any quarterly earnings headline.
- Advertising ramp execution: A slower-than-expected ad revenue trajectory, weaker CPMs, or measurement and brand-safety issues could challenge forecasts assuming ad revenue reaches US$3 billion in FY26.
- Content ROI and cost discipline: Netflix plans to increase content investment by 10% year-over-year. If that spending does not deliver proportionate engagement returns, it would pressure margins and validate more conservative valuations like Morningstar’s.
- Competitive pressure: If rival platforms close the content gap, or if streaming growth plateaus in key regions, sustaining double-digit revenue growth purely through pricing and advertising becomes harder.
Each of these risks is not hypothetical. They are trackable quarter by quarter. The metrics to monitor:
- Subscriber, ARPU, and ad revenue trends versus guidance
- Operating margin progression and content amortisation commentary
- Churn data specifically in price-increased markets
- Any new platform initiatives (live offerings, games, partnerships) that could add growth catalysts
The drawdown is characterised by buy-rated analysts as a valuation-driven opportunity, not a fundamental warning signal. That distinction depends on upcoming churn and ad ramp data.
This article is for informational purposes only and should not be considered financial advice. Investors should conduct their own research and consult with financial professionals before making investment decisions.
What this entry point demands of you as an investor
Here is the bull case in one paragraph. Phillip’s upgrade to BUY at US$110 reflects a platform with durable engagement (97 billion viewing hours in the first half), proven pricing power (8-12.5% increases without meaningful churn), a scaling second revenue engine (ad revenue on track to double), and a valuation compressed to multi-year lows by sentiment and timing factors rather than structural damage. At approximately US$68-69, that target implies roughly 60% upside.
The broader consensus corroborates the direction. The average 12-month price target across approximately 33-51 analysts sits at roughly US$95-100, with a range spanning US$70 on the low end to US$135 and above on the high end.
But 60% implied upside only becomes a compelling entry point if specific conditions hold. Here are the three that matter most:
- Pricing resilience confirmed: Q3-Q4 churn data in price-increased markets must remain stable
- Ad revenue trajectory sustained: FY26 advertising revenue must track toward the US$3 billion target without meaningful deceleration
- Margin discipline maintained: The 10% content spend increase must deliver proportionate engagement returns without compressing operating margins
The current price embeds more pessimism about Netflix’s long-term structural advantages than the data on engagement, pricing power, ad ramp, and content strength actually justify.
This is a multi-year case resting on ad revenue compounding and margin expansion, not a short-term catalyst trade. The decision question is specific: does your investment horizon, risk tolerance, and confidence in the advertising ramp and pricing resilience data support acting on this entry point? The data gives you a framework. The judgement remains yours.
Past performance does not guarantee future results. Financial projections are subject to market conditions and various risk factors. These statements are speculative and subject to change based on market developments and company performance.