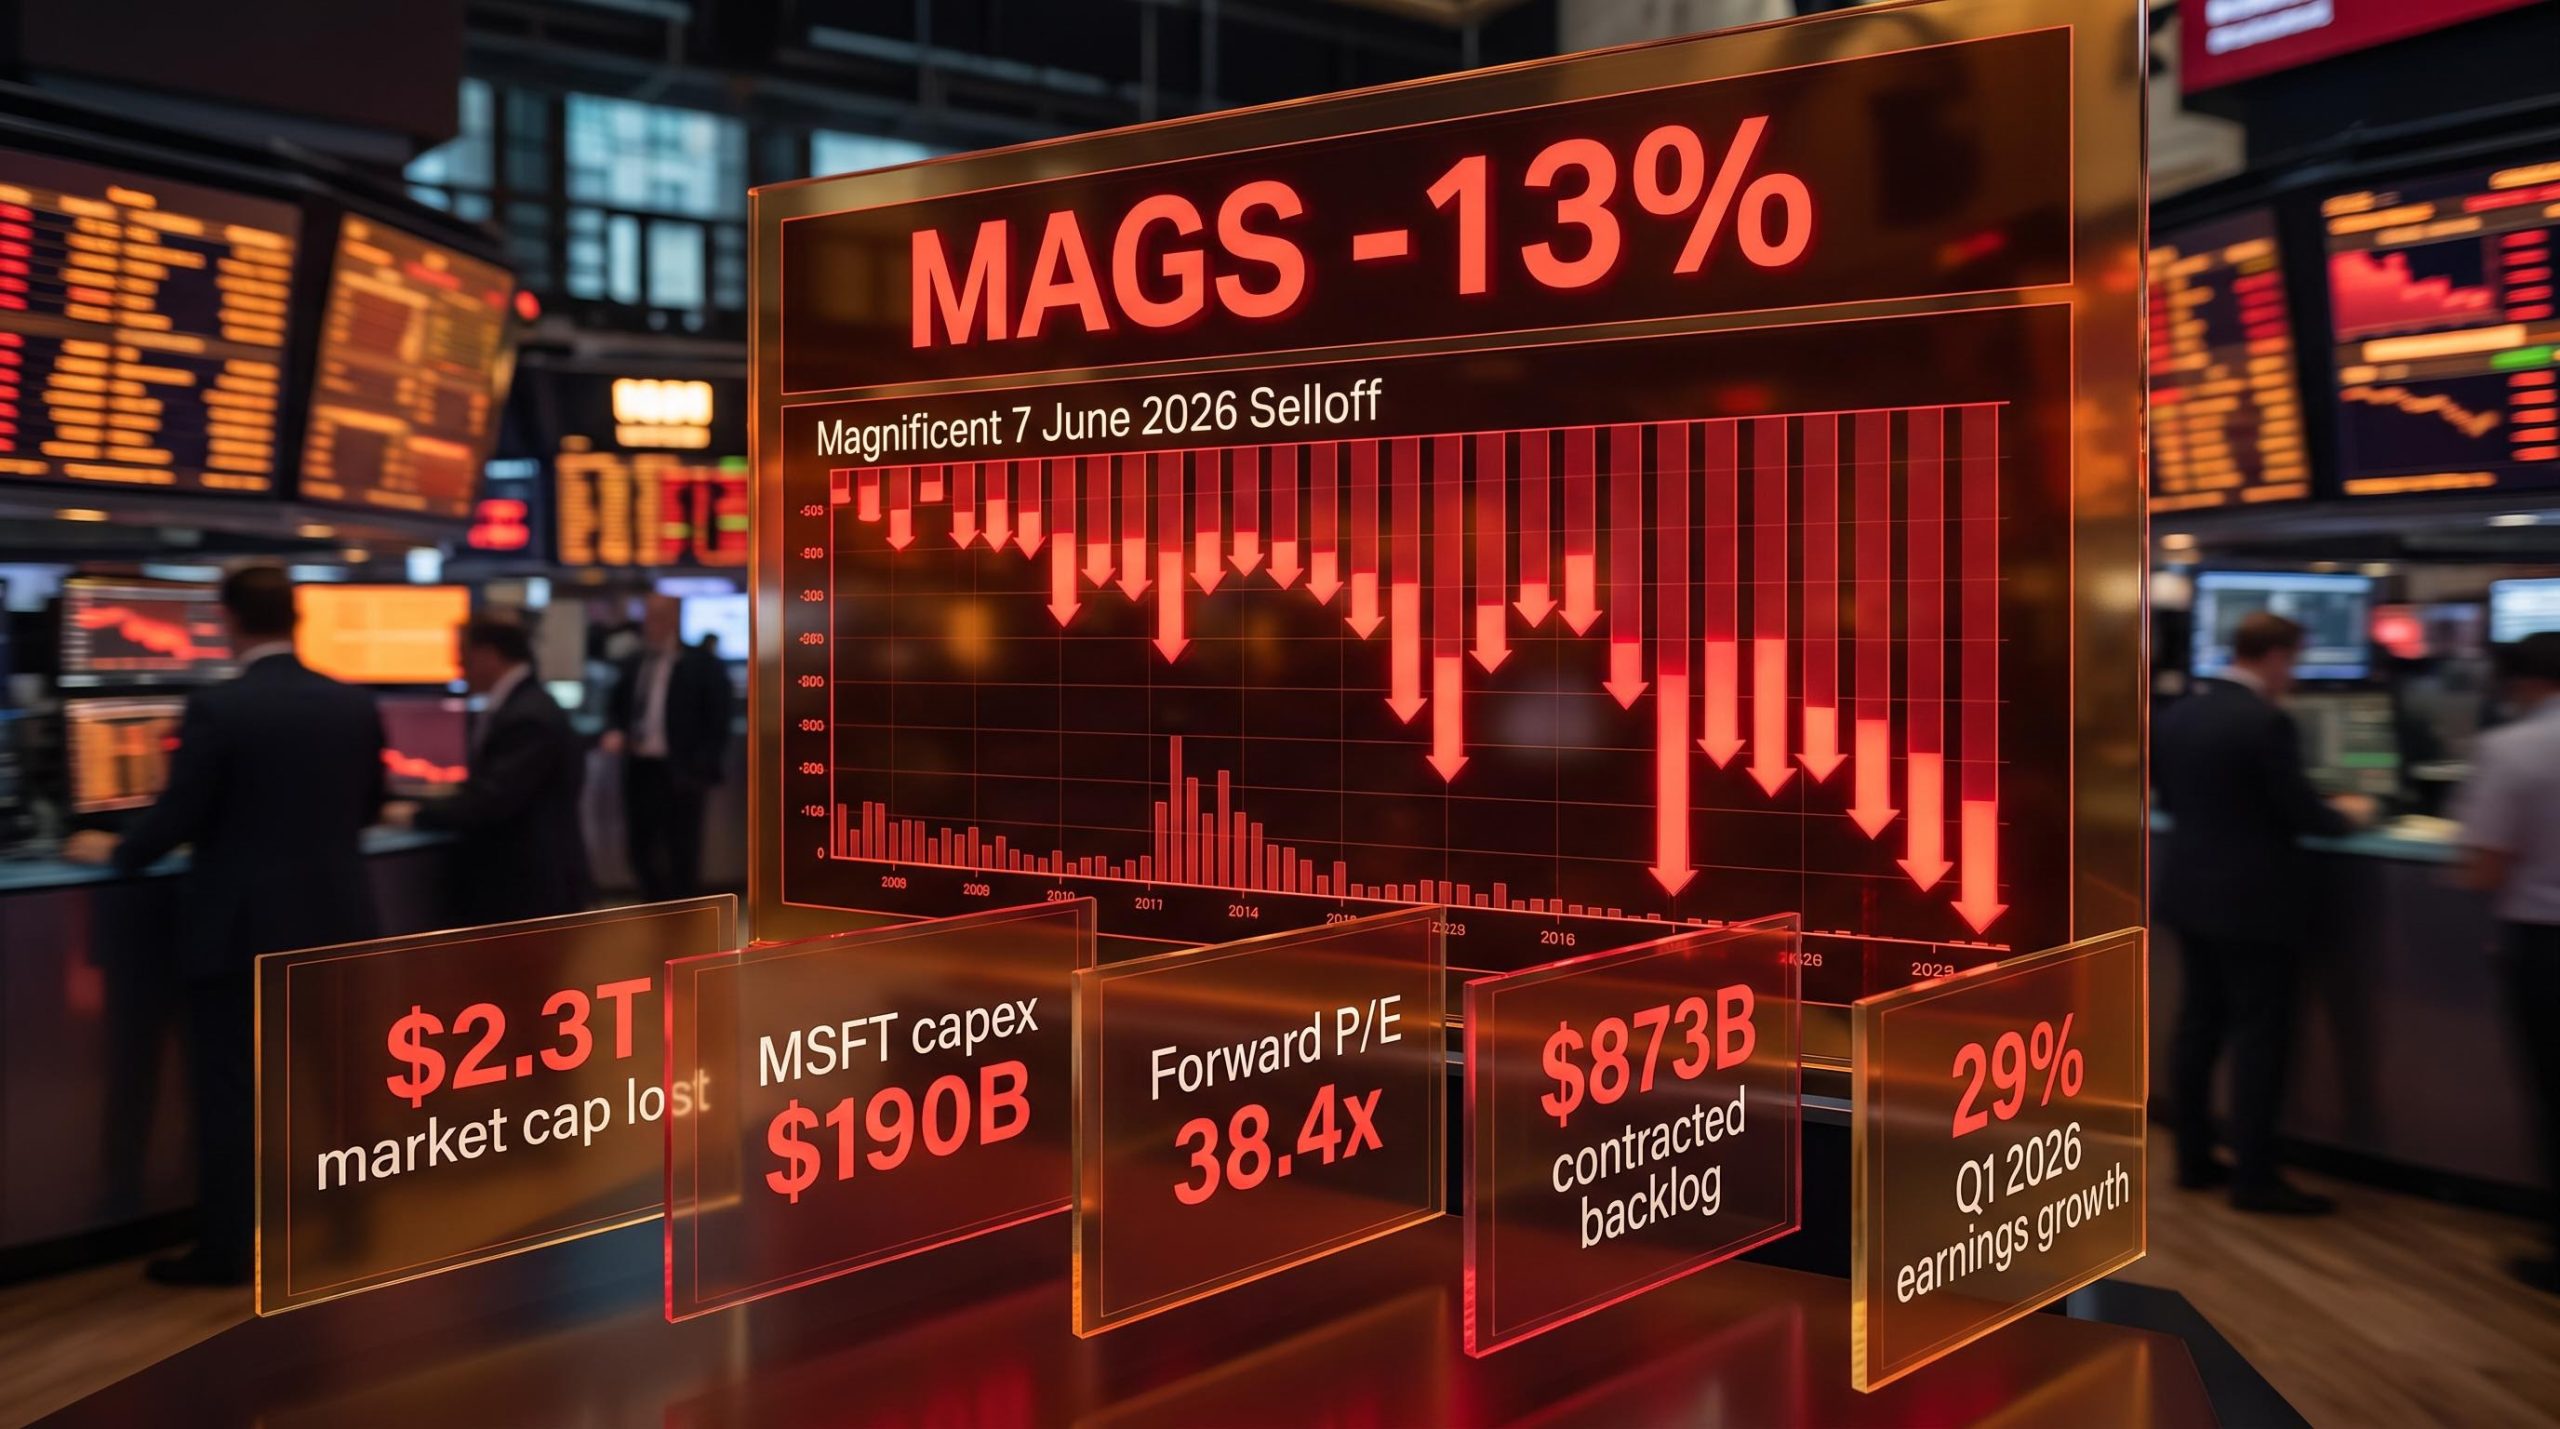
The Magnificent 7 lost approximately $2.3 trillion in market capitalisation during June 2026. The S&P 500 fell just 1.1% over the same period. That gap, between a group of seven stocks and the entire index they dominate, is not a rounding error. It is a signal that something structural shifted in how the market values these companies.
The divergence was not a generalised risk-off move. It was a specific repricing of the Magnificent 7’s identity: whether these businesses are asset-light platforms generating enormous free cash flow, or capital-intensive infrastructure builders burning through it. The Roundhill Magnificent Seven ETF (MAGS) fell nearly 13% in June, amplifying the concentration effect. The causes are diagnosable, the bear case is substantive, and the bull case rests on data that deserves more scrutiny than most headlines have given it.
After working through the triggers, the demand picture, and the valuation arithmetic, you will have a structured basis for deciding whether this decline belongs in your portfolio decision or not, and which variables to watch before you act.
What actually triggered a $2.3 trillion wipeout in one month
The selloff did not arrive as a single headline. It compounded across three distinct pressure points in rapid succession, each one amplifying the last.
The capex shock
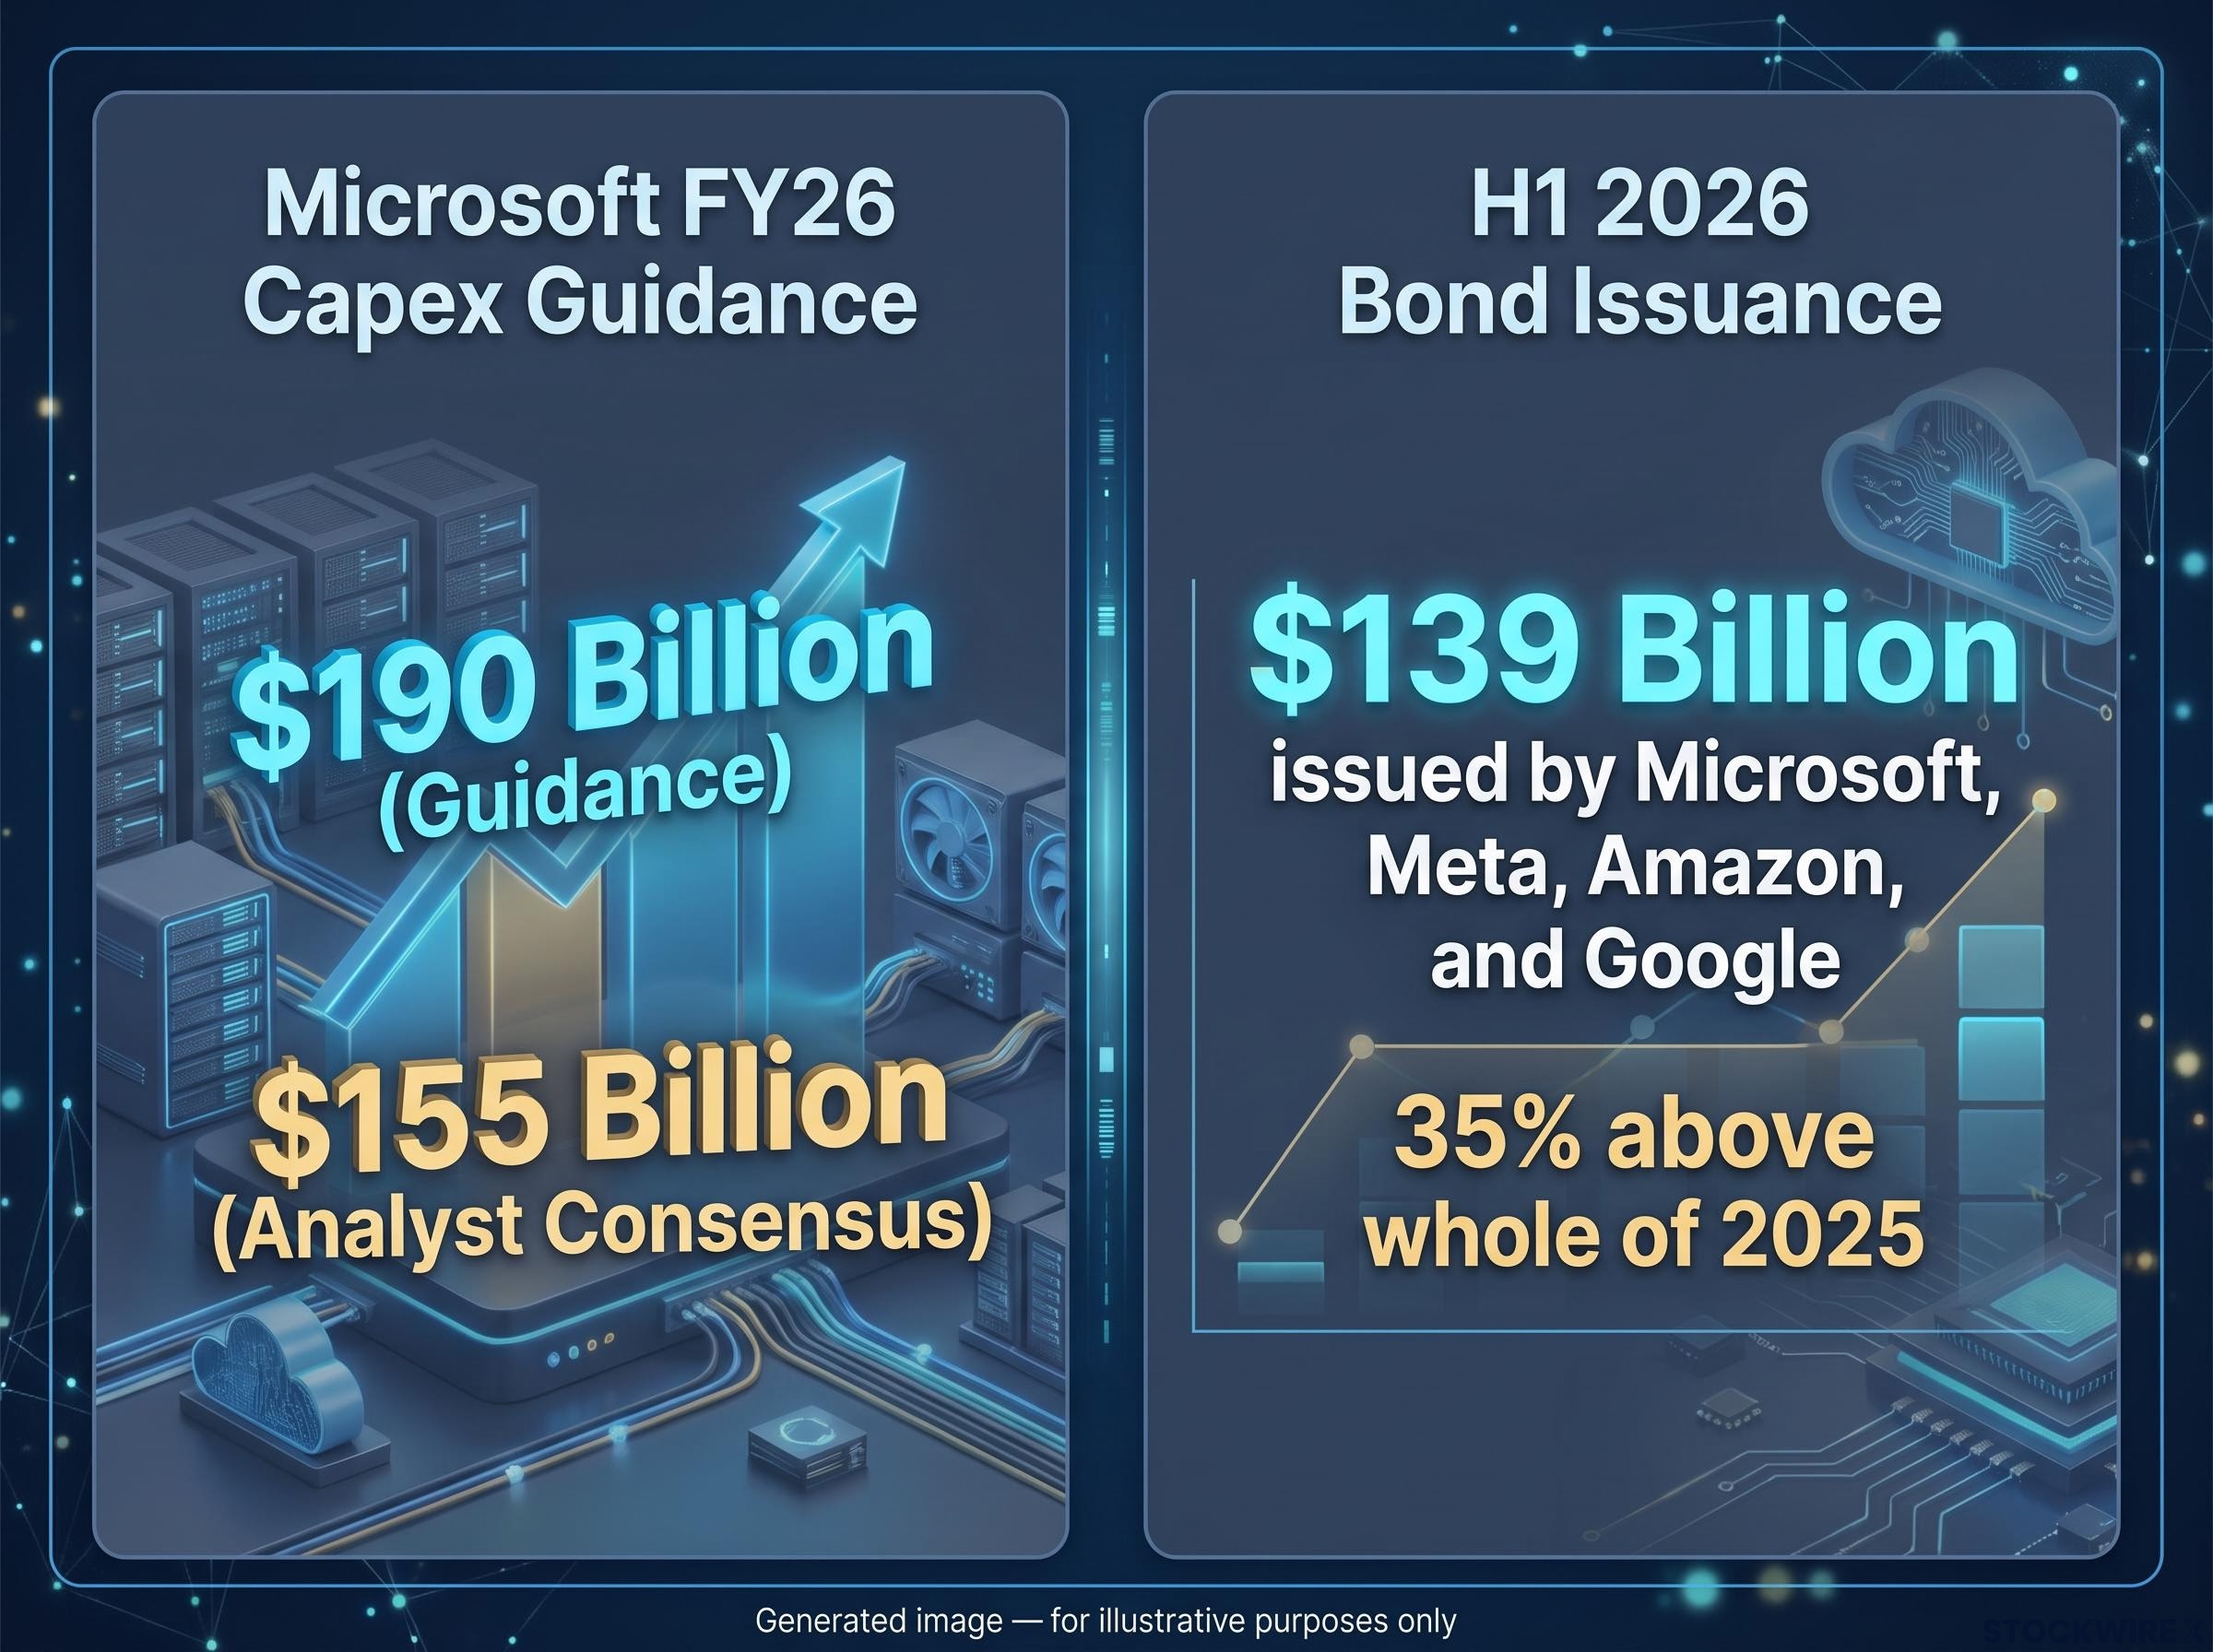
The primary trigger was Microsoft’s fiscal year 2026 capital expenditure guidance of $190 billion, which came in roughly 23% above the analyst consensus figure of $155 billion, forcing investors to reconsider the valuation basis for the entire hyperscaler group. That gap forced a re-rating not just of Microsoft but of the entire hyperscaler group, because it confirmed what investors had been suspecting: these companies are spending at a scale that no longer fits the “asset-light platform” valuation framework that justified premium multiples for the past decade.
The hyperscaler capex trajectory heading into June was already signalling a structural shift: Amazon, Microsoft, Alphabet, and Meta collectively spent $130 billion in Q1 2026 alone, with full-year 2026 guidance reaching approximately $725 billion and a $1 trillion annual run rate projected for 2027, numbers that reframe Microsoft’s $190 billion guidance not as an outlier but as confirmation of a sector-wide commitment.
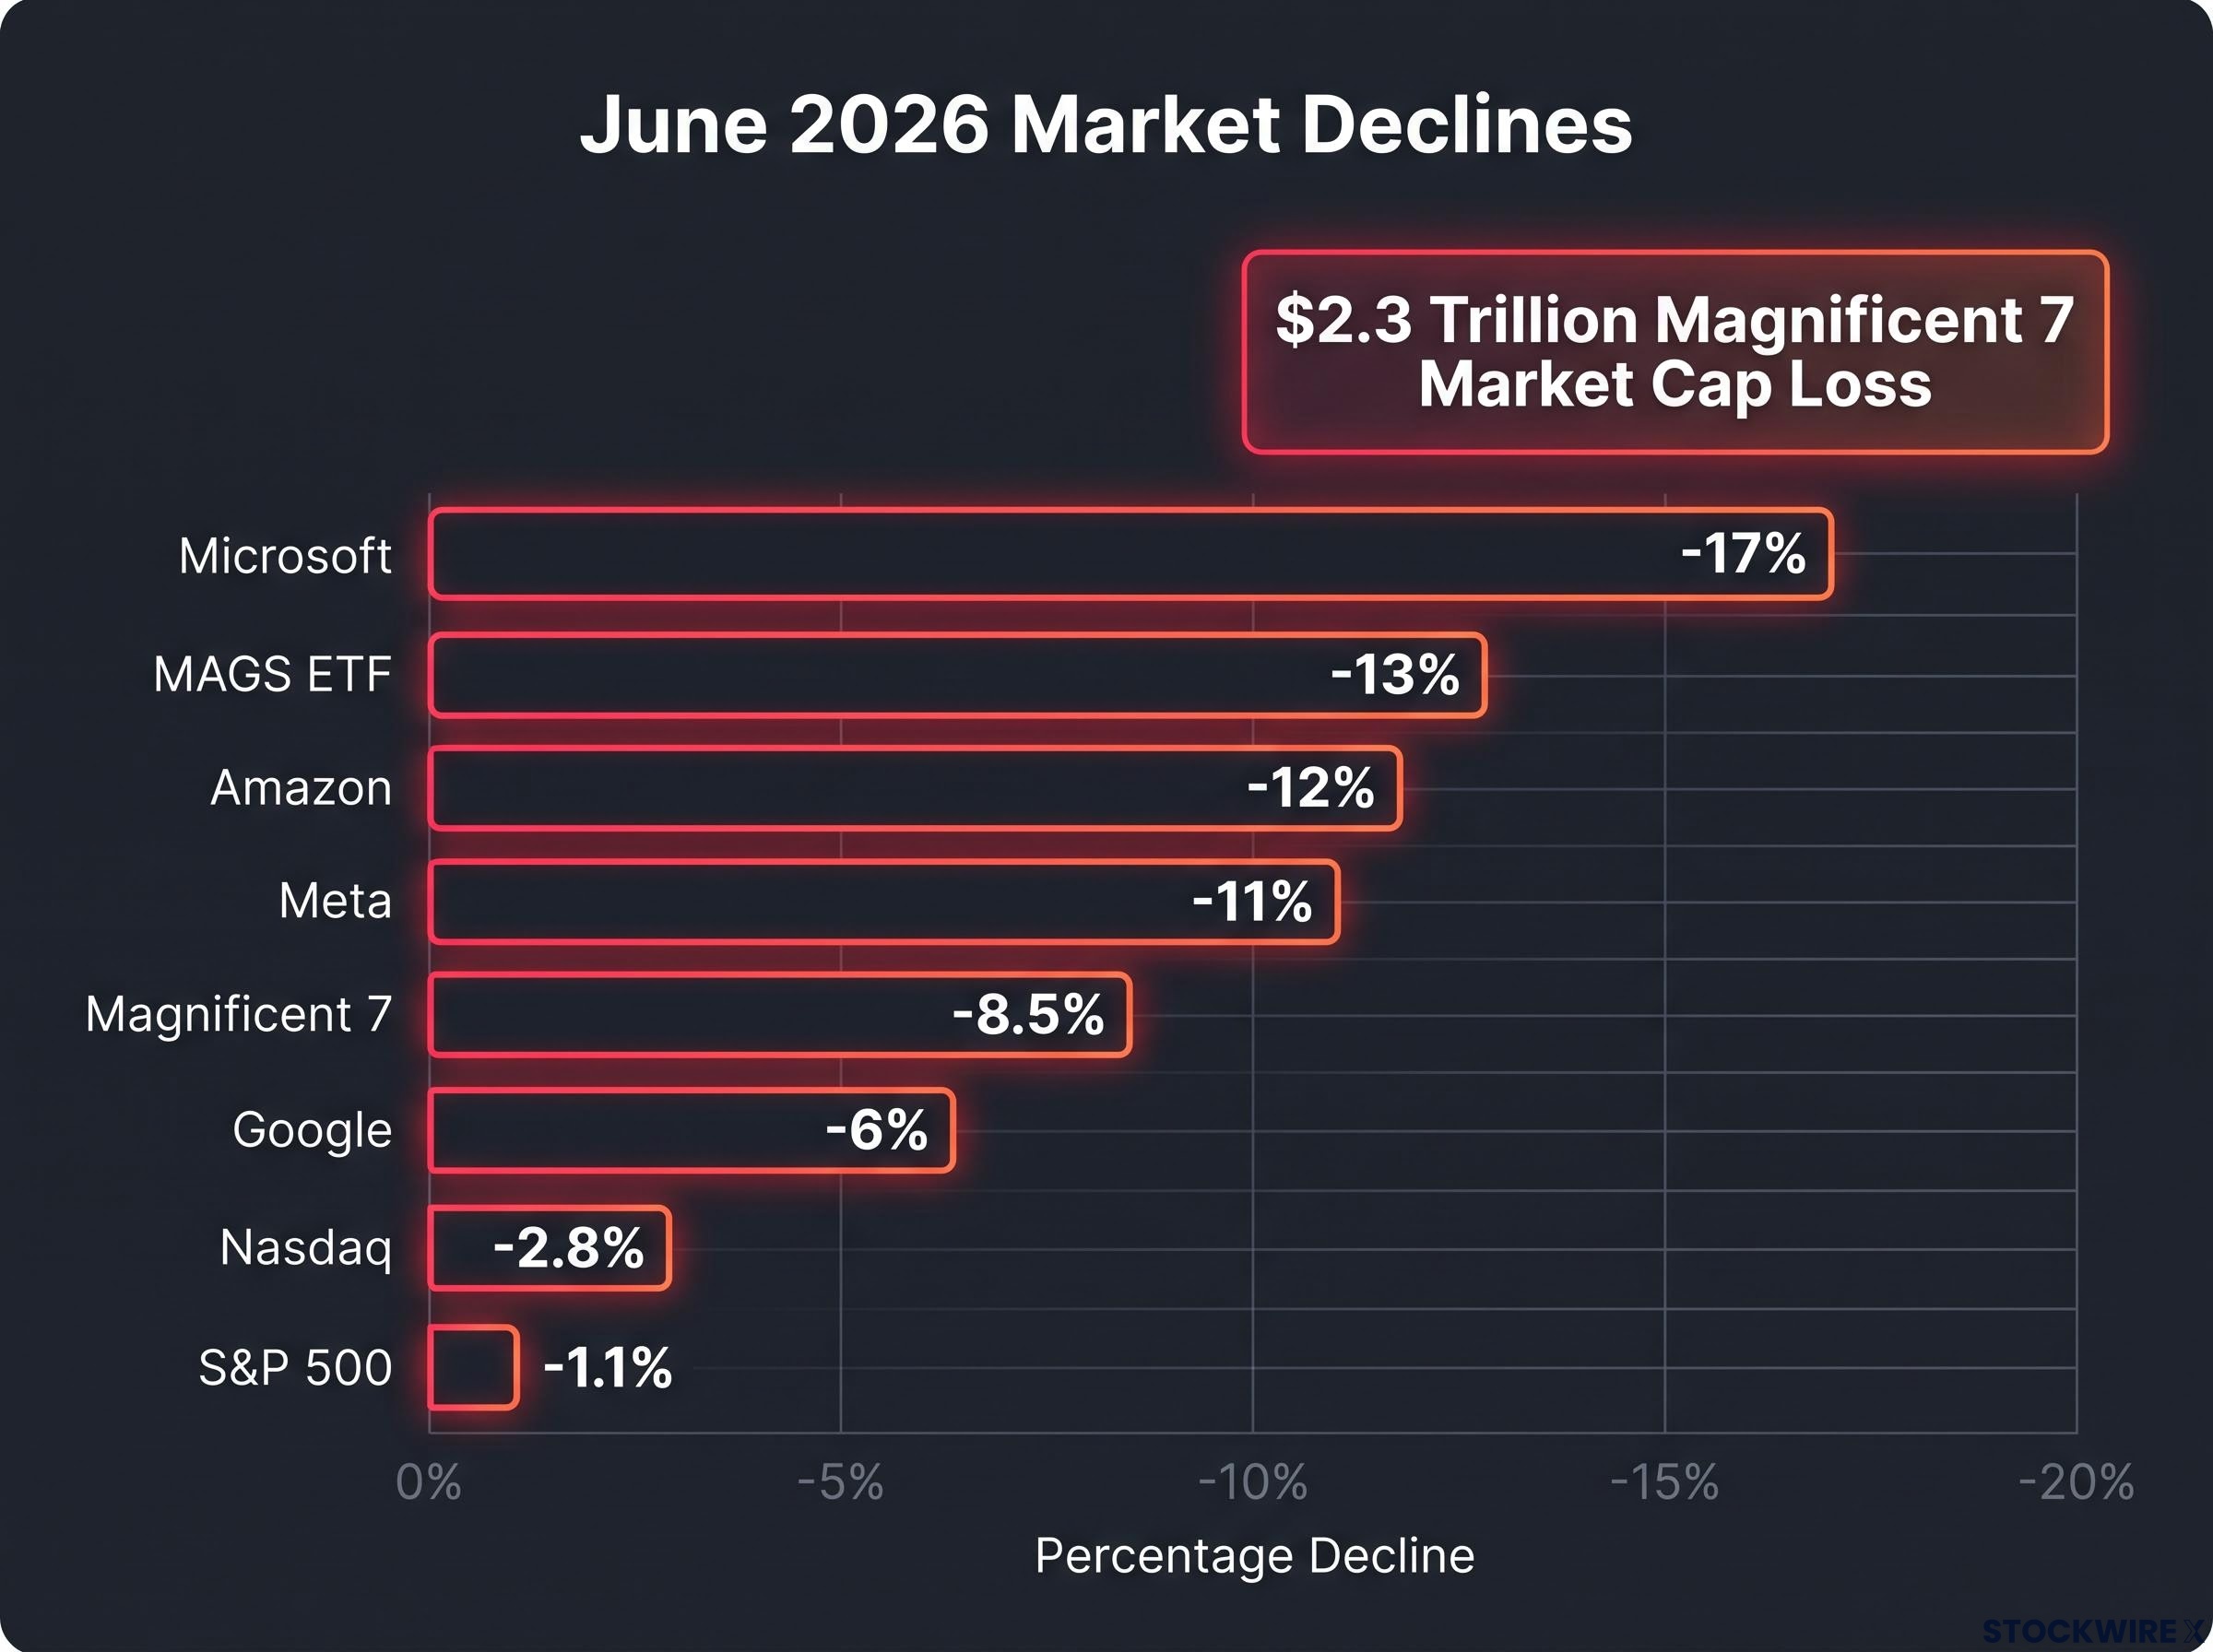
The individual June declines were severe:
- Microsoft fell 17%
- Amazon dropped 12%
- Meta declined 11%
- Google retreated 6%
As a group, the Magnificent 7 shed 8.5% across the month, while the broader S&P 500 slipped only 1.1% and the Nasdaq gave back 2.8%. MAGS amplified the damage at nearly 13%.
Debt escalation and rate uncertainty
Then came the second-order amplifier. Bond market activity from the four major hyperscalers, Microsoft, Meta, Amazon, and Google, totalled approximately $139 billion in the first half of 2026, running 35% above their combined issuance for the whole of 2025. These were companies that investors had long treated as self-funding cash machines. The bond issuance changed that calculus.
Fundstrat’s Tom Lee framed the shift directly: these companies are now “more balance-sheet intensive,” effectively replacing human labour with AI infrastructure and turning the balance sheet into a form of workforce investment.
Layered on top was the naming of Kevin Warsh as Federal Reserve Chair in May 2026, a development that prompted widespread speculation in markets about where interest rates were heading next. For long-duration growth stocks already trading at high forward multiples, any hint of a more hawkish Fed adds a meaningful discount-rate risk premium. The convergence of a capex shock, a debt escalation, and a hawkish rate signal in the same month tells you June’s selloff was not a sentiment blip but a genuine narrative repricing, one that will not reverse on a single positive catalyst.
When big ASX news breaks, our subscribers know first
Why the AI boom is intact even though the Magnificent 7 is not
Here is the distinction that matters most: the market repriced who captures AI economics, not whether AI generates economics. During the same month the Magnificent 7 fell, chipmakers and memory suppliers tied to AI demand posted strong results. HSBC noted that Micron’s earnings “pour cold water” on scepticism about the AI backdrop.
The hardware and software divergence playing out within the AI trade quantifies the rotation precisely: the Morningstar Global Semiconductor Equipment index gained 47.6% year-to-date in 2026 while the Software Applications index fell 22.7%, a spread exceeding 70 percentage points that confirms capital moved within technology rather than out of it during the same period the Magnificent 7 repriced.
The demand data reinforces the point. Across Q1 2026, the combined order backlog for Microsoft, Google, and Amazon expanded 46% year-on-year to reach $873 billion, with the $580 billion in Anthropic and OpenAI partnership commitments excluded on account of their long duration and associated counterparty risk.
The $873 billion organic backlog represents firm contracted demand rather than speculative projections, with the majority of that pipeline expected to convert into recognised revenue within a two-year window.
| Company | Q1 2026 backlog contribution | Capacity constraint signal |
|---|---|---|
| Microsoft | Part of combined $873B | Supply-side limits on AI infrastructure expected to remain in place throughout 2026 |
| Part of combined $873B | Cloud revenue fell short of potential due to capacity falling behind enterprise demand | |
| Amazon | Part of combined $873B | Demand for Trainium AI chips has reached near-full subscription levels |
The Magnificent 7 also delivered approximately 29% earnings growth in Q1 2026. These are not companies whose businesses have broken. A $873 billion contracted backlog converting within approximately two years is revenue that belongs in near-term earnings models, not speculative long-dated narratives. That means current forward price-to-earnings (P/E) figures, the ratio of share price to expected earnings per share, may overstate true valuation once updated estimates absorb this pipeline. What this tells you is that the selloff is about the market’s discomfort with how the Magnificent 7 are financing the build-out, not about whether the build-out is economically rational.
What the bear case gets right about the selloff
It would be a mistake to dismiss the concerns. The bear case carries genuine weight across three distinct risk categories:
- Valuation risk: By the close of June 2026, the forward P/E had compressed to approximately 38.4x, down from roughly 39.7x at the end of May 2026. That makes the stocks mathematically cheaper, not cheap. A forward multiple in the high 30s with rising leverage and macro uncertainty overhead leaves a thin margin for error on AI execution.
- Leverage risk: The $139 billion in H1 2026 bond issuance, combined with Meta’s reported exploration of equity capital raises, signals that AI infrastructure costs may be outpacing internal cash generation. Investors who previously held these names as low-leverage quality compounders must now underwrite multi-year execution risk on AI projects funded partly by debt.
- Macro and rate risk: Rate uncertainty under new Fed leadership, persistent inflation concerns, and geopolitical tensions create a backdrop that penalises long-duration growth stories, particularly those requiring massive upfront capital expenditure.
The historical parallel is instructive. Past tech investment waves, specifically fibre optic infrastructure in the dot-com era and early cloud data centres, overbuilt capacity and produced years of depressed returns. The question today is structurally analogous: are hyperscalers building faster than profitable workloads can materialise?
Approximately $2.3 trillion in market capitalisation evaporated in June alone. A price decline is not the same thing as a margin of safety, particularly when the underlying multiple remains elevated and the business model is mid-transition. If you are evaluating an entry here, you are accepting that risk explicitly rather than buying a discount.
Forced selling dynamics add a mechanical amplifier to the valuation concerns: Citi strategist David Chew identified on 30 June 2026 that approximately 80% of Nasdaq-100 long positions are now loss-making, a structural shift that transforms crowded bulls into potential sellers and makes any further multiple compression self-reinforcing through margin calls, VaR-triggered institutional reductions, and investor redemptions.
Understanding the Magnificent 7 as infrastructure, not platforms
The most practical thing this analysis offers is a mental model correction. For the past decade, investors valued the Magnificent 7 as software and advertising platforms. That identity is changing, and the valuation framework needs to change with it.
The old identity
“Asset-light” meant these companies required minimal physical capital relative to revenue. They generated enormous free cash flow, funded buybacks and dividends, and rewarded shareholders without tying up capital in physical plant. The market applied platform multiples: high returns on marginal capital, fast compounding, minimal balance-sheet risk.
The emerging identity
“Balance-sheet intensive” means hyperscalers are now allocating capital at a scale that rivals industrial firms. Microsoft’s $190 billion capex guidance is the anchor example. The collective $139 billion in bond issuance shows that even companies with substantial cash reserves are supplementing with external financing.
The contrast in characteristics matters for how you evaluate every future earnings report on these names:
- Capex intensity: Previously low relative to revenue; now among the highest of any sector globally
- Free cash flow profile: Previously abundant and growing; now under pressure as capex absorbs operating cash
- Return timeline: Previously near-immediate on marginal revenue; now multi-year as infrastructure projects require build-out before generating economic returns
- Valuation framework: Previously platform multiples assuming high marginal returns; now shifting toward infrastructure multiples assuming lower, slower, but potentially more durable returns
If you still apply a traditional platform-company lens to the Magnificent 7, you will systematically misjudge both the downside risk (execution and leverage) and the upside potential (if AI infrastructure generates compounding returns at scale over time).
How to think about time horizon when evaluating the pullback
Whether this represents a buying opportunity depends entirely on how long you intend to hold. The data supports both the bull and bear positions; the variable that separates them is time.
| Factor | Long horizon (2-3 years or more) | Short horizon (12-18 months) |
|---|---|---|
| Key supporting data | $873B contracted backlog, 46% YoY growth, two-year conversion window | Forward P/E at 38.4x, record bond issuance, Fed rate uncertainty |
| Primary risks | Execution risk on AI capex, competitive broadening of AI economics | Further multiple compression, leverage drag, macro deterioration |
| Suggested posture | Maintain or gradually build exposure within a diversified AI basket | Caution warranted; position sizing should reflect valuation and macro risk |
Phillip Securities Research held its overweight recommendation on the Magnificent 7 after June’s pullback, pointing to the group’s more attractive forward valuations and the underlying demand fundamentals as justification for continued hyperscaler capital investment.
If your honest investment horizon is under 18 months, the current valuation and macro setup do not offer the cushion needed to absorb further multiple compression. If it is two to three years or beyond, the backlog conversion and earnings growth trajectory offer a more defensible entry thesis.
Most retail investors make the mistake of applying long-term bull-case logic to positions they will emotionally exit at the first further decline. The question is not whether the AI thesis is correct over five years. The question is whether you will hold through the volatility between now and then.
What the data tells you before you act on this decline
The core tension is clear: the AI trade is intact at the demand level, but the Magnificent 7’s role within it is being repriced to reflect heavier capex, more leverage, and a broadening competitive landscape. That is not a thesis of collapse. It is a thesis of transition.
Three variables will tell you whether June’s selloff was a reset within a continuing cycle or the beginning of a longer derating:
- Capex-to-revenue ratios and return on invested capital (ROIC): Track each hyperscaler’s AI spending against the revenue and margins it generates quarter by quarter. Improving ROIC is the strongest signal that the spending is productive, not speculative.
- Backlog conversion pace: The $873 billion organic backlog with 46% year-over-year growth and a two-year conversion window is the demand anchor. Watch whether that conversion accelerates, holds steady, or slows. Slowing conversion would validate the bear case far more than any price decline.
- Fed rate trajectory under new leadership: Higher rates compress the present value of future cash flows and increase the cost of the debt financing these companies are increasingly relying on. The direction of rates is a direct input into whether a 38.4x forward P/E can hold.
For investors who want AI thematic exposure with less Magnificent 7 concentration risk, semiconductors, memory, networking, and data-centre infrastructure firms represent a complementary allocation rather than a replacement thesis. The “changing of the guard” that played out in June does not mean abandoning AI. It means recognising that AI economics are broadening across a wider ecosystem.
AI supply chain investing maps where the $630–725 billion in 2026 hyperscaler capex is actually concentrating profit: foundries and memory producers such as TSMC and SK Hynix retain structural leverage because every custom and third-party AI chip depends on the same fabrication and HBM ecosystem, while legacy application software multiples have compressed approximately 41% over the trailing twelve months against AI-native firms trading at a median of roughly 21x EV/revenue.
The 29% Q1 2026 earnings growth confirms the business fundamentals have not broken. The question is whether the market gives these companies credit for that growth while they undergo a structural transition in how they finance and deliver it. Tracking the three variables above removes the need to guess.
This analysis is for informational purposes only and does not constitute personal financial advice. Investors should conduct their own research and consult with financial professionals before making investment decisions. Past performance does not guarantee future results, and forward-looking statements are subject to change based on market developments and company performance.