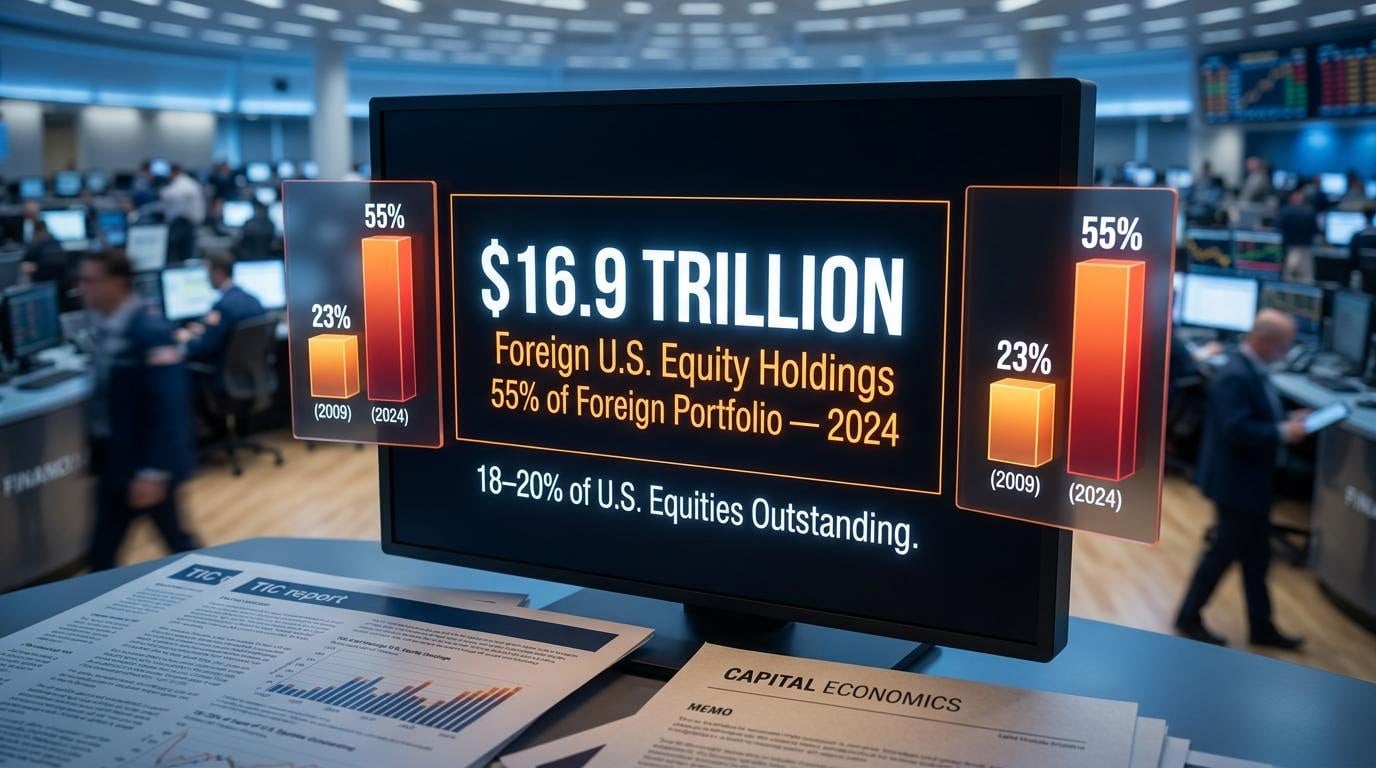
For fifteen years, foreign investors have been quietly reshaping how they hold America. What was once a portfolio dominated by Treasuries and agency debt has flipped to an equity-majority position, meaning roughly $16.9 trillion in foreign capital now rises and falls directly with U.S. stock prices. That structural change, not just the headline ownership figure, is what makes the current configuration worth understanding precisely.
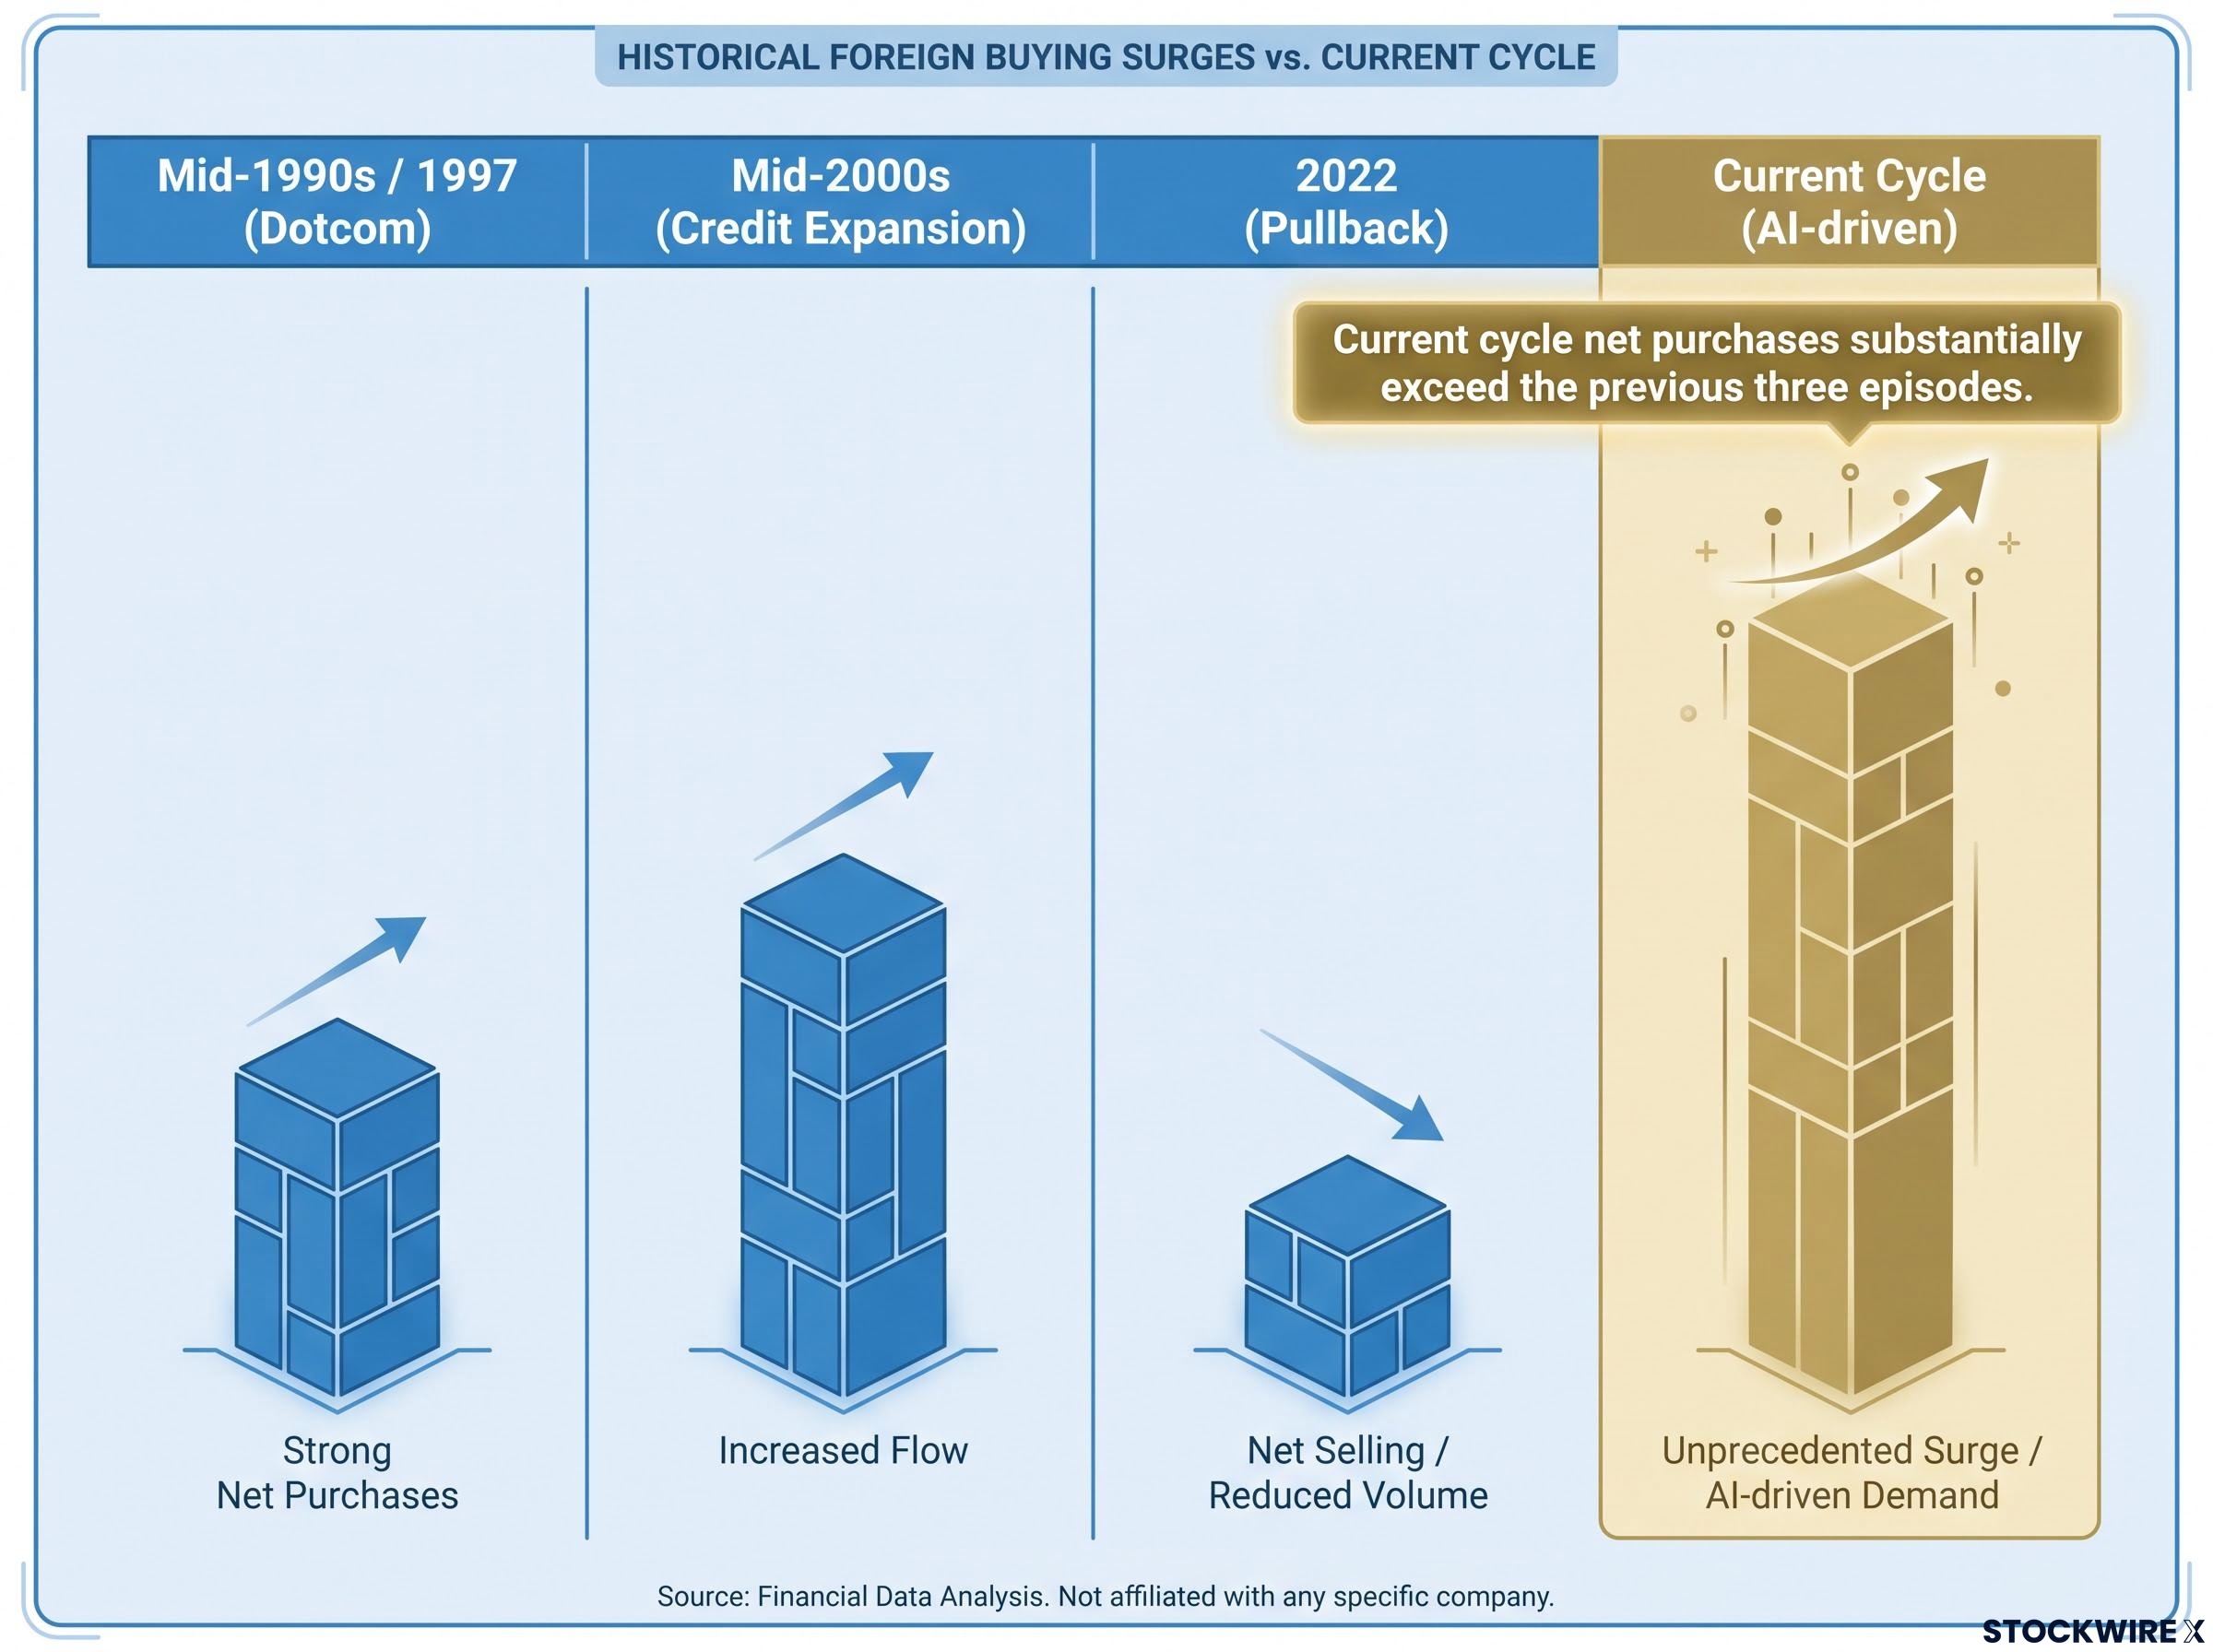
Capital Economics, in analysis published today (22 July 2026), characterises foreign ownership of U.S. equities as historically elevated. Chief Economic Adviser John Higgins notes that net purchases of U.S. equities by overseas investors have grown far more sharply in the current cycle than in any of the three comparable episodes: the dotcom boom, the mid-2000s credit expansion, or the 2022 pullback. The AI-driven equity surge has turbocharged a trend that was already decades in the making.
Here is a clear map of where the structural risk actually sits, what the historical record offers as a guide (and where it falls short), and what specific variables will determine whether this concentration unwinds gradually or amplifies something worse.
Foreign investors have never held this much U.S. equity, and the composition has changed
The scale alone is striking. Under the Treasury International Capital (TIC) framework, a system the U.S. Treasury uses to track cross-border securities holdings, foreign investors held approximately $16.9 trillion in U.S. equities as of the June 2024 benchmark survey. Total foreign holdings of all U.S. securities stood at roughly $30.9 trillion. That puts the foreign share of U.S. equities outstanding at approximately 18-20%, up from roughly 5.6% of the total U.S. equity market in 1994.
The Treasury International Capital system is the official framework through which the U.S. Treasury tracks cross-border securities holdings, publishing both monthly flow data and annual benchmark surveys that allow investors to monitor whether foreign equity positions are accumulating or unwinding in near-real time.
$16.9 trillion: the approximate value of U.S. equities held by foreign investors as of the June 2024 TIC benchmark, representing roughly 18-20% of U.S. equities outstanding.
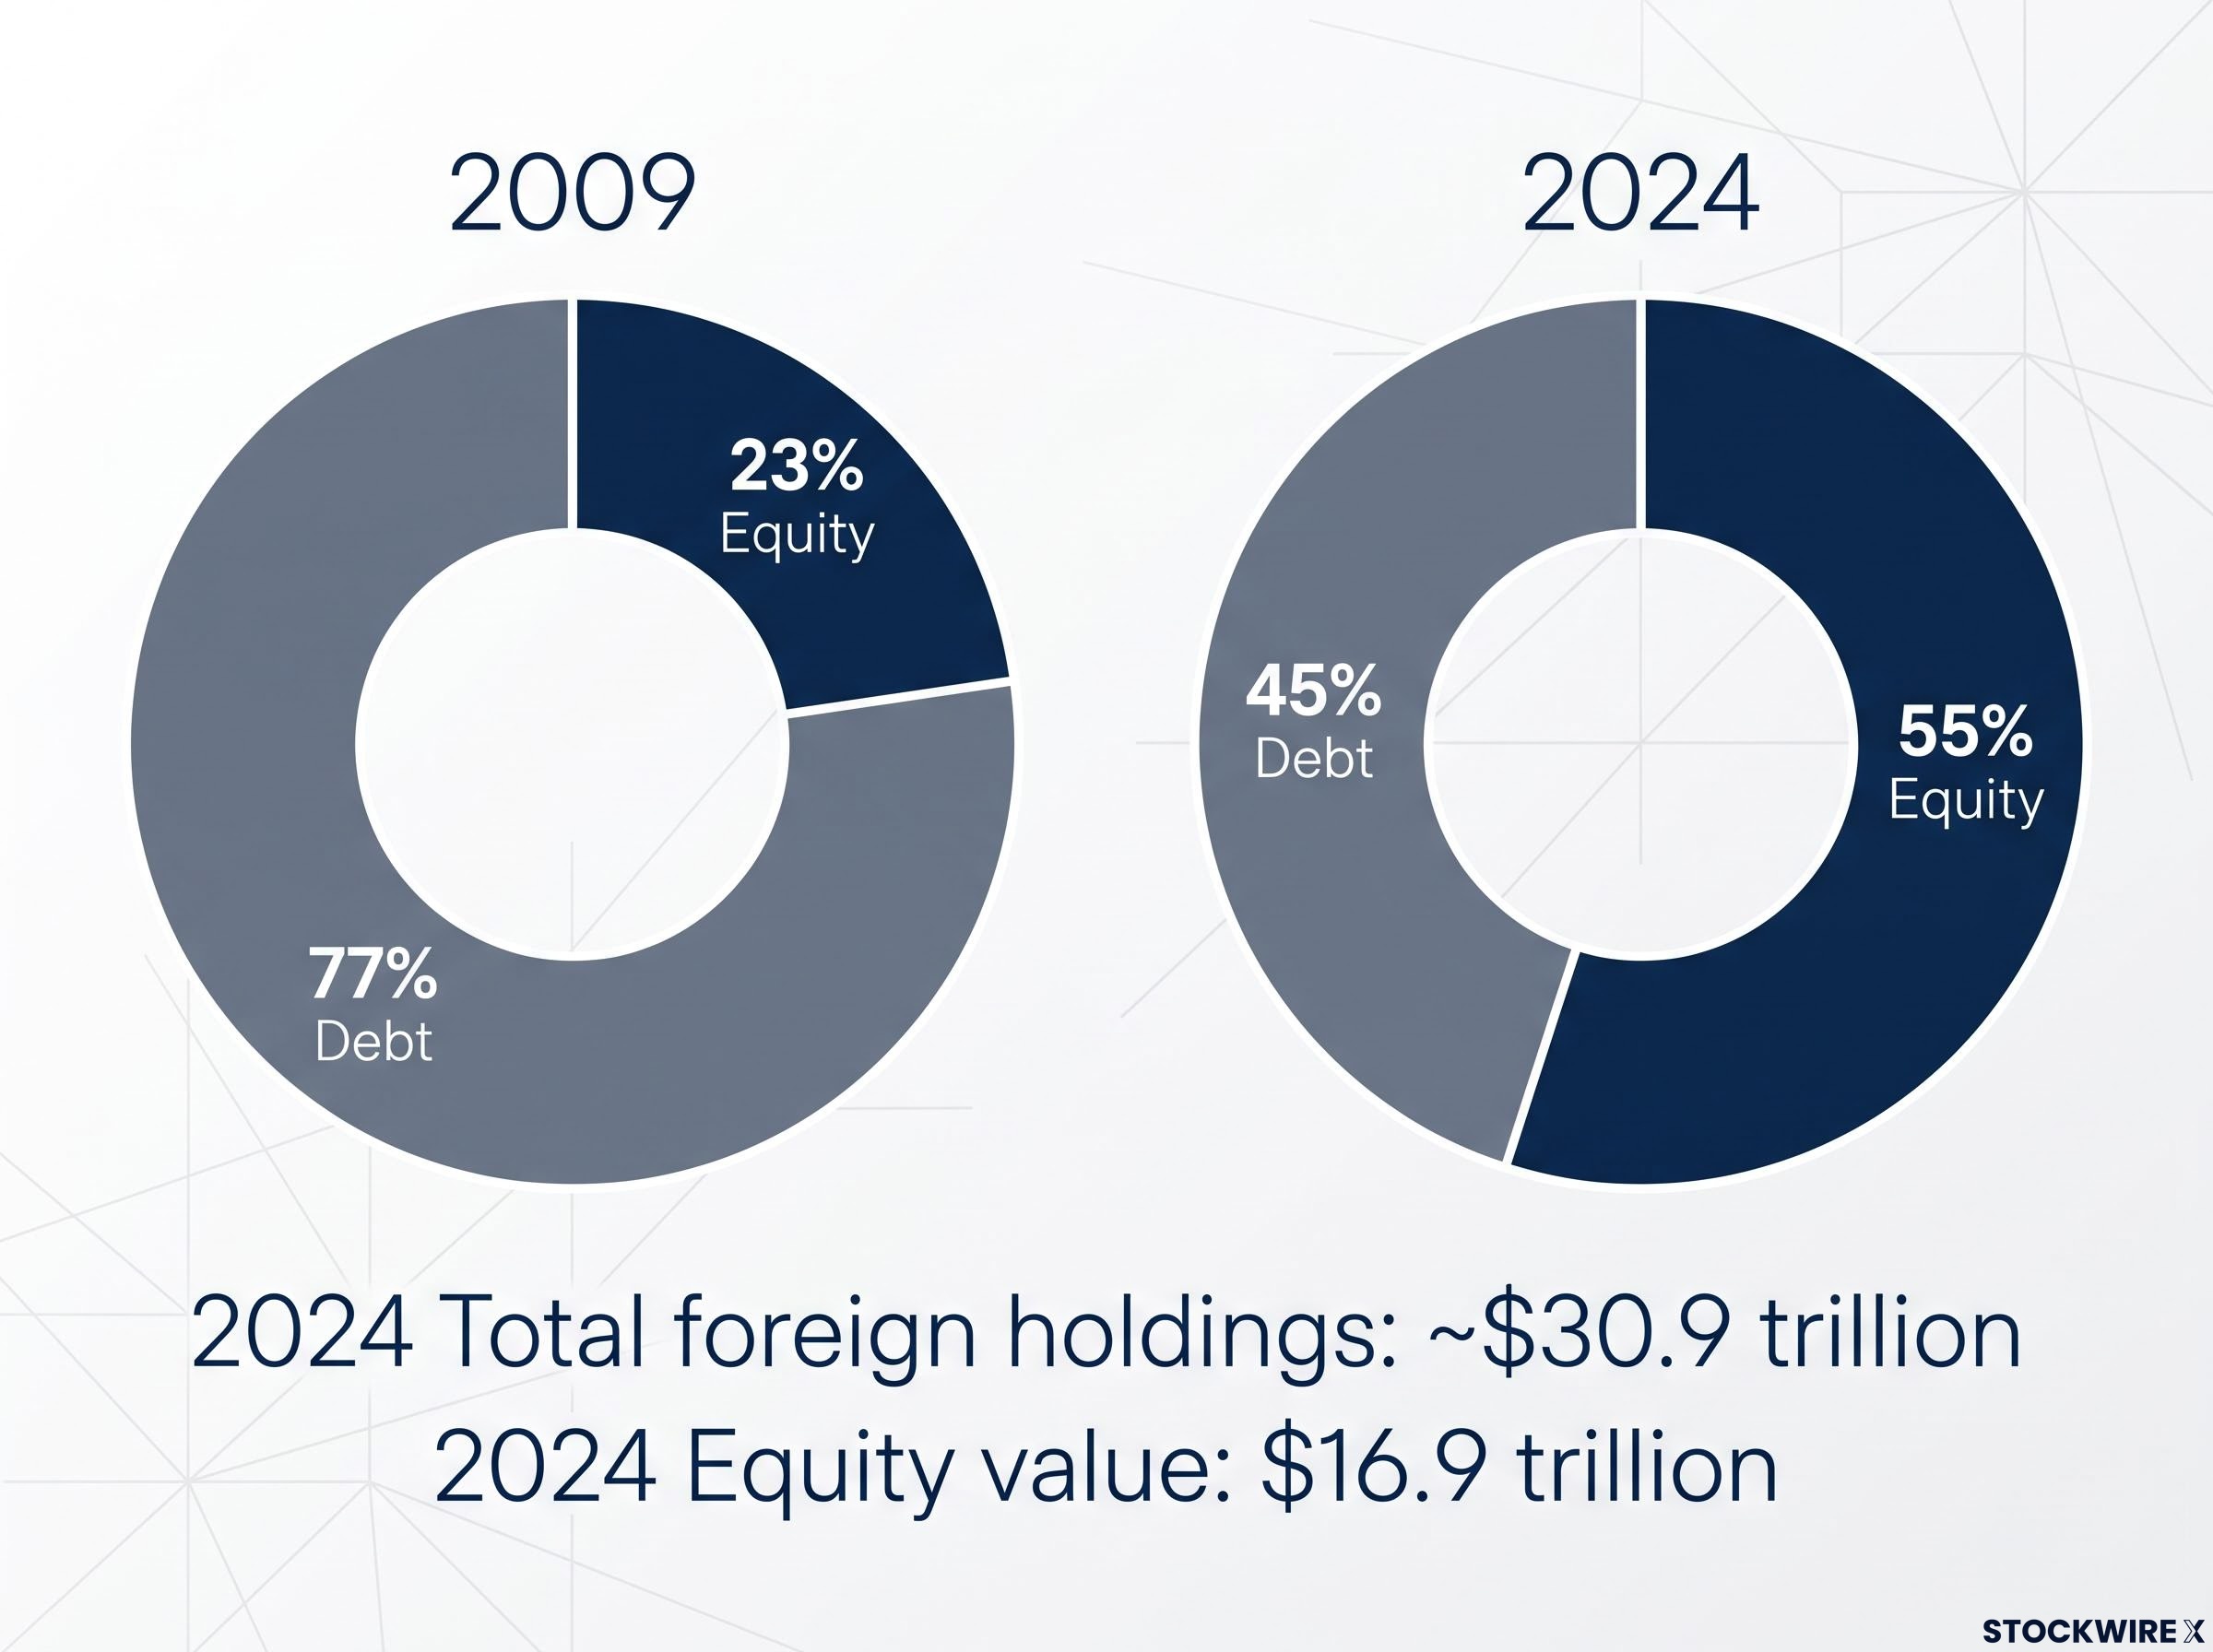
The ownership figure matters. The composition shift matters more. In 2009, equities made up just 23% of foreigners’ total U.S. portfolio. By 2024, that figure had reached 55%. Foreign capital has gone from a debt-heavy stabiliser to a direct participant in U.S. equity price formation.
| Year | Equity share | Debt share | Total foreign holdings |
|---|---|---|---|
| 2009 | 23% | 77% | N/A |
| 2024 | 55% | 45% | ~$30.9 trillion |
That reallocation from 23% to 55% is the number that changes the risk calculus. Any reversal in foreign sentiment toward U.S. equities now hits stock prices more directly than it would have in any prior decade, because the capital exposed to equity movements has more than doubled as a share of the total foreign position.
When big ASX news breaks, our subscribers know first
What the historical record actually shows about surges in foreign buying
Three episodes stand out, and Capital Economics names each of them as precedents for the current cycle:
- Mid-1990s: Foreign holdings reached then-record levels by 1997 under TIC measures. When the dotcom narrative broke, foreign investors were among the marginal sellers, amplifying the drawdown.
- Mid-2000s: Foreign capital inflows into fixed income, particularly mortgage-related assets and Treasuries, financed the credit boom. When that structure collapsed, the selling pressure compounded the crisis.
- 2022: A broad equity pullback coincided with foreign repositioning, though at a smaller scale than the two earlier episodes.
In each case, the mechanism was the same: foreign investors were not the cause of the correction, but they were among the marginal sellers when the prevailing narrative broke, which amplified the downside rather than absorbing it.
Capital Economics finds that the net purchases of U.S. equities by foreign investors in the current cycle have substantially exceeded those recorded during each of those three earlier rallies. That is the amplification risk in quantitative terms.
The Capital Economics analysis lands alongside a parallel warning from Barclays, where record equity inflows of $150 billion in June 2026 are framed not as a confidence signal but as a FOMO-driven crowding event that caps upside and amplifies downside risk, particularly given that the US versus rest-of-world flow differential has stretched beyond one standard deviation above historical norms.
Where the pattern holds and where it does not
The historical record is not clean enough to support a simple rule. Large foreign inflows during the late 1980s to early 1990s and the early 2010s did not immediately precede major equity crashes. Academic and Federal Reserve research generally finds that foreign flows follow returns rather than lead turning points; they are procyclical, meaning they tend to accelerate into strength and reverse into weakness.
The defensible conclusion is specific: elevated foreign ownership is a potential amplifier of whatever correction materialises. It is not a reliable standalone timing signal. The difference between those two framings matters for how you use this information.
Why AI-driven enthusiasm has made this cycle structurally different
Capital Economics attributes the current surge in foreign buying in significant part to AI-related enthusiasm, and John Higgins’ 22 July 2026 analysis makes the connection explicit. U.S. large-cap technology and AI-linked names have outperformed international markets, attracting foreign capital through both net purchases and valuation gains. The TIC June 2024 benchmark explicitly notes that price appreciation has been a significant contributor to rising foreign equity holdings in dollar terms, beyond new net inflows alone.
Capital Economics finds that the scale of overseas net purchases of U.S. equities in the current cycle has substantially exceeded the inflows seen during the dotcom boom, the mid-2000s credit expansion, and the 2022 pullback.
That concentration carries a specific fragility. The AI-attribution framing is Capital Economics’ analytical interpretation rather than a separately measured data category in official TIC reports, but the directional logic is straightforward: Capital Economics warns that if the AI investment narrative loses momentum, U.S. equities are likely to trail international markets, both draining away the valuation support that built this position and prompting foreign investors to reduce their U.S. holdings.
U.S. market concentration reaching levels where five companies control roughly 30% of total capitalisation, a share that exceeds even the dot-com peak, compounds the foreign ownership dynamic: foreign investors who bought into broad US equity indices have inadvertently concentrated their exposure in the same handful of AI-linked mega-caps whose narrative reversal Capital Economics identifies as the central risk.
For you, the practical read is that the risk of reversal is not diffuse but thematic. If the AI narrative breaks, foreign selling could be fast and sector-concentrated rather than slow and broad-based, because the buying that built this position was itself concentrated in a single thesis.
How the dollar fits into a reversal scenario
Foreign purchases of U.S. equities require dollar acquisition. A reversal of those purchases mechanically reduces demand for the dollar, all else being equal. That is the portfolio-balance mechanism at its simplest: less foreign buying of U.S. assets means less foreign buying of dollars.
The structural backdrop makes the sensitivity more acute. The U.S. net international investment position (NIIP), the difference between what Americans own abroad and what foreigners own in America, is deeply negative, a consequence of decades of persistent current-account deficits. With equities now 55% of the foreign portfolio, that negative NIIP is increasingly sensitive to equity market conditions.
Broader dollar reserve dynamics provide useful context for the NIIP sensitivity described here: the dollar’s global reserve share has fallen from roughly 72% to 56.8% over two decades, but exchange-rate valuation effects account for a significant portion of that measured decline, a distinction that matters when assessing how quickly structural positioning shifts can translate into actual currency moves.
Two paths for the dollar depending on how central banks diverge
The dollar’s behaviour during any equity-led reversal is not automatic. It depends on how the Federal Reserve moves relative to other major central banks:
- Fed eases more aggressively than the ECB and other major peers. Reduced equity inflows combine with rate-differential compression, compounding downward pressure on the dollar.
- Fed holds rates relatively higher than peers. Equity outflows still reduce dollar demand, but rate support partially limits the decline.
Neither scenario fully insulates the dollar if equity outflows are large enough. John Higgins identified this Fed-versus-peers differential as the key determinant of dollar performance in a reversal scenario. What that tells you is that watching stock prices alone is not sufficient; you need to monitor the relative policy stance simultaneously.
What to watch as indicators of a shift in foreign positioning
None of these indicators function as crash signals in isolation. Together, a simultaneous deterioration across several of them would represent a materially different risk environment than any single metric moving alone:
- TIC monthly flow data: Released monthly and annually by the U.S. Treasury. A sustained shift from net purchases to net sales of U.S. equities would be the most direct signal.
- U.S. versus international equity performance differential: The AI-driven outperformance that attracted foreign capital is also the variable whose reversal would trigger reallocation. A narrowing or inversion of this gap is the most proximate leading signal.
- Federal Reserve policy stance relative to major peers: If the Fed begins easing faster than the ECB and other major central banks, the dollar support layer weakens, potentially accelerating foreign repositioning.
- BEA quarterly NIIP data: Published quarterly by the Bureau of Economic Analysis. This is a slower-moving structural indicator, but a further deepening of the negative position would confirm the accumulation of foreign claims is continuing.
The BEA international investment position data provides the quarterly structural read on how deeply negative the U.S. NIIP has become, offering a slower-moving but high-confidence confirmation of whether foreign claims on U.S. assets are continuing to accumulate beyond what equity price appreciation alone explains.
Capital Economics’ framework points to the U.S. versus international performance differential as the most actionable of these, because it sits closest to the AI-enthusiasm variable that has driven this cycle’s foreign inflows.
What this configuration means before conditions change
Foreign investors hold approximately $16.9 trillion in U.S. equities, roughly 18-20% of the market, with equities now 55% of their total U.S. portfolio. According to Capital Economics, the volume of foreign net purchases during this cycle has been substantially greater than in any comparable prior episode. The historical pattern suggests foreign capital amplifies corrections rather than predicts them. The AI concentration means that amplification could be fast and thematic rather than gradual. The dollar’s response depends on the Fed’s policy stance relative to global peers.
This is a risk configuration, not a timing call. It does not tell you when the cycle turns, but it does tell you the margin for an orderly unwinding is narrower than headline equity indices currently suggest.
The variables that matter, TIC flows, U.S. versus international performance, Fed policy, are observable in real time. That is the practical value: you can track whether this configuration is resolving or intensifying without waiting for a retrospective confirmation, and adjust your risk framework accordingly.
For investors wanting to translate this macro risk framework into specific portfolio-level action, our dedicated guide to AI stock concentration risk covers position-sizing disciplines, layer-by-layer exposure mapping across chips, cloud infrastructure, enterprise software, and AI-native applications, and the rebalancing triggers that convert concentration risk principles into actual behaviour.
Capital Economics’ John Higgins finds that the volume of foreign net purchases of U.S. equities in the current cycle has dwarfed those seen during the dotcom boom, mid-2000s credit expansion, or 2022 pullback, making the potential amplification effect correspondingly larger.
This article is for informational purposes only and should not be considered financial advice. Investors should conduct their own research and consult with financial professionals before making investment decisions. Past performance does not guarantee future results. These statements are subject to change based on market developments and macroeconomic conditions.