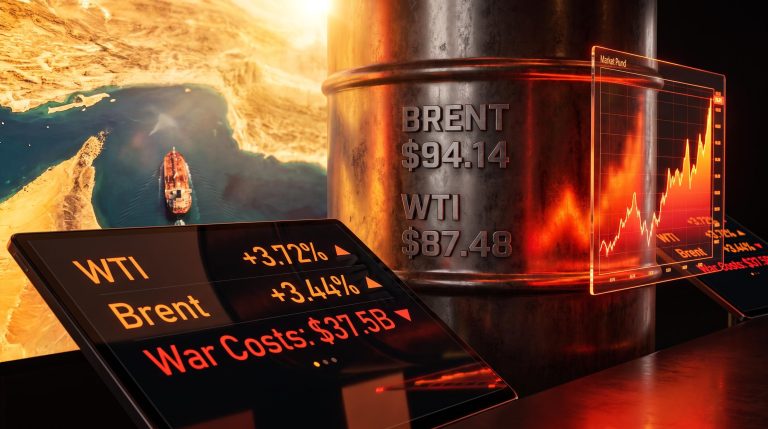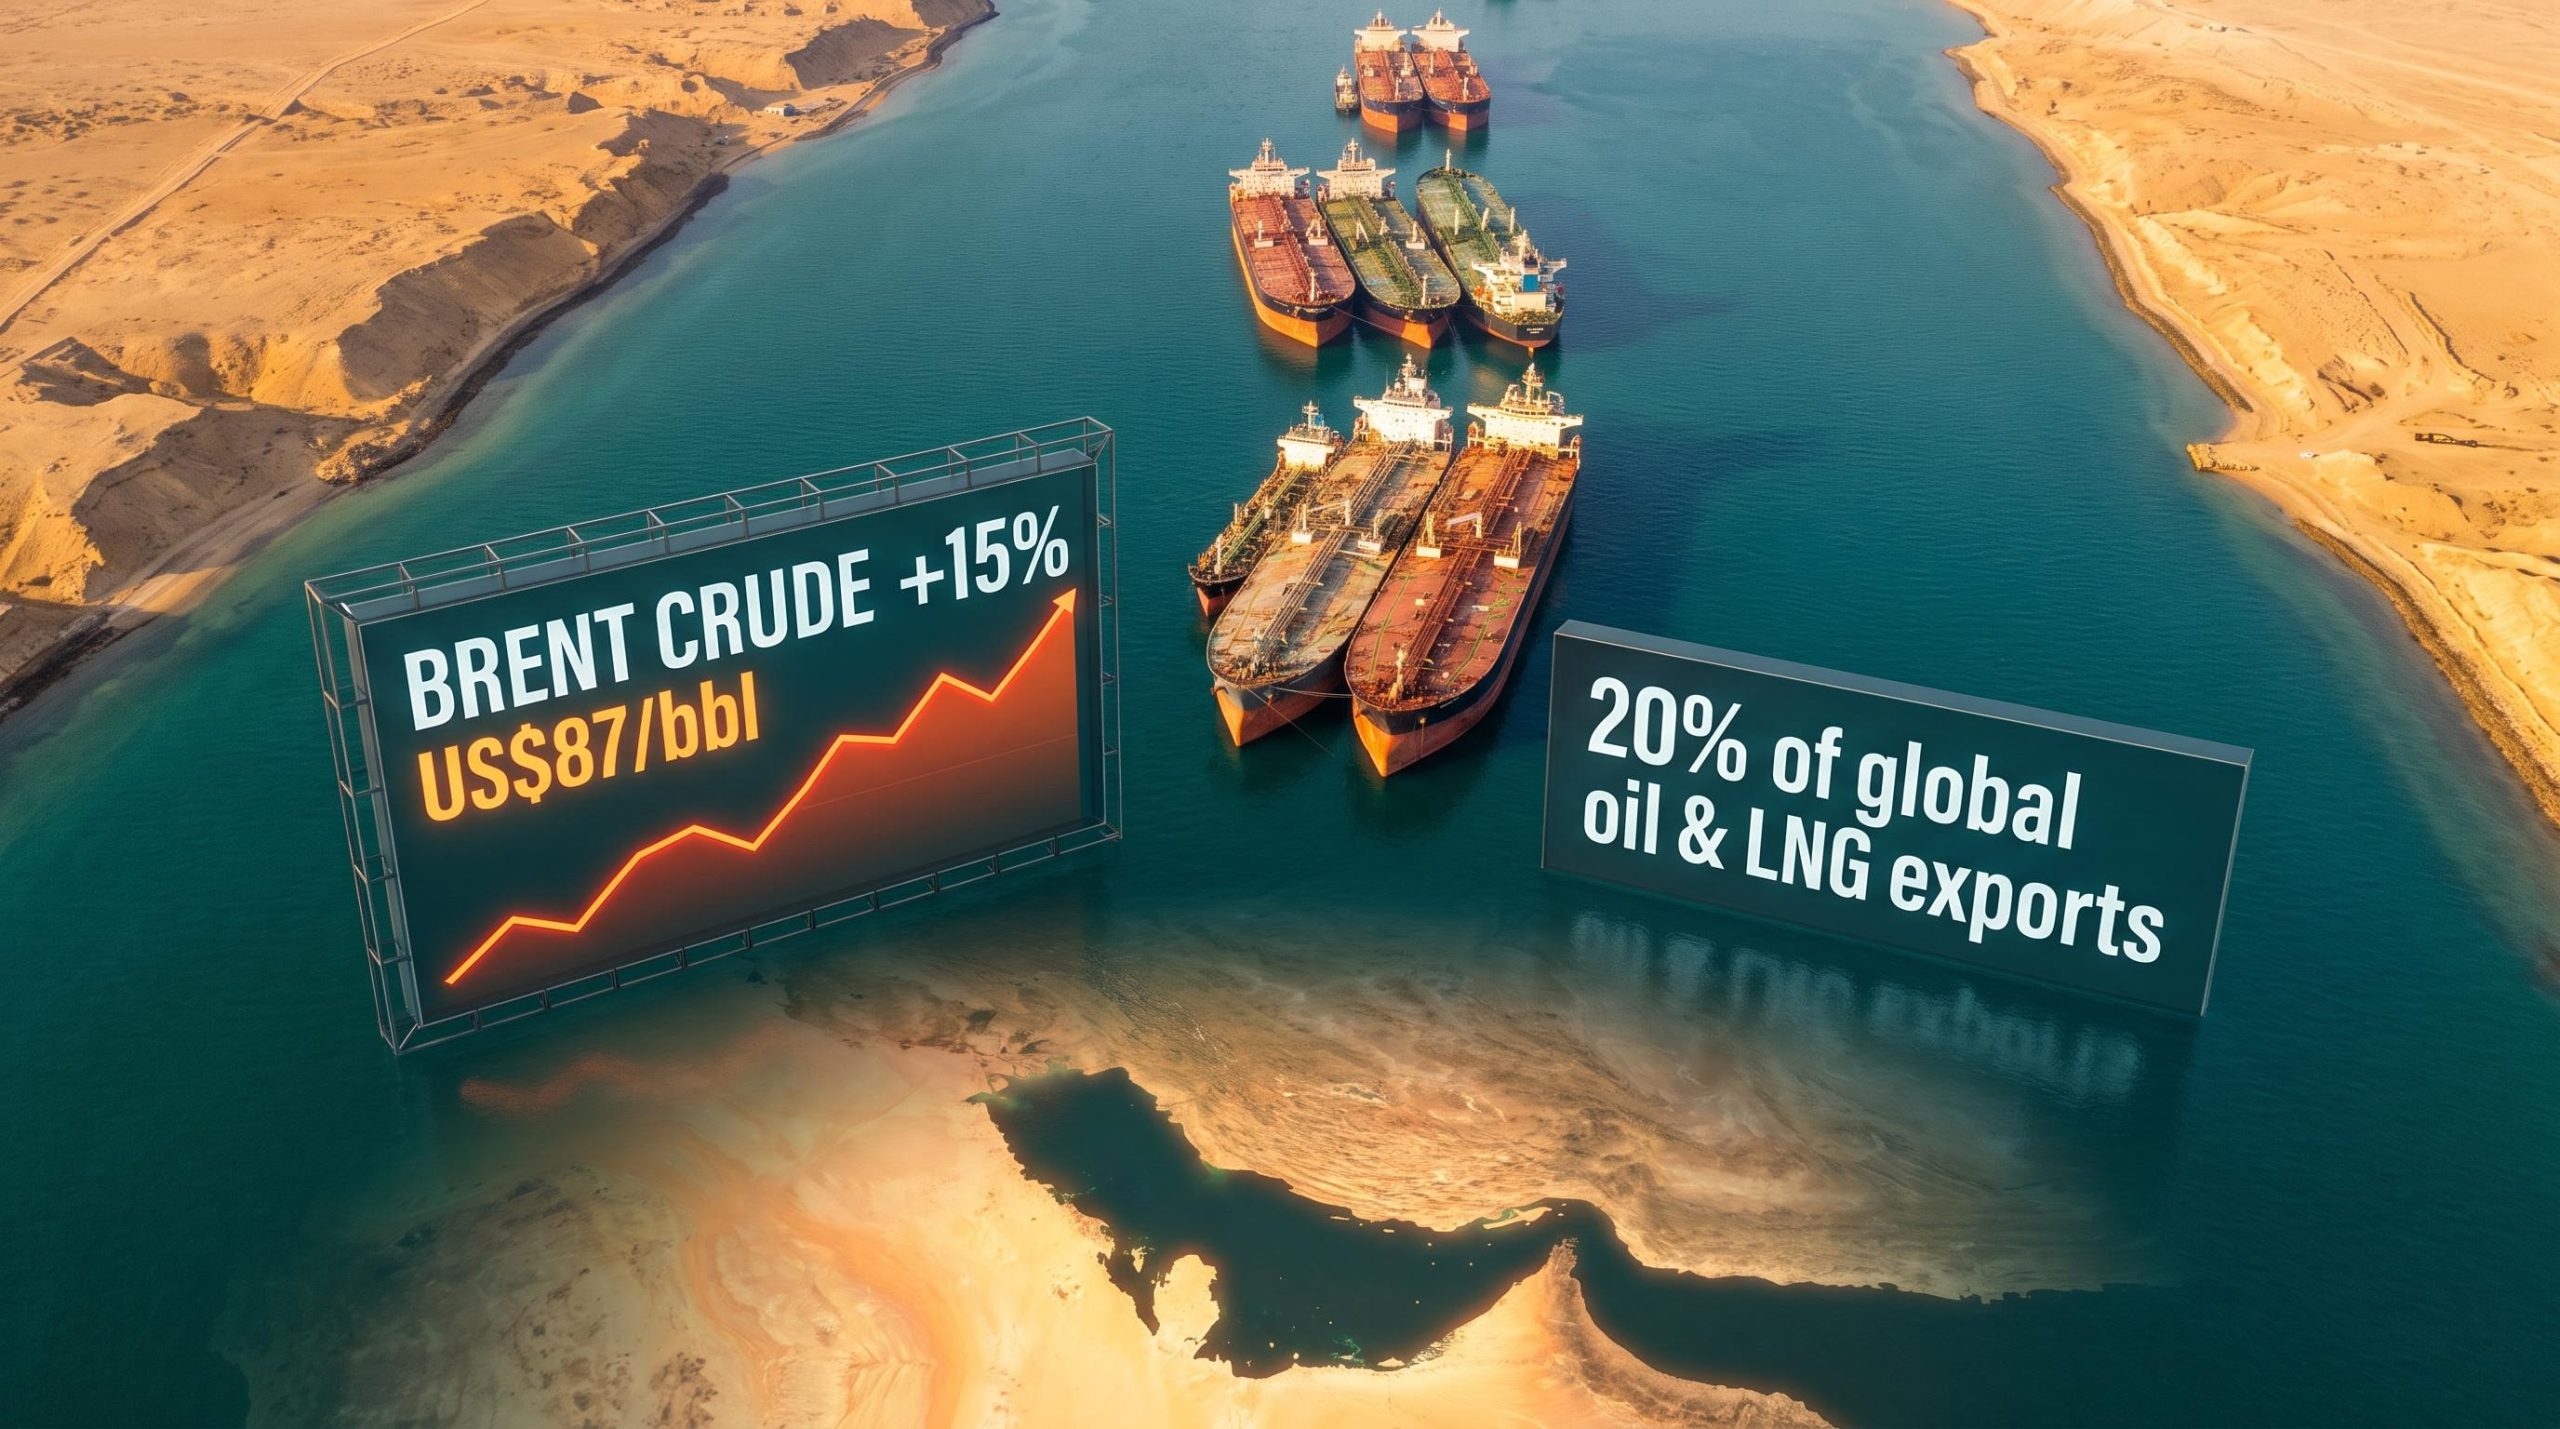
The Strait of Hormuz is narrow enough to cross by speedboat. Last week, that sliver of water knocked 15% onto the price of oil and forced two of the world’s most watched central banks to reconsider everything they thought they knew about inflation in 2026.
What made this particularly difficult was the timing. June US inflation data had, until that point, offered exactly what markets had been hoping for: evidence that price pressures were subsiding, energy costs were retreating, and a rate-cut cycle was close to getting underway. The Hormuz disruption arrived at the precise moment that window appeared to be opening, and it may have closed it.
What follows here is the full causal chain. From tankers stalled in a contested waterway, through the inflation channels that turn a fuel price into a wages problem, to what it all means for interest rates, bond yields, and household borrowing costs in the US and Australia. This is the mechanism behind the headline, and every link in the chain matters.
Why the Strait of Hormuz controls the world’s oil price
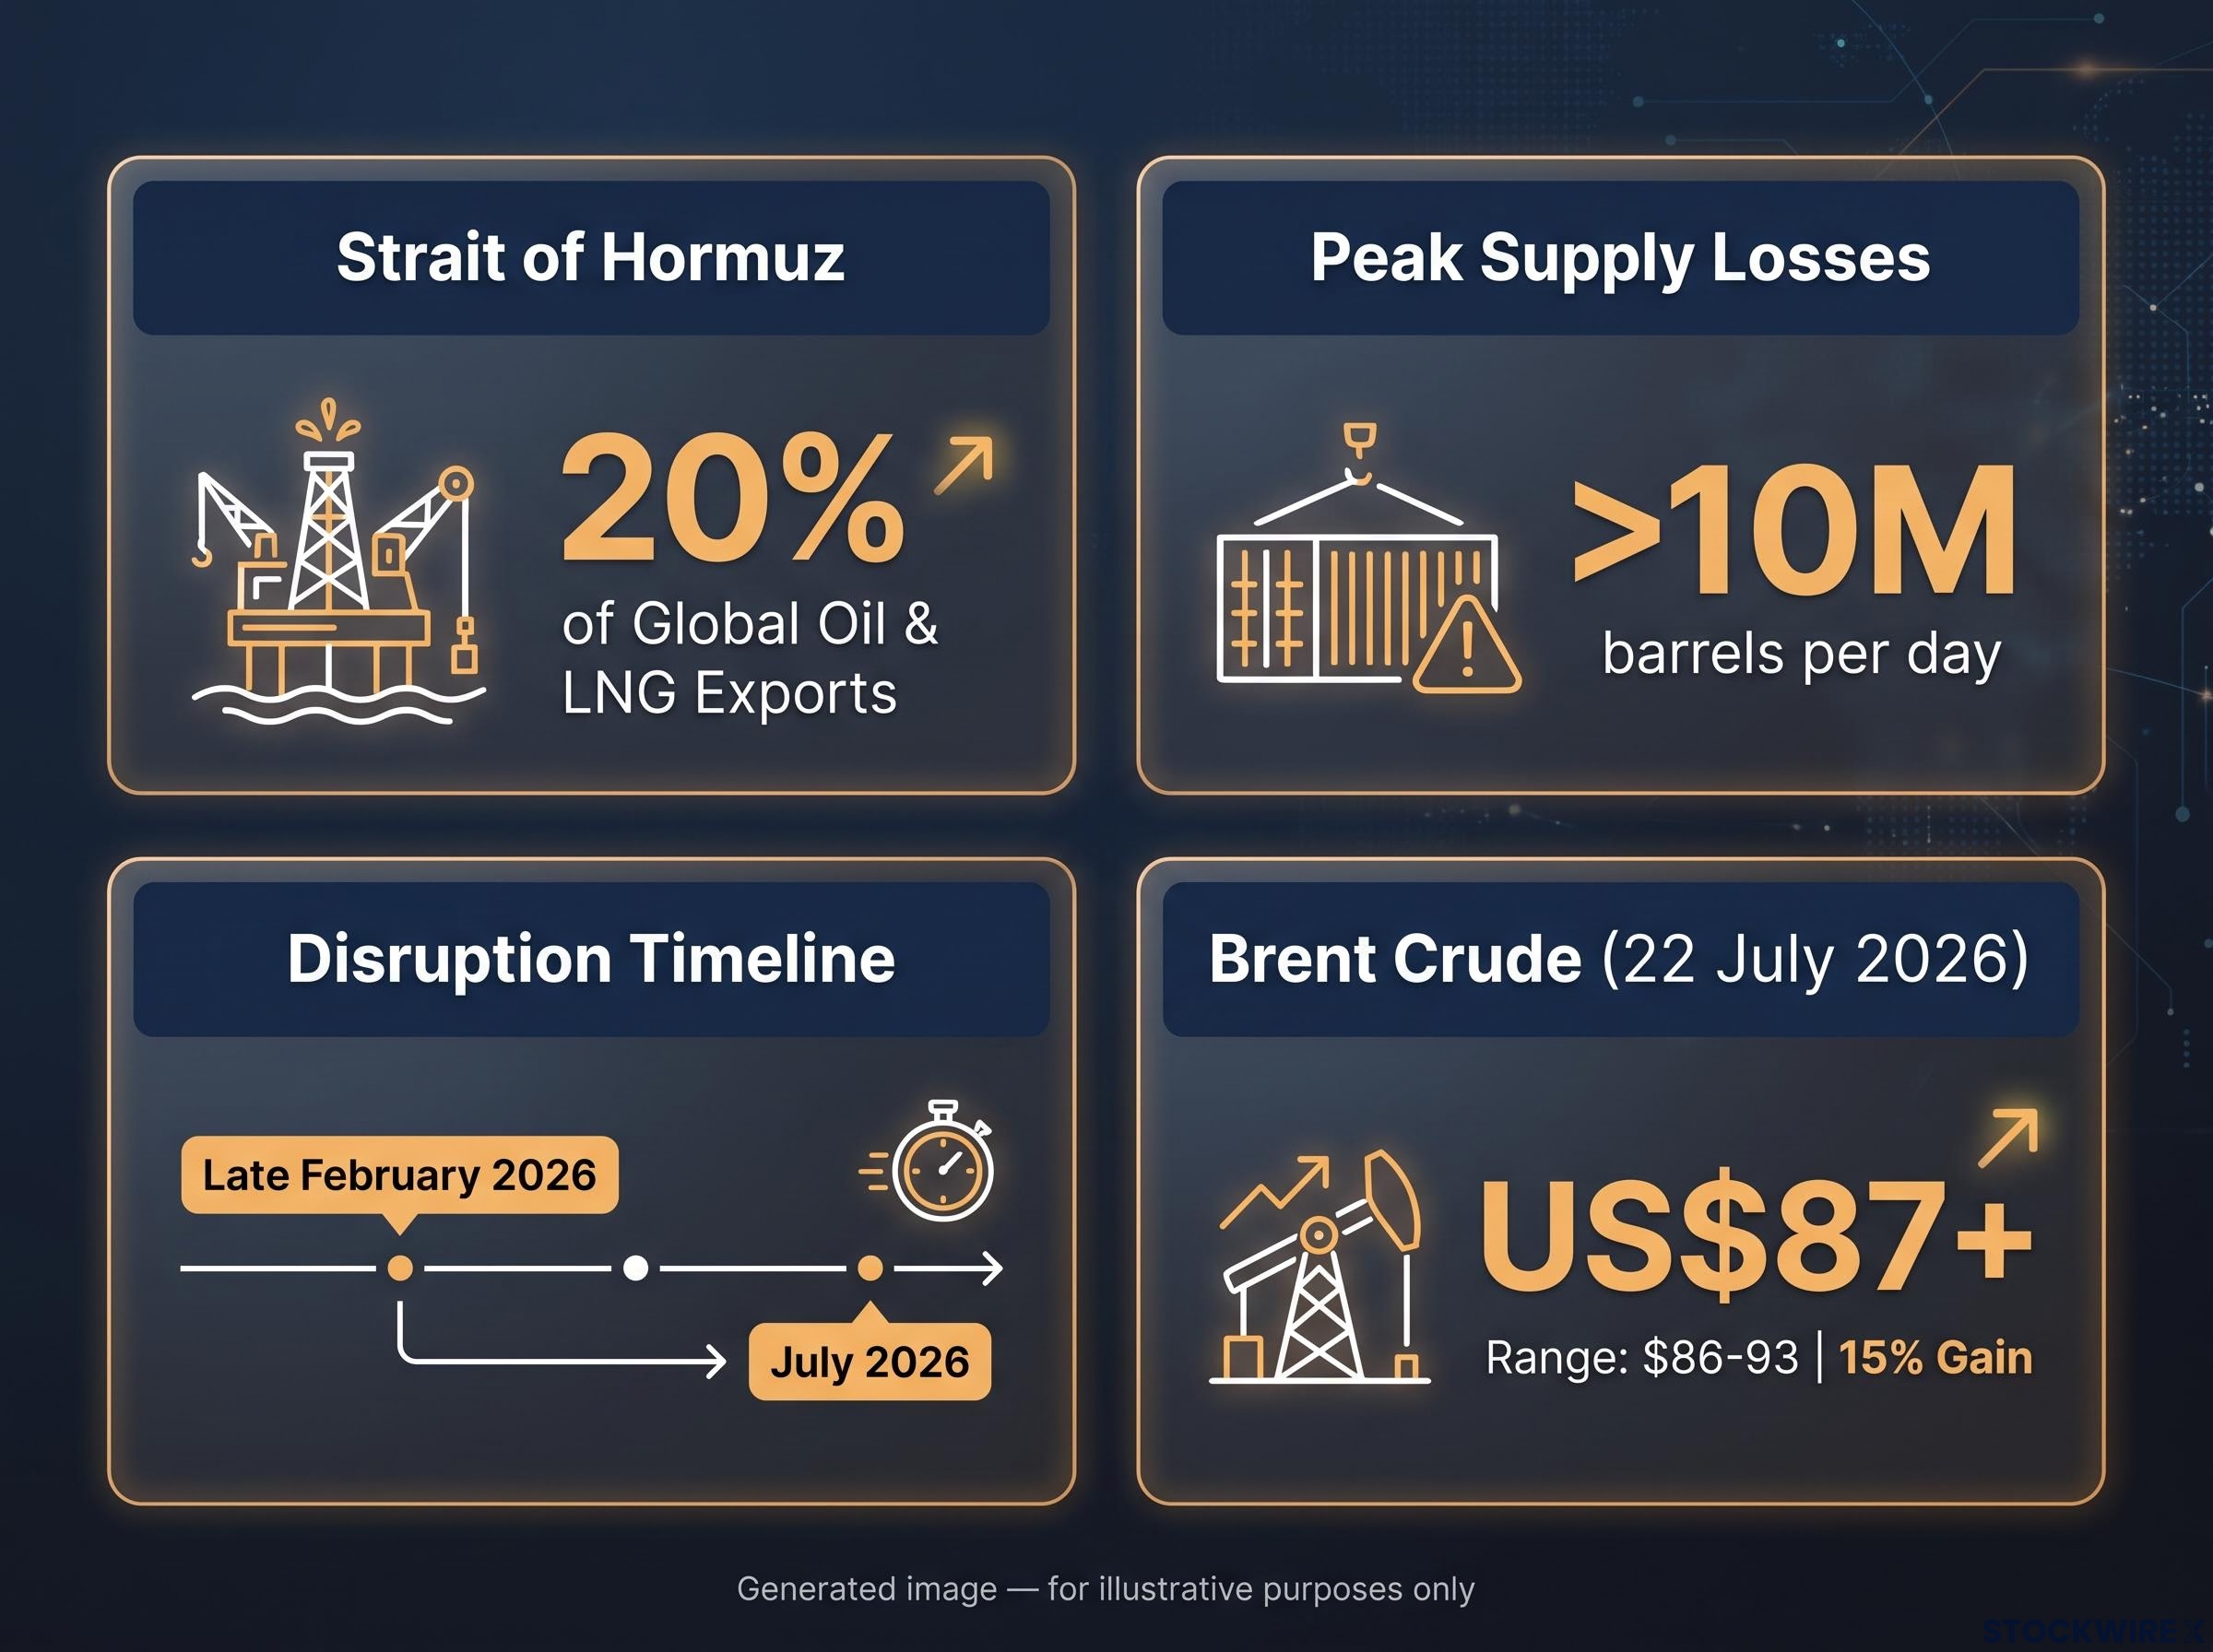
Start with the geography, because the geography is the point. The Strait of Hormuz is the single most consequential energy chokepoint on the planet. Under normal conditions, roughly 20% of the world’s oil and liquefied natural gas (LNG) exports pass through it. When that corridor tightens, the arithmetic of global energy supply changes immediately.
Since late February 2026, it has more than tightened. It has, at times, nearly shut. Missile attacks, airstrikes, war-risk insurance costs, and blockade measures have collapsed tanker transits dramatically. The disruption intensified through the first half of the year, with renewed threats reported into July 2026.
The numbers tell you how severe this is:
- Hormuz handles approximately 20% of global oil and LNG exports under normal conditions
- Tanker transits have collapsed to around one-third or less of pre-war levels across recent periods, with the most acute phases seeing daily flows at very low single-digit percentages of normal volumes
- Peak supply losses have exceeded 10 million barrels per day (mb/d), according to IEA estimates
- The disruption onset began in late February 2026, with conditions worsening into July 2026
The International Energy Agency (IEA) has described this as the largest oil supply disruption in history.
That characterisation is not rhetorical. When daily tanker crossings drop to single-digit percentages of normal, this is not a temporary inconvenience that markets price in and forget. It is a structural supply withdrawal large enough to reset the global energy price level. Brent crude climbed to above US$87 per barrel by 22 July 2026, a gain of around 15% across the prior week, with the contract recently holding within a range of roughly $86-93.
The price move is not speculative panic. It is arithmetic.
When big ASX news breaks, our subscribers know first
How a 15% oil spike becomes an inflation problem in your economy
Understanding the price spike is one thing. Understanding how it reaches your cost of living is another. The transmission runs through three channels, each progressively harder for central banks to manage.
- Direct fuel costs come first. Petrol and diesel prices rise almost immediately when crude climbs. Transport fuels are large, visible components of consumer price baskets in every major economy. You notice this one at the bowser within days.
- Freight and logistics costs follow. Elevated bunker fuel and jet fuel costs raise shipping, trucking, and air freight rates. Those costs feed into the delivered price of almost everything you buy, from groceries to electronics. This channel is slower but broader.
The indirect transmission channel, where elevated energy costs flow through logistics, agriculture, and manufacturing supply chains, operates on a lag of roughly 6-12 months, meaning the full inflation impact of sustained high oil prices has not yet appeared in the data when headline CPI first moves.
- Inflation expectations are the most dangerous channel. When energy price spikes repeat, households and businesses start building higher costs into their assumptions. Workers push harder on wages. Companies raise prices pre-emptively. Central banks watch this channel more closely than any other, because once expectations shift, inflation becomes self-reinforcing and far harder to suppress than a one-time price bump.
When a fuel price becomes a wages problem
This is where the June US inflation data makes the timing so painful. That data had signalled price pressures were finally subsiding, attributed largely to falling energy costs. A sustained oil price increase directly reverses that disinflationary trend, turning a tailwind into a headwind at the worst possible moment.
If you understand these three channels, you can anticipate where the pressure shows up first (fuel, then freight, then goods broadly) and why central banks treat a persistent energy shock as a fundamentally different problem from a temporary one. A one-off spike fades from the data. A sustained shock rewires expectations, and that is the scenario central banks fear most.
What the Strait of Hormuz means for the Federal Reserve’s July 29 decision
The Federal Reserve watches three things simultaneously when setting rates: actual inflation data (both headline and core measures), inflation expectations (from markets and consumer surveys), and financial conditions (bond yields, credit spreads, equity valuations, dollar strength). An oil shock via Hormuz moves all three in the wrong direction at once.
Start with the logic before the numbers. When energy costs lift headline inflation, even if the Fed focuses on core measures that strip out food and energy, repeated upside surprises make it analytically and politically harder to cut rates. When investors price in higher future inflation, Treasury yields rise to compensate, raising real borrowing costs and tightening financial conditions without the Fed doing anything. And when inflation risks rebuild visibly, cutting rates too early risks being seen as pouring fuel on a fire the Fed spent years trying to put out.
Traders are currently assigning roughly a 15% probability to the US Federal Reserve raising rates at its 29 July 2026 meeting, a notable shift from prior expectations of a cut.
That number sounds small. It is not. Markets had previously expected the Fed’s next move to be a cut. The mere appearance of a hike probability in pricing means the risk premium across all asset classes has structurally shifted. Valuations priced for a benign easing cycle are now sitting on shakier ground.
The Fed dot plot split exactly nine to nine at the June 2026 meeting between officials favouring further hikes and those favouring no change, a division that reveals the committee is not merely pausing but genuinely uncertain about direction, which is the backdrop against which the July 29 decision carries outsized weight.
The Fed’s options at the 29 July meeting break down into three scenarios:
- Delay the first cut and signal patience until the inflation picture clarifies
- Signal higher-for-longer by emphasising that the bar for easing has risen
- Keep further hikes conditional on incoming data, leaving the door open without walking through it
Yields on government bonds have risen as investors reconsider whether inflation is truly on a downward path. That tightening in financial conditions achieves some of the same contractionary effect as a formal hike, which means the economy is already absorbing the consequences of the disruption, whether or not the Fed acts on the 29th.
Bond yields, equity valuations, and where market fragility is concentrated
The link between rising bond yields and falling equity valuations runs through a single mechanism: the discount rate.
When bond yields rise on inflation concerns, the rate used to value future corporate earnings rises with them. That lowers the present value of those earnings and compresses price-to-earnings (P/E) multiples, which is the ratio of a company’s share price to its annual earnings per share. The effect hits hardest on growth and long-duration assets, where a larger share of the expected value sits years into the future.
At already elevated valuations, the sensitivity is amplified. The mathematics of discounting is non-linear: a moderate yield move at stretched multiples produces outsized price swings. Underneath the current market, that is a meaningful source of vulnerability.
| Sector | Oil shock effect | Yield rise effect |
|---|---|---|
| Energy | Positive: higher commodity revenues | Moderate: partially offset by sector cash flows |
| Technology | Neutral to mildly negative: input cost pressure | Negative: long-duration valuations compress |
| REITs | Negative: higher operating costs | Negative: yield-sensitive, multiples compress |
| Utilities | Mixed: fuel cost vs. regulated pricing | Negative: bond-proxy status hurt by rising yields |
| Consumer discretionary | Negative: higher input and logistics costs | Negative: demand and margin pressure compound |
US 10-year Treasury yields and inflation-linked securities are the real-time indicators to watch. Valuation compression has already been observed in rate-sensitive sectors during recent yield spikes.
Equity volatility pricing, reflected in a VIX sitting near 17 alongside year-to-date high Treasury yields and a rising hike probability, represents a potential complacency signal: the rates market is already reflecting macro risks that equity valuations have not yet fully absorbed.
If your portfolio is growth-heavy or REIT-heavy, you are sitting in the most yield-sensitive positions at a moment when yields have a credible upside catalyst. That is the specific exposure this environment tests.
Australia’s double exposure: imported fuel costs and an RBA still fighting inflation
Australia’s vulnerability to this shock is structurally distinct from most other major economies. Despite being a resource exporter, Australia is a net importer of refined fuel. Higher global oil prices lift domestic petrol and diesel prices, freight costs, and agricultural input costs, all of which feed directly into headline Consumer Price Index (CPI) readings.
That alone would be a problem. The RBA’s starting position makes it worse.
The RBA places particular weight on the trimmed mean as its gauge of persistent underlying inflation. This measure removes the most volatile price items from both ends of the distribution to isolate the underlying trend. For the 12 months to May 2026, the trimmed mean sits at approximately 3.6%, still above the RBA’s 2-3% target band.
Key data points for Australian investors:
- Trimmed mean inflation: approximately 3.6% (12 months to May 2026)
- RBA target band: 2-3%
- Australian Q2 CPI release date: 29 July 2026
- RBA next meeting: August 2026
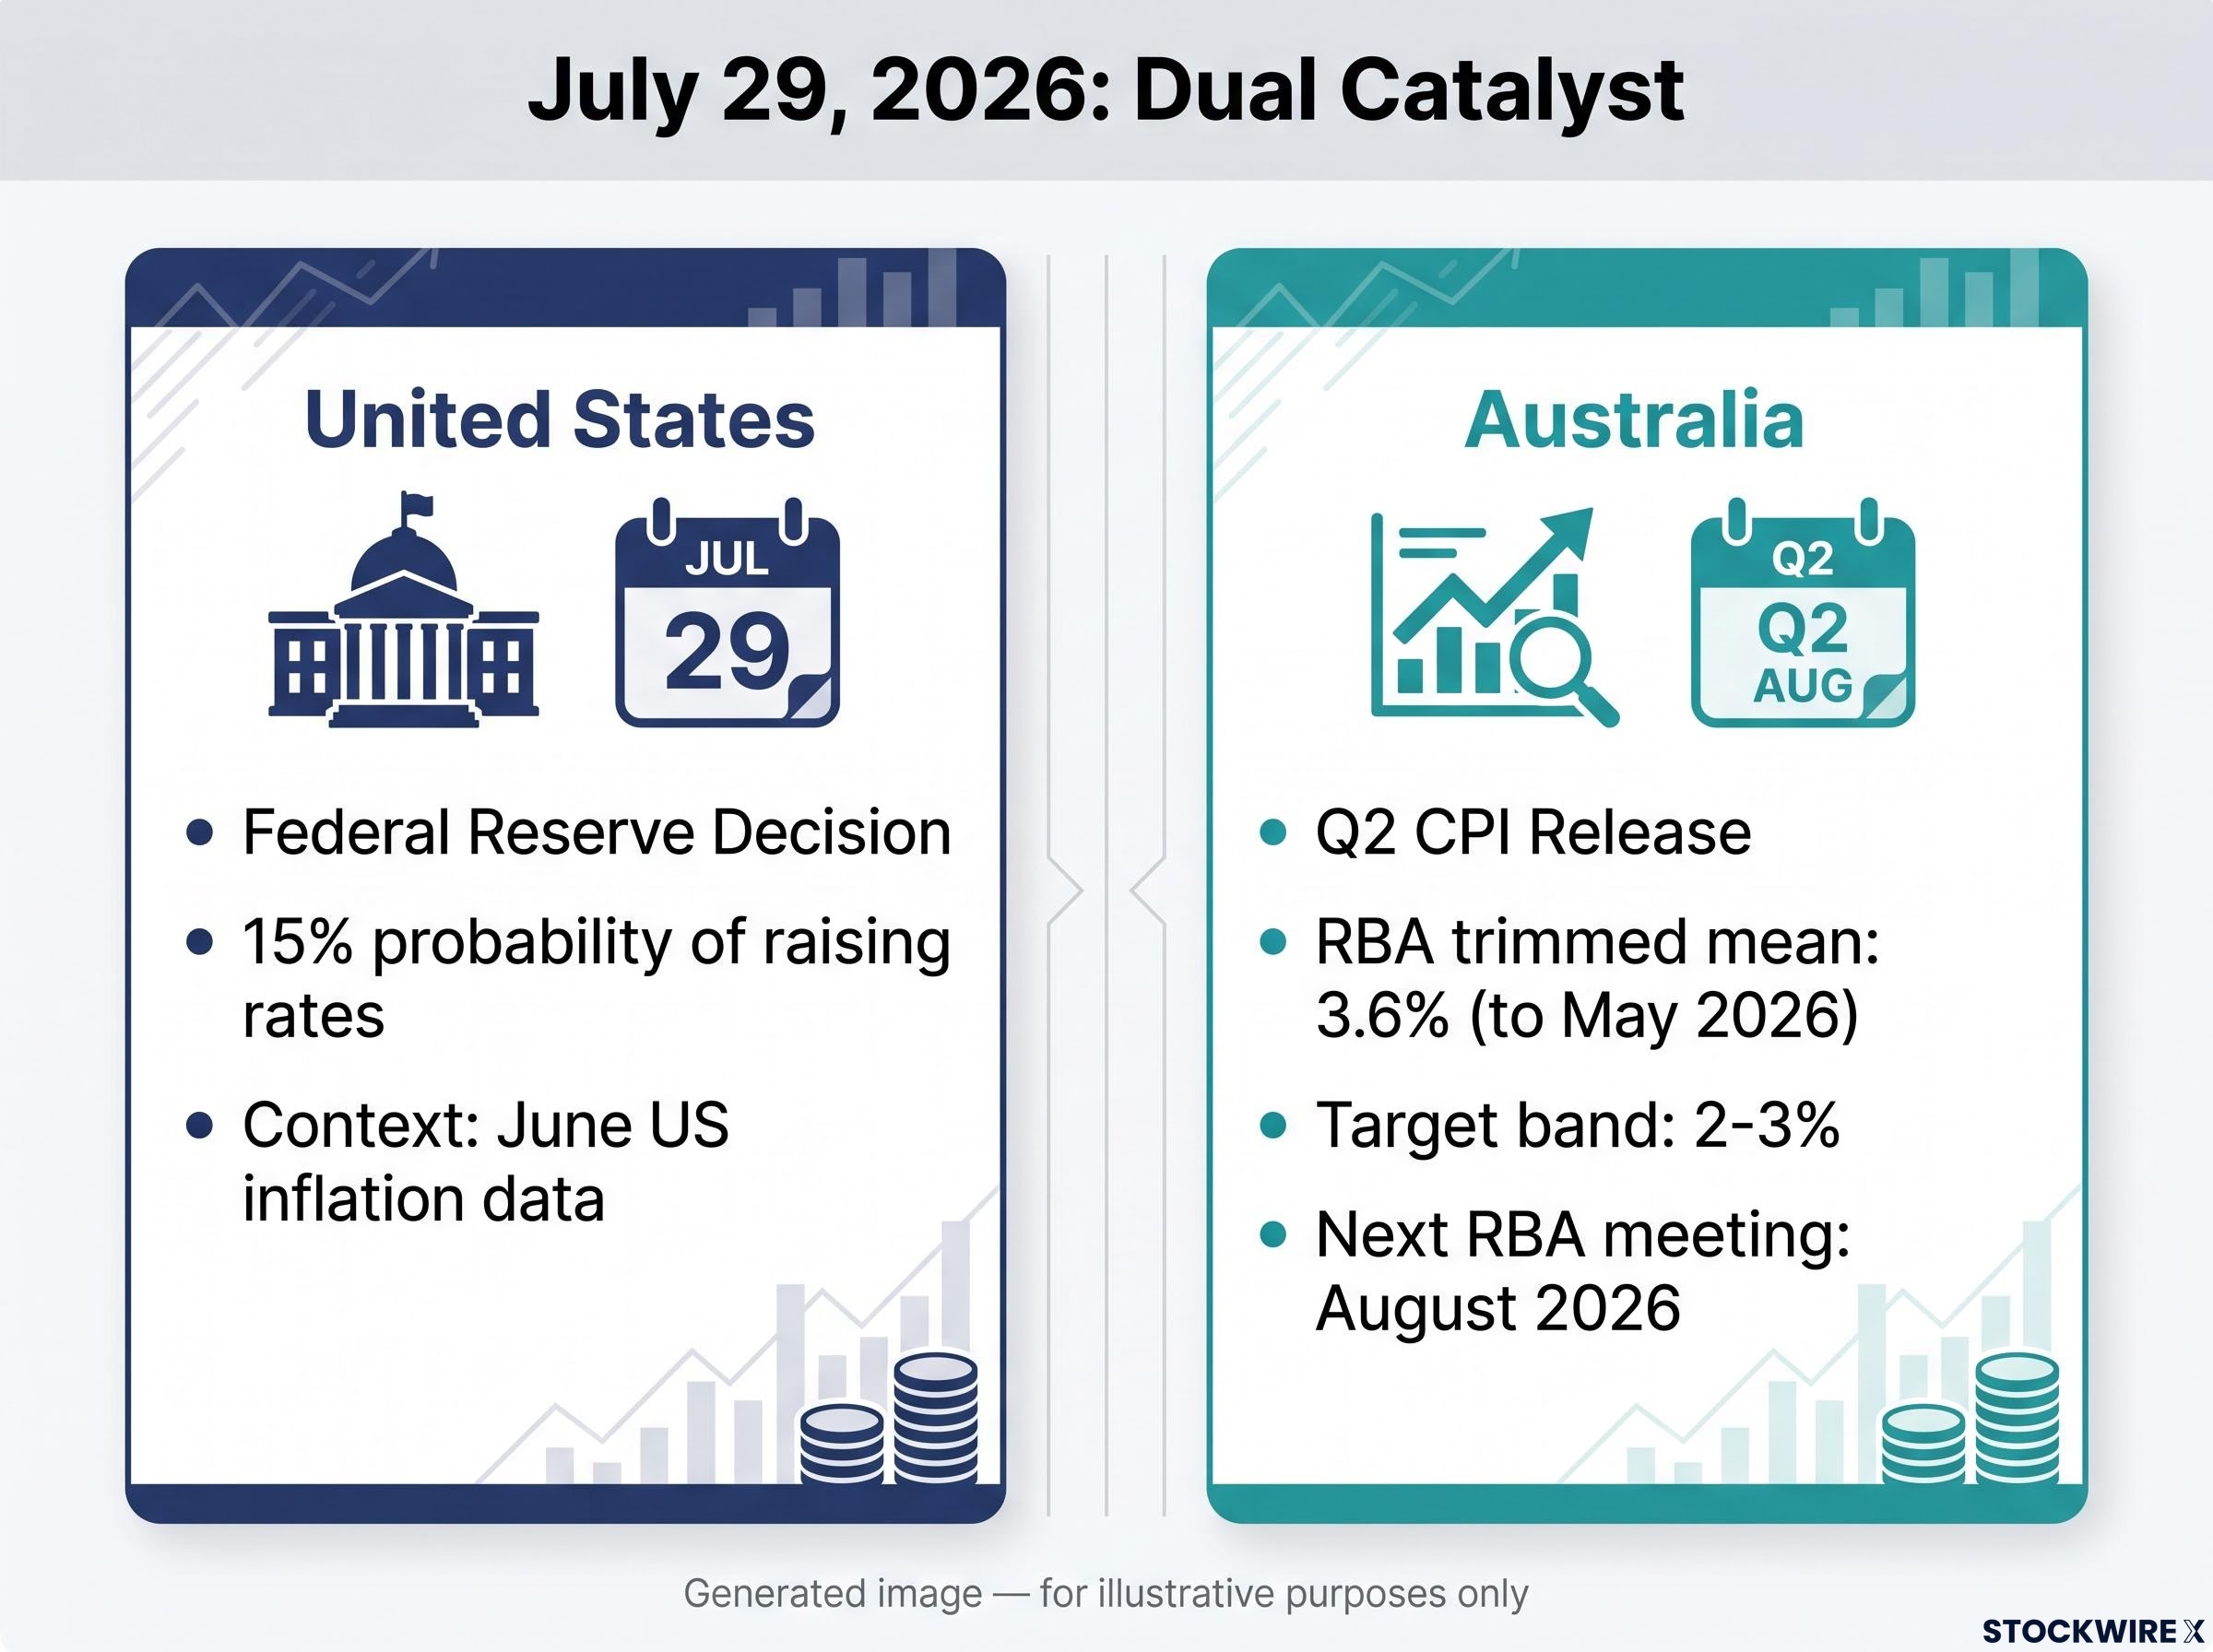
The 29 July date is structurally significant. The Australian Q2 CPI release lands on the same day as the Fed’s decision, making it a dual catalyst for both global and domestic monetary policy signals. The Q2 inflation print, particularly the trimmed mean figure, will be the single most consequential input into the RBA’s August meeting.
The partial offset: what resource exports do and do not change
Australia’s resource-heavy equity market and export revenues do benefit from higher commodity prices. Energy and materials stocks may see support. But for monetary policy and household real incomes, sustained high fuel costs are unambiguously a complication.
The offset matters at the portfolio level. It does not change the policy calculus. With the trimmed mean at 3.6%, the RBA has less room to absorb an oil-driven inflation surprise than a central bank already at or near target. The same global shock creates a larger rate-cut delay risk in Australia than in economies where underlying inflation is already under control.
What happens next, and what investors should track
The direction of risk here is clear: sustained disruption through the Strait of Hormuz is a headwind for rate cuts and a source of volatility across asset classes globally. What remains uncertain is the magnitude and duration, and that depends on developments you can monitor in real time.
Four indicator categories form your monitoring framework:
- Hormuz transit data and ceasefire developments. Watch the frequency and severity of attacks, shipping volume data, and any durable ceasefire or naval security arrangement that could restore normal transit
- Brent crude price movements. Sustained moves into the high $80s, $90s, or above represent the range historically associated with broader inflation shocks
- Central bank communications. Any change in how the Fed or RBA describes inflation risks, references energy prices, or signals the timing and conditionality of future cuts. The Fed’s 29 July decision is the immediate focal point
- Australian Q2 CPI. The 29 July release, particularly the trimmed mean figure, will shape the RBA’s August meeting deliberations
The heads of the International Monetary Fund (IMF), World Bank, and World Trade Organisation (WTO) have already flagged slower growth and higher inflation in some economies due to the Middle East war and associated energy disruptions.
The real danger is not a temporary CPI bump. It is a scenario where energy-driven price increases spill into broader inflation and expectations, forcing central banks to delay or dilute rate cuts, and in the worst case, reconsider further tightening. If you monitor these four categories, you will know before the consensus whether this shock is fading or compounding.
July 29 as a stress test for the rate-cut thesis
A single geographic chokepoint has rebuilt inflation risk fast enough to flip the rate-cut consensus and expose the fragility of asset valuations priced for a benign easing cycle. The chain runs from tankers stalled in a narrow waterway through every layer of the global economy: fuel costs, freight rates, consumer prices, inflation expectations, bond yields, and equity multiples.
The danger is not the oil price itself. It is the speed at which a geopolitical shock can reassemble inflation pressures that took years of restrictive policy to suppress.
The rate-cut thesis survives if the disruption resolves quickly, oil retraces, and inflation expectations stay anchored. It does not survive if Hormuz disruptions persist, energy costs embed in wage and pricing decisions, and central banks conclude the disinflationary window has closed before they could walk through it.
29 July delivers both the Fed decision and Australian Q2 CPI on the same day. For investors positioned for easing, that date is a stress test, not a formality.
This article is for informational purposes only and should not be considered financial advice. Investors should conduct their own research and consult with financial professionals before making investment decisions. These statements are speculative and subject to change based on market developments and company performance.