
The yen is trading near 40-year lows. Japanese equities are outpacing most major global benchmarks. Put those two facts next to each other, and the instinctive reaction is that one of them must be wrong.
The data says otherwise. The MSCI Japan Index gained 15.7% in US dollar terms from 31 December 2025 through 16 July 2026, according to FactSet. The MSCI World Index returned 10.4% over the same period. That outperformance arrived while USD/JPY hovered near 162, a level that prices the yen at its weakest in roughly four decades. This is not a minor divergence or a short-term anomaly. It is a sustained, data-confirmed decoupling between currency weakness and equity strength that demands a structural explanation.
What this piece gives you is a framework for separating FX noise from equity signal, using Japan’s 2026 data as the proving ground. The analytical lens here is not Japan-specific. It applies to any developed market where currency and equity markets appear to be telling contradictory stories.
The numbers that should not make sense together
The scale of the divergence is worth sitting with before reaching for explanations.
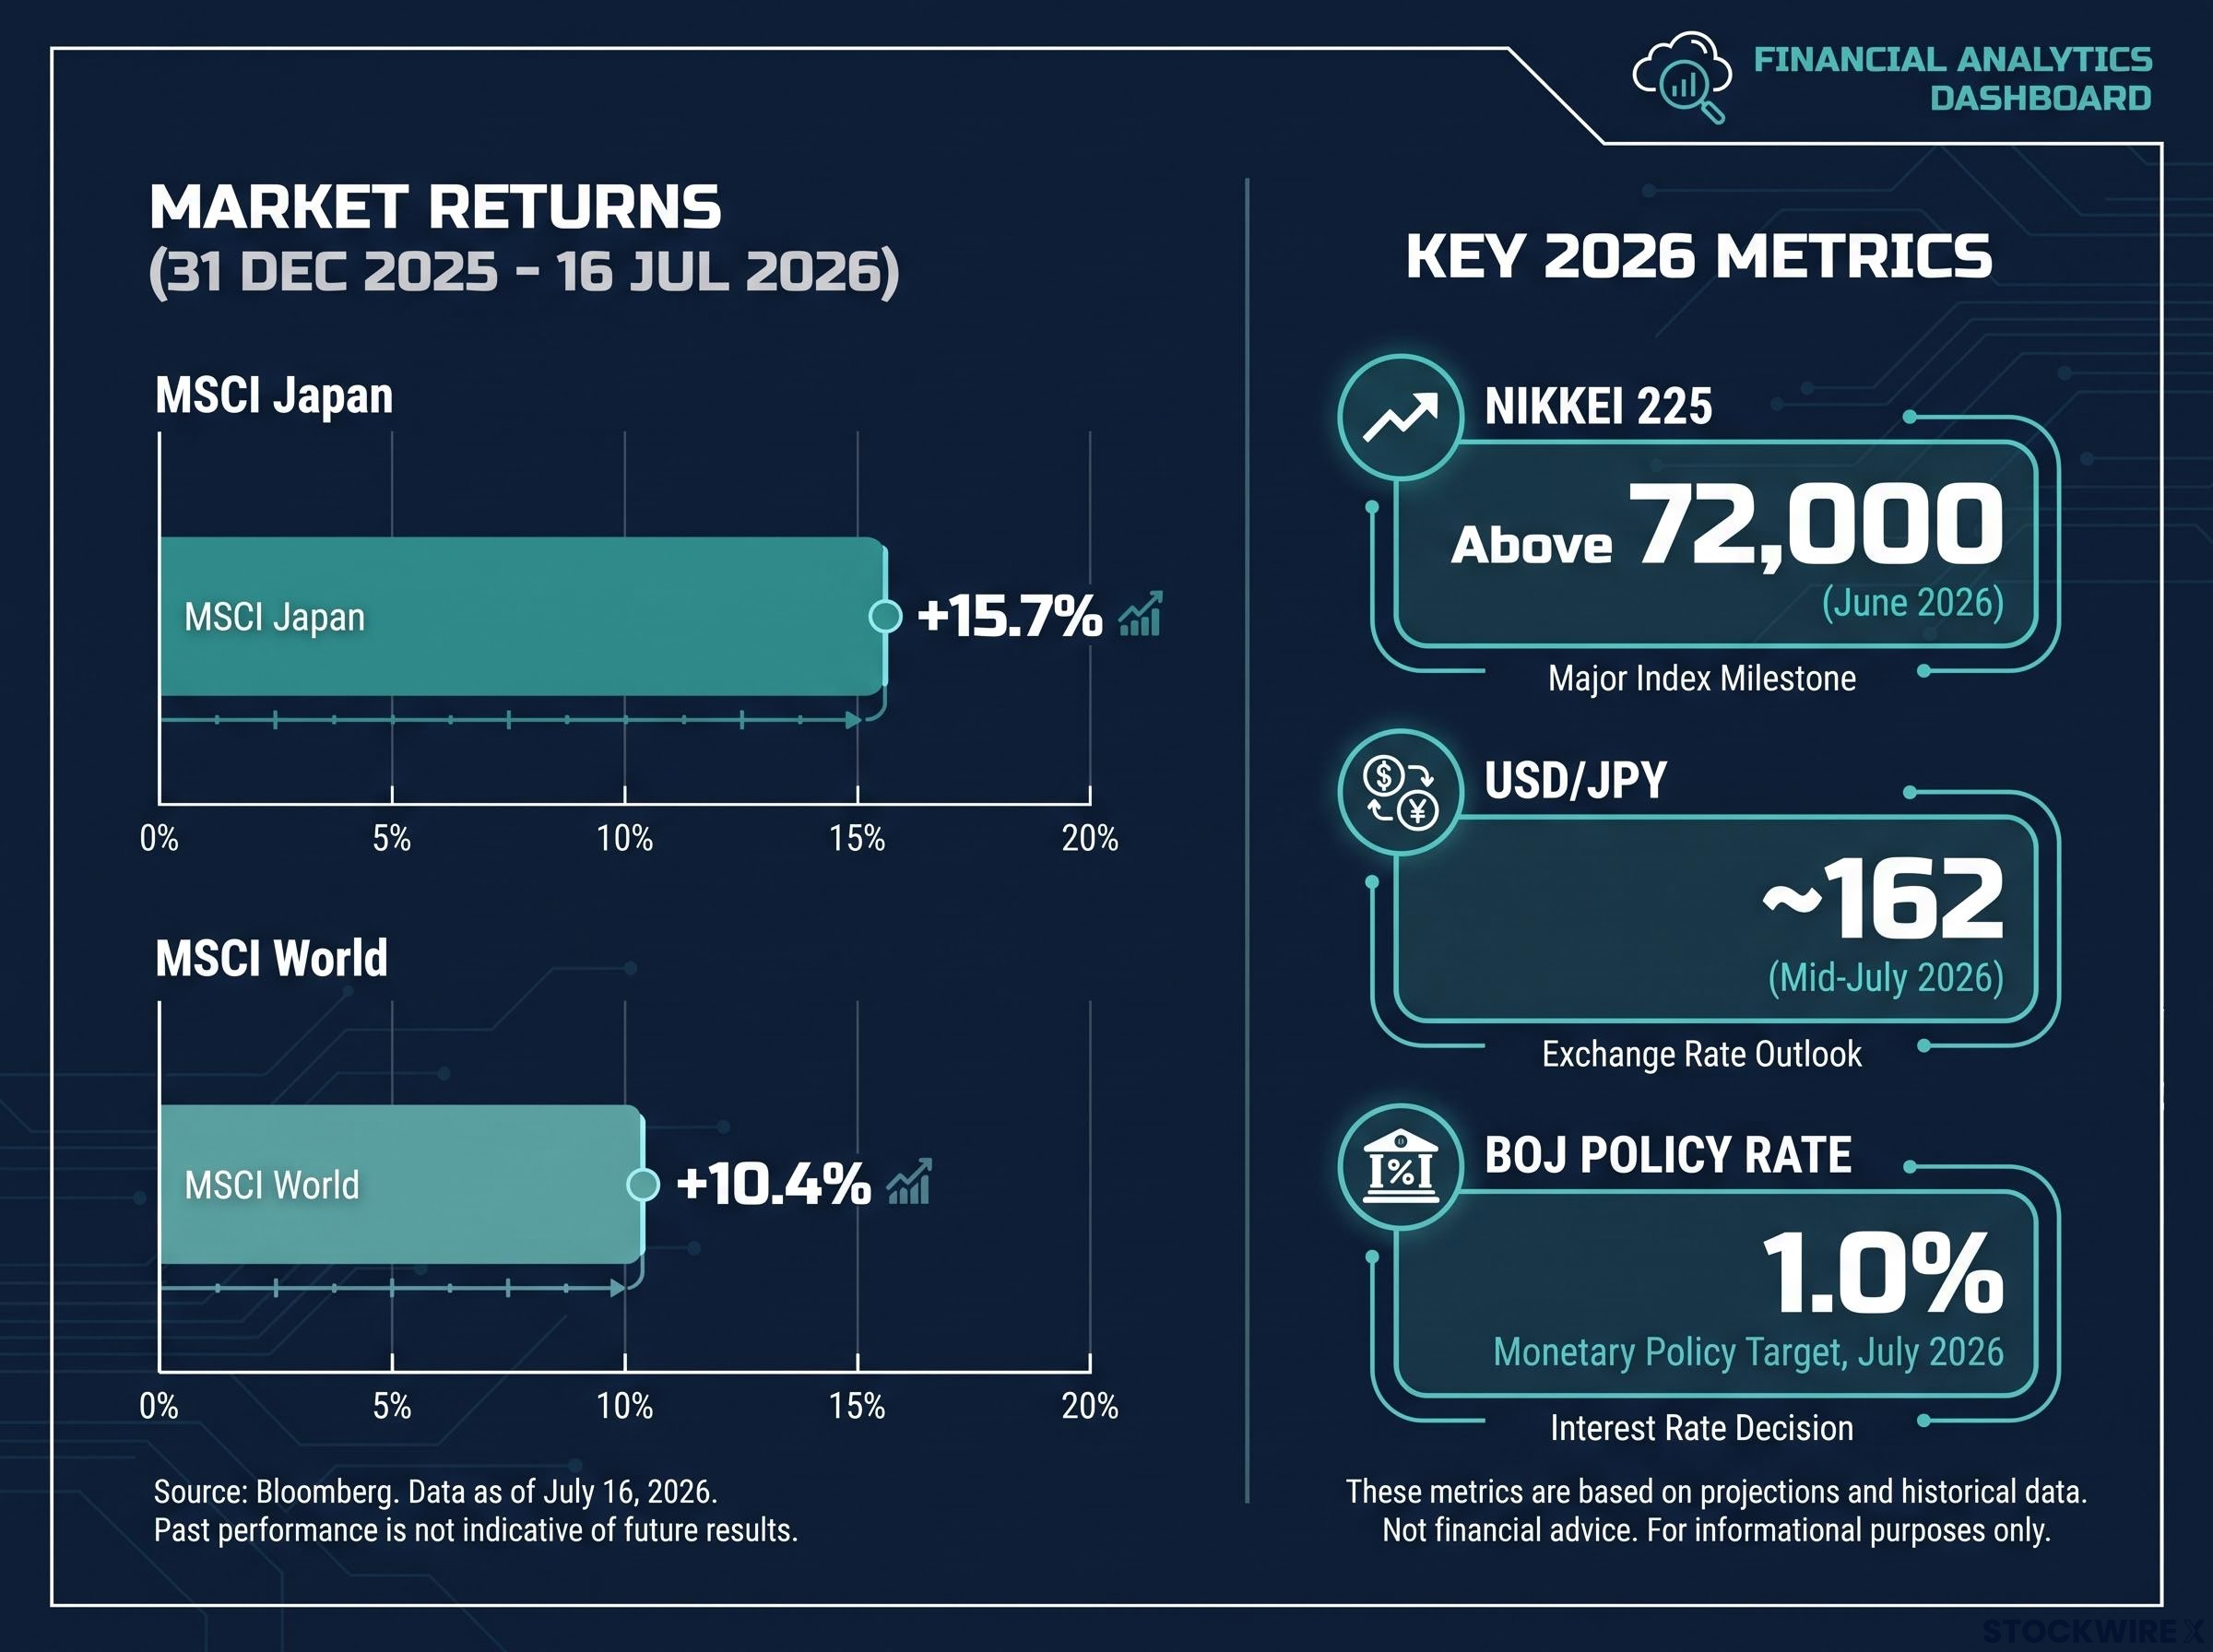
| Metric | Value | Period |
|---|---|---|
| MSCI Japan return (USD terms) | +15.7% | 31 Dec 2025 – 16 Jul 2026 |
| MSCI World return | +10.4% | Same period |
| Nikkei 225 all-time high | Above 72,000 | June 2026 |
| USD/JPY | ~162 | Mid-July 2026 |
| BOJ policy rate | 1.0% | Current (highest in decades) |
The Nikkei 225 printed an all-time high above 72,000 in June 2026. Overseas investors poured capital into Japanese equities at a record pace through the opening six months of the year, according to Tokyo Stock Exchange data. Markets have described the rally under the banner of the “Takaichi trade,” linking it to Prime Minister Sanae Takaichi’s pro-market agenda and decisive election victory in February 2026.
Traditional FX-equity correlation would predict that a currency falling to multi-decade lows drags equity returns with it, particularly in dollar terms. What the 2026 data is telling you is that currency and equity markets in Japan are pricing fundamentally different things. That is the puzzle this analysis exists to solve.
The bearish consensus on Japan in 2026 rested on sovereign debt fears, yen weakness, and commodity supply disruptions, but institutional assessments from the IMF, OECD, and Moody’s characterised sovereign risk as a long-run consideration rather than an imminent structural threat, a framing that helps explain why capital inflows accelerated even as the negative narrative dominated financial media.
When big ASX news breaks, our subscribers know first
What a weak yen actually does to corporate earnings
The mechanism is straightforward once you see it clearly.
Japan’s largest listed companies are globally exposed. Toyota, Honda, and their peers generate substantial revenue in US dollars, euros, and other currencies. When the yen weakens, translating those foreign-currency revenues back into yen lifts reported profits and operating margins mechanically. Each incremental move lower in the yen against the dollar boosts operating profits for the globally exposed companies that dominate the TOPIX 500. Both Toyota and Honda have reported record earnings in 2026, explicitly citing favourable exchange rates as a contributor.
This is where the second layer matters for anyone looking at Japan from outside. Many foreign investors hold yen-hedged equity positions, using financial instruments to neutralise the currency risk while keeping the equity exposure. The hedging structure works through three components:
- Forward contracts that lock in an exchange rate for a future date, removing uncertainty on the currency leg of the trade
- Swap structures that allow investors to exchange yen-denominated obligations for dollar or euro ones, isolating the equity return
- Net FX exposure after hedging that approaches zero on the currency side while preserving full participation in yen-denominated earnings growth
The self-reinforcing dynamic: When foreign investors buy Japanese equities through hedged structures, the hedging activity itself generates yen selling. That selling contributes to further yen weakness, which in turn supports exporter earnings, which attracts more foreign capital. The cycle feeds itself.
For a global investor assessing Japan, the weak yen is functioning as a hidden subsidy to exporter earnings. Hedged exposure lets you capture that subsidy without carrying the full currency downside. Once you understand this mechanism, the equity rally stops looking irrational. It starts looking mechanical.
Why this is not a currency crisis, and why the distinction matters
A currency losing 40 years of value invites a specific fear: that the country is experiencing capital flight, the kind of unravelling that accompanies genuine crises. Japan’s 2026 does not fit that pattern, and the distinction is analytically critical.
The yen’s weakness is driven primarily by interest-rate differentials. A carry trade is a strategy where investors borrow in a low-yielding currency and deploy that capital into higher-yielding assets elsewhere. US interest rates remain elevated in absolute terms, making the dollar side of that trade attractive. Investors borrow cheaply in yen and invest in higher-yielding foreign assets, reinforcing yen weakness independently of what Japanese equities are doing.
The yen carry trade mechanics that sustain this dynamic are not new, but the scale in 2026 is exceptional: with the Fed’s target range still sitting roughly 2.5–2.75 percentage points above the BOJ policy rate, the arbitrage arithmetic remains compelling enough to generate persistent structural yen selling regardless of intervention firepower.
| Attribute | Japan (2026) | EM currency crisis (e.g. Turkey, Argentina) |
|---|---|---|
| Primary driver | Rate differentials and carry trade | Inflation, solvency fears, capital flight |
| Equity flow direction | Record inflows | Outflows |
| Bond flow direction | Stable to positive | Outflows |
| Capital flight present | No | Yes |
In Turkey and Argentina, currency weakness accompanied simultaneous exits from both equities and bonds, driven by inflation and sovereign solvency fears. In Japan, equity inflows have accelerated as the yen has weakened. Both domestic and international investors were net buyers of Japanese equities in 2026, directly contradicting the capital-flight pattern.
The Bank of Japan’s normalisation signal
The Bank of Japan has moved its policy rate to 1.0%, the highest level in decades. It ended negative rates and stepped away from rigid yield-curve control. This trajectory signals a return to conventional monetary policy after decades of extraordinary accommodation, not a policy error or panic response.
The Bank of Japan 2026 monetary policy statements confirm the institution’s step-by-step exit from negative rates and yield curve control, providing the official record of each rate decision that underpins the normalisation narrative attracting institutional capital to Japanese financials.
Rising domestic rates and a steeper yield curve in a developed market are typically interpreted as positive economic signals. They indicate the economy can sustain growth without extraordinary support. The short-term FX volatility this creates is a side effect of normalisation, not a symptom of distress. The carry trade dynamic means the yen’s weakness is a function of yield arithmetic, not a loss of confidence in Japan. For anyone positioning around this trade, that distinction determines whether the opportunity has further to run or is on borrowed time.
The structural forces actually driving inflows into Tokyo
Once you move past what the yen is not doing, the question becomes what is actively pulling capital into Japanese equities. The answer is not a single factor. Three distinct structural drivers are working simultaneously:
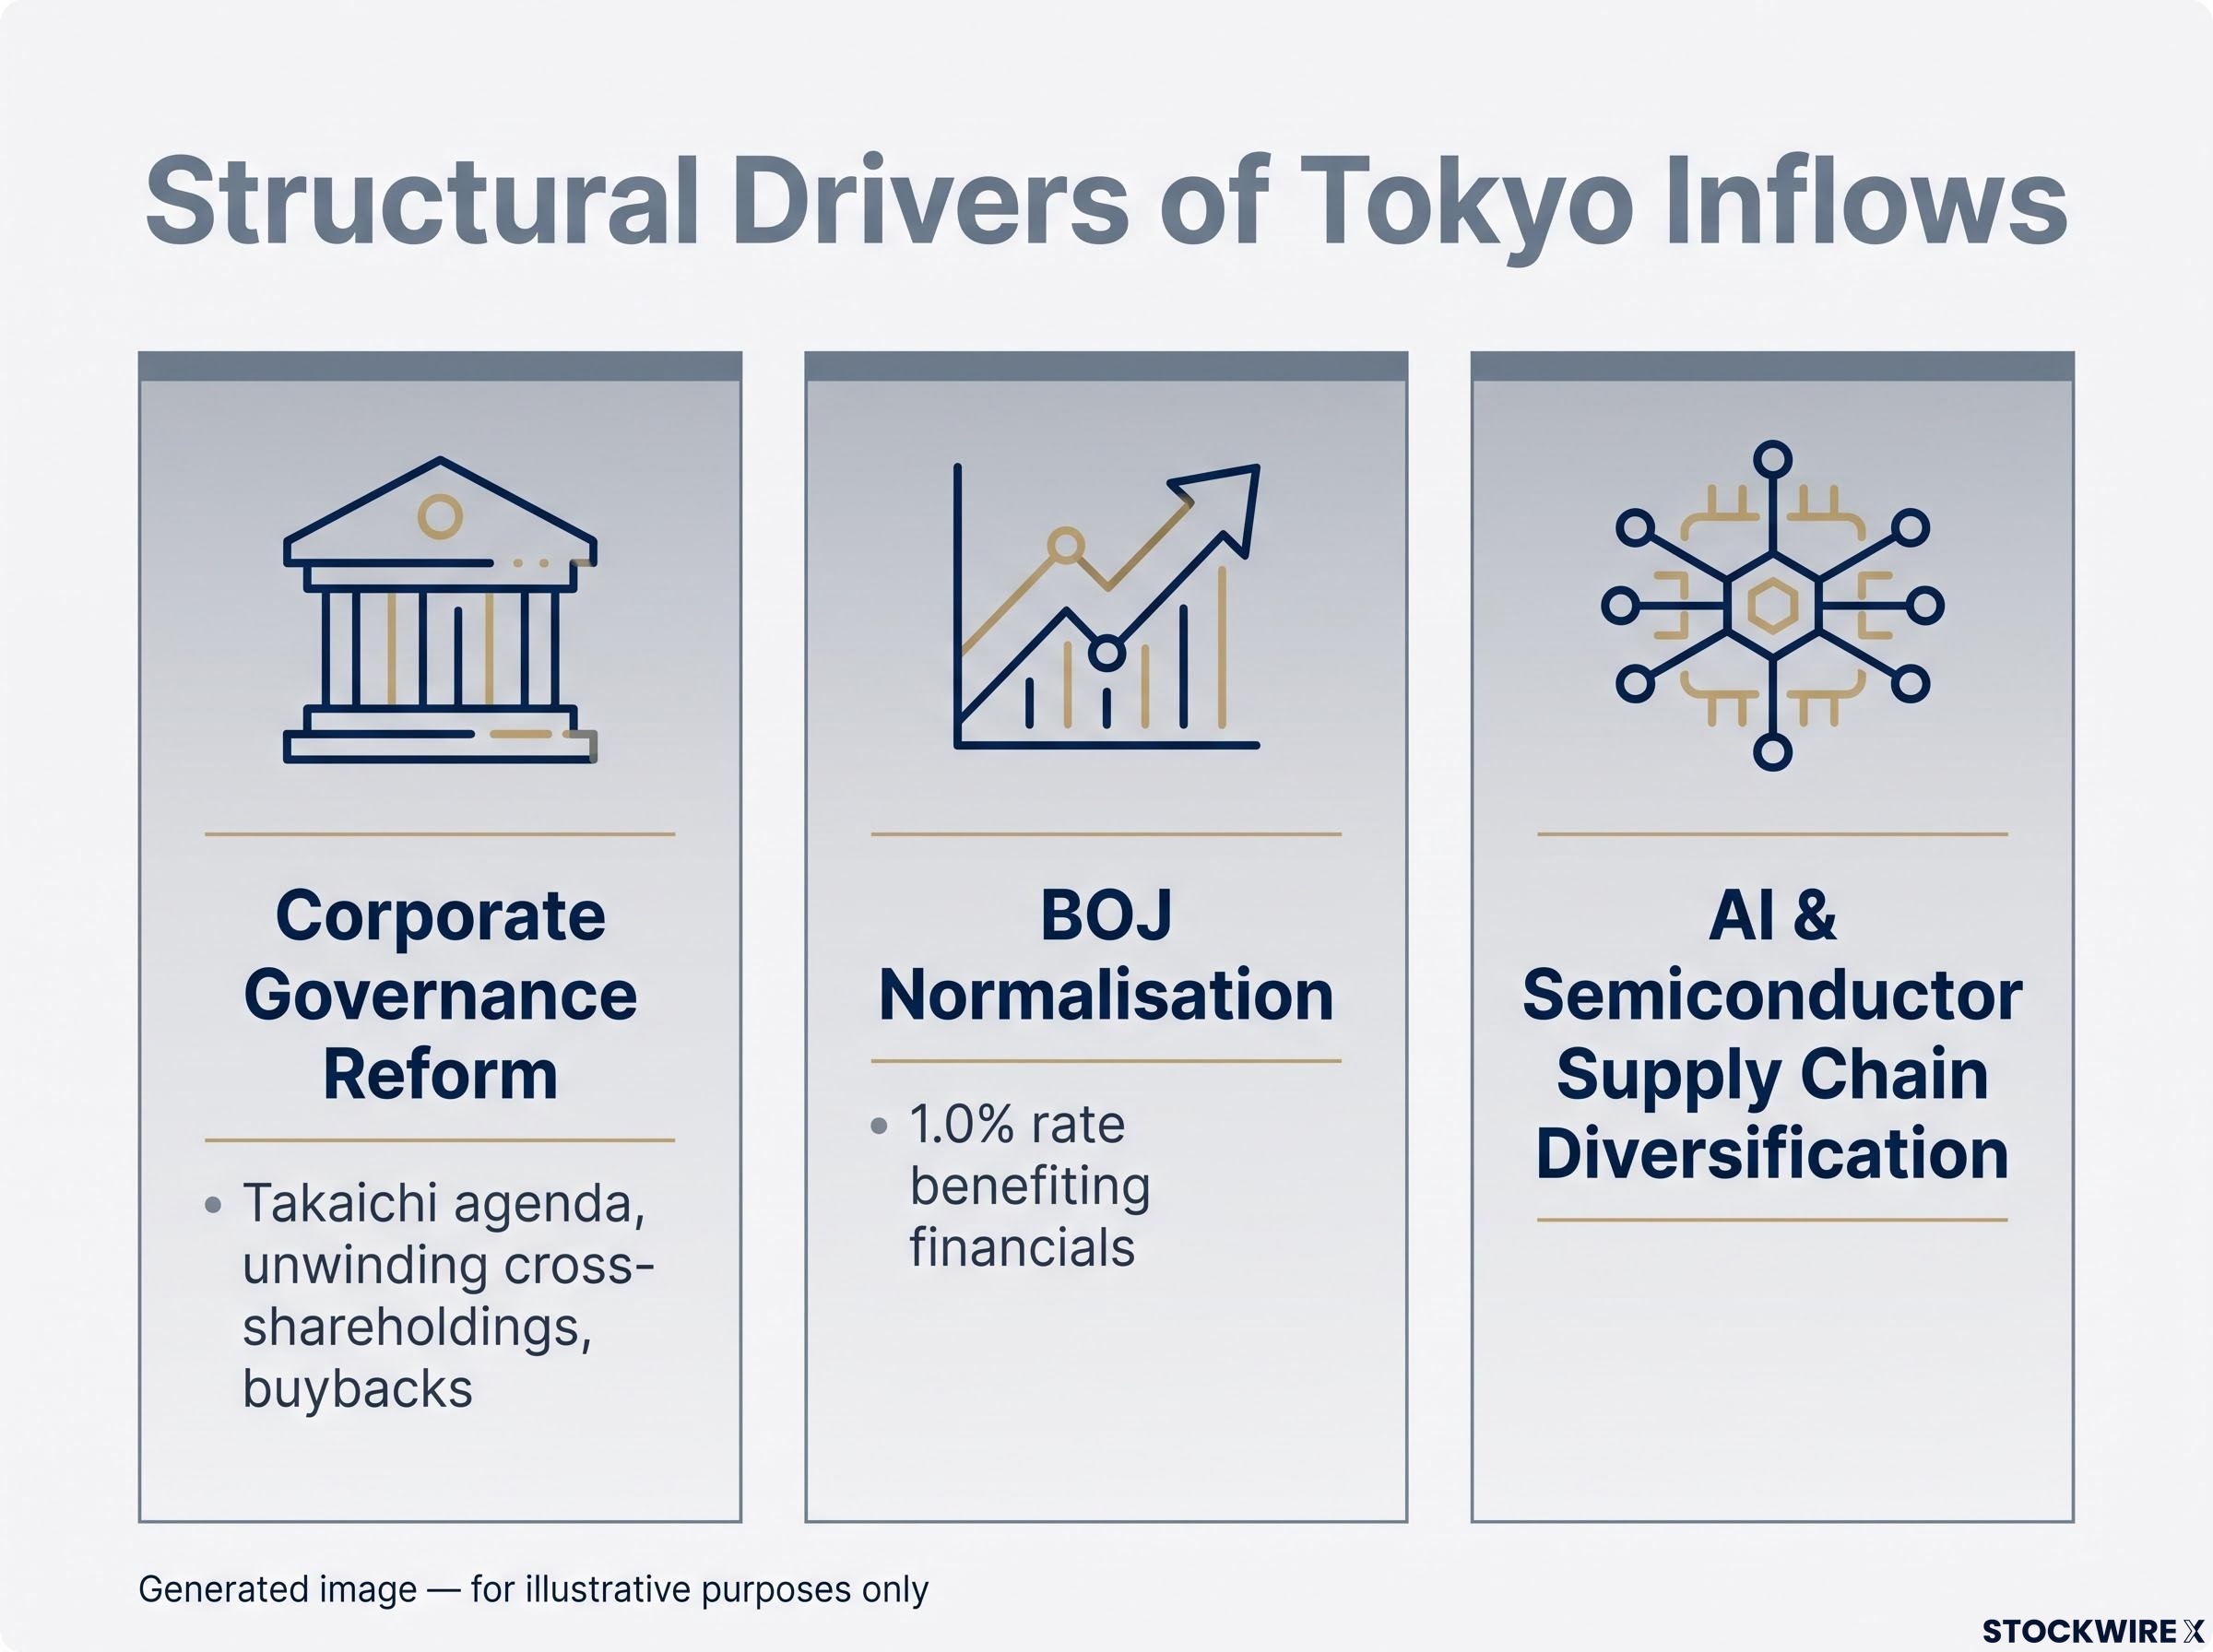
- Corporate governance reform: Building on frameworks established under earlier administrations and continued under Takaichi, Japanese companies are demonstrating better capital discipline, unwinding cross-shareholdings, increasing buybacks and dividends, and facing sustained pressure to improve return on equity. Steps to consolidate the budgeting process and limit the use of ad hoc supplementary spending packages have bolstered investor confidence in the reform programme. These changes attract long-horizon institutional capital rather than purely speculative flows.
Corporate governance reform at Japanese companies has produced measurable results since 2023, with the Tokyo Stock Exchange reporting that average price-to-book across the TOPIX has risen from 1.1x to 1.5x and average return on equity has climbed from 8.4% to approximately 9–10%, metrics that underpin the structural re-rating thesis.
- BOJ normalisation benefiting financials: As rates and long-term yields rise, Japanese banks and insurers earn wider net interest margins and operate in more normalised credit conditions. Improved loan spreads and expectations for better capital efficiency have lifted valuations across the financial sector, a direct beneficiary of the shift away from negative rates.
- AI and semiconductor supply chain diversification: Portfolio managers looking to spread their technology exposure more broadly have turned to Japan as a natural addition alongside existing US and Asian tech positions, adding further momentum to inflows.
Analysts describing why Japanese equities look attractive in 2026 emphasise the market’s role in the AI boom combined with more reasonable valuations than some US megacap names.
Japan’s role in the global AI and semiconductor supply chain
Japan’s listed companies include semiconductor equipment makers, precision component suppliers, and robotics and industrial automation manufacturers that sit deep in global supply chains. These companies offer a way to participate in AI and semiconductor demand without concentrating risk solely in the US, South Korea, or Taiwan.
The vulnerability is real, though. When the semiconductor sector hit turbulence earlier in 2026, Japanese stocks pulled back in tandem, demonstrating that exposure to this theme carries risk as well as reward. For a global investor building a diversified tech-cycle position, Japan’s 2026 equity market offers a combination of AI supply chain exposure, governance reform tailwinds, and financial sector normalisation that is not available in the same package elsewhere.
Where the thesis breaks down: risks the data cannot rule out
Every structural bull case has specific failure modes, and Japan’s is no exception. The risks here are not abstract disclaimers. They are identifiable variables with defined transmission mechanisms:
- BOJ overtightening: If the Bank of Japan tightens more aggressively than the real economy can absorb, exporter margin compression and demand-side damage could reverse the current dynamic. The 1.0% policy rate is the baseline; the question is how far and how fast it moves from here.
- Imported inflation from prolonged yen weakness: As import costs rise and household purchasing power erodes, the currency tailwind for equities can diminish or reverse. Traders have discussed extreme scenarios, including the yen sliding toward 200 per dollar, as a threshold where currency damage overwhelms earnings tailwinds.
- Technology cycle reversal: A deeper downturn in the semiconductor sector would hit Japan’s tech-adjacent exporters and could trigger an unwind of diversification trades into Tokyo. The temporary pullback already demonstrated this vulnerability in miniature.
- Reform implementation stall: Investor enthusiasm for the governance and fiscal reform agenda depends on real follow-through. If progress stalls under the current administration, the structural re-rating fades regardless of where the yen trades.
The correlation between yen moves and equity direction has progressively weakened through Q2 2026, illustrating the decoupling but also signalling that further yen weakness may offer diminishing equity support. These risks are not reasons to dismiss the thesis. They are inputs to a monitoring framework: track BOJ rate decisions, yen levels relative to import inflation data, and governance reform implementation as the three variables that determine whether the 2026 dynamic extends or reverses.
For investors wanting a structured monitoring framework, our deep-dive into yen carry unwind signals maps the three conditions that preceded the 2024 carry unwind episode and shows which of those signals were already active in mid-2026.
What Japan’s 2026 tells you about reading developed markets
The Japan case illustrates a principle that extends well beyond Tokyo.
In deep, liquid developed markets where institutional investors are active participants, currency and equity markets are capable of reflecting different underlying fundamentals for sustained periods, provided the currency’s trajectory is driven by mechanical factors rather than a loss of confidence. Japan’s deep liquidity, institutional hedging capacity, and real earnings visibility are the infrastructure that enables this decoupling. In thinner or dollarised emerging markets, the same divergence is far less likely to persist.
The more useful analytical framework is a two-question diagnostic:
- What is actually driving the currency move? In Japan’s case: rate differentials, carry trade mechanics, and hedging flows from equity investors themselves.
- Where is capital actually flowing? In Japan’s case: into equities, driven by earnings support, policy normalisation, governance reform, and tech supply chain exposure.
The core principle: Currency weakness in a developed market is not automatically an equity alarm bell when the FX move is mechanical rather than confidence-driven. Treating FX and equity signals as a single unified risk indicator produces a misleading picture.
The next time a developed market currency weakens sharply, the first question is not “are equities next?” It is: what is driving the currency, and what are equities pricing independently? Japan in 2026 is the case study for why those are different questions.
What the 2026 divergence settles, and what it leaves open
The paradox has a rational, three-part explanation. The weak yen inflates exporter earnings mechanically. The currency’s slide reflects carry trade arithmetic and rate differentials, not capital flight. And structural inflows, driven by governance reform, financial sector normalisation, and AI supply chain positioning, are pulling capital into Tokyo on their own terms.
Investors who applied a blunt FX-equals-risk heuristic missed the 2026 Japan trade. The framework that fits the evidence separates currency drivers from equity drivers and asks whether they are structurally connected or structurally distinct.
What remains open is whether the dynamic extends. That depends on three variables: the BOJ’s rate path, yen levels relative to imported inflation thresholds, and whether governance reform implementation continues at the pace that justified the re-rating. None of those are settled. Monitoring them is the practical takeaway for anyone with ongoing exposure to, or interest in, Japanese equities.
This article is for informational purposes only and should not be considered financial advice. Investors should conduct their own research and consult with financial professionals before making investment decisions. Past performance does not guarantee future results. Financial projections are subject to market conditions and various risk factors.