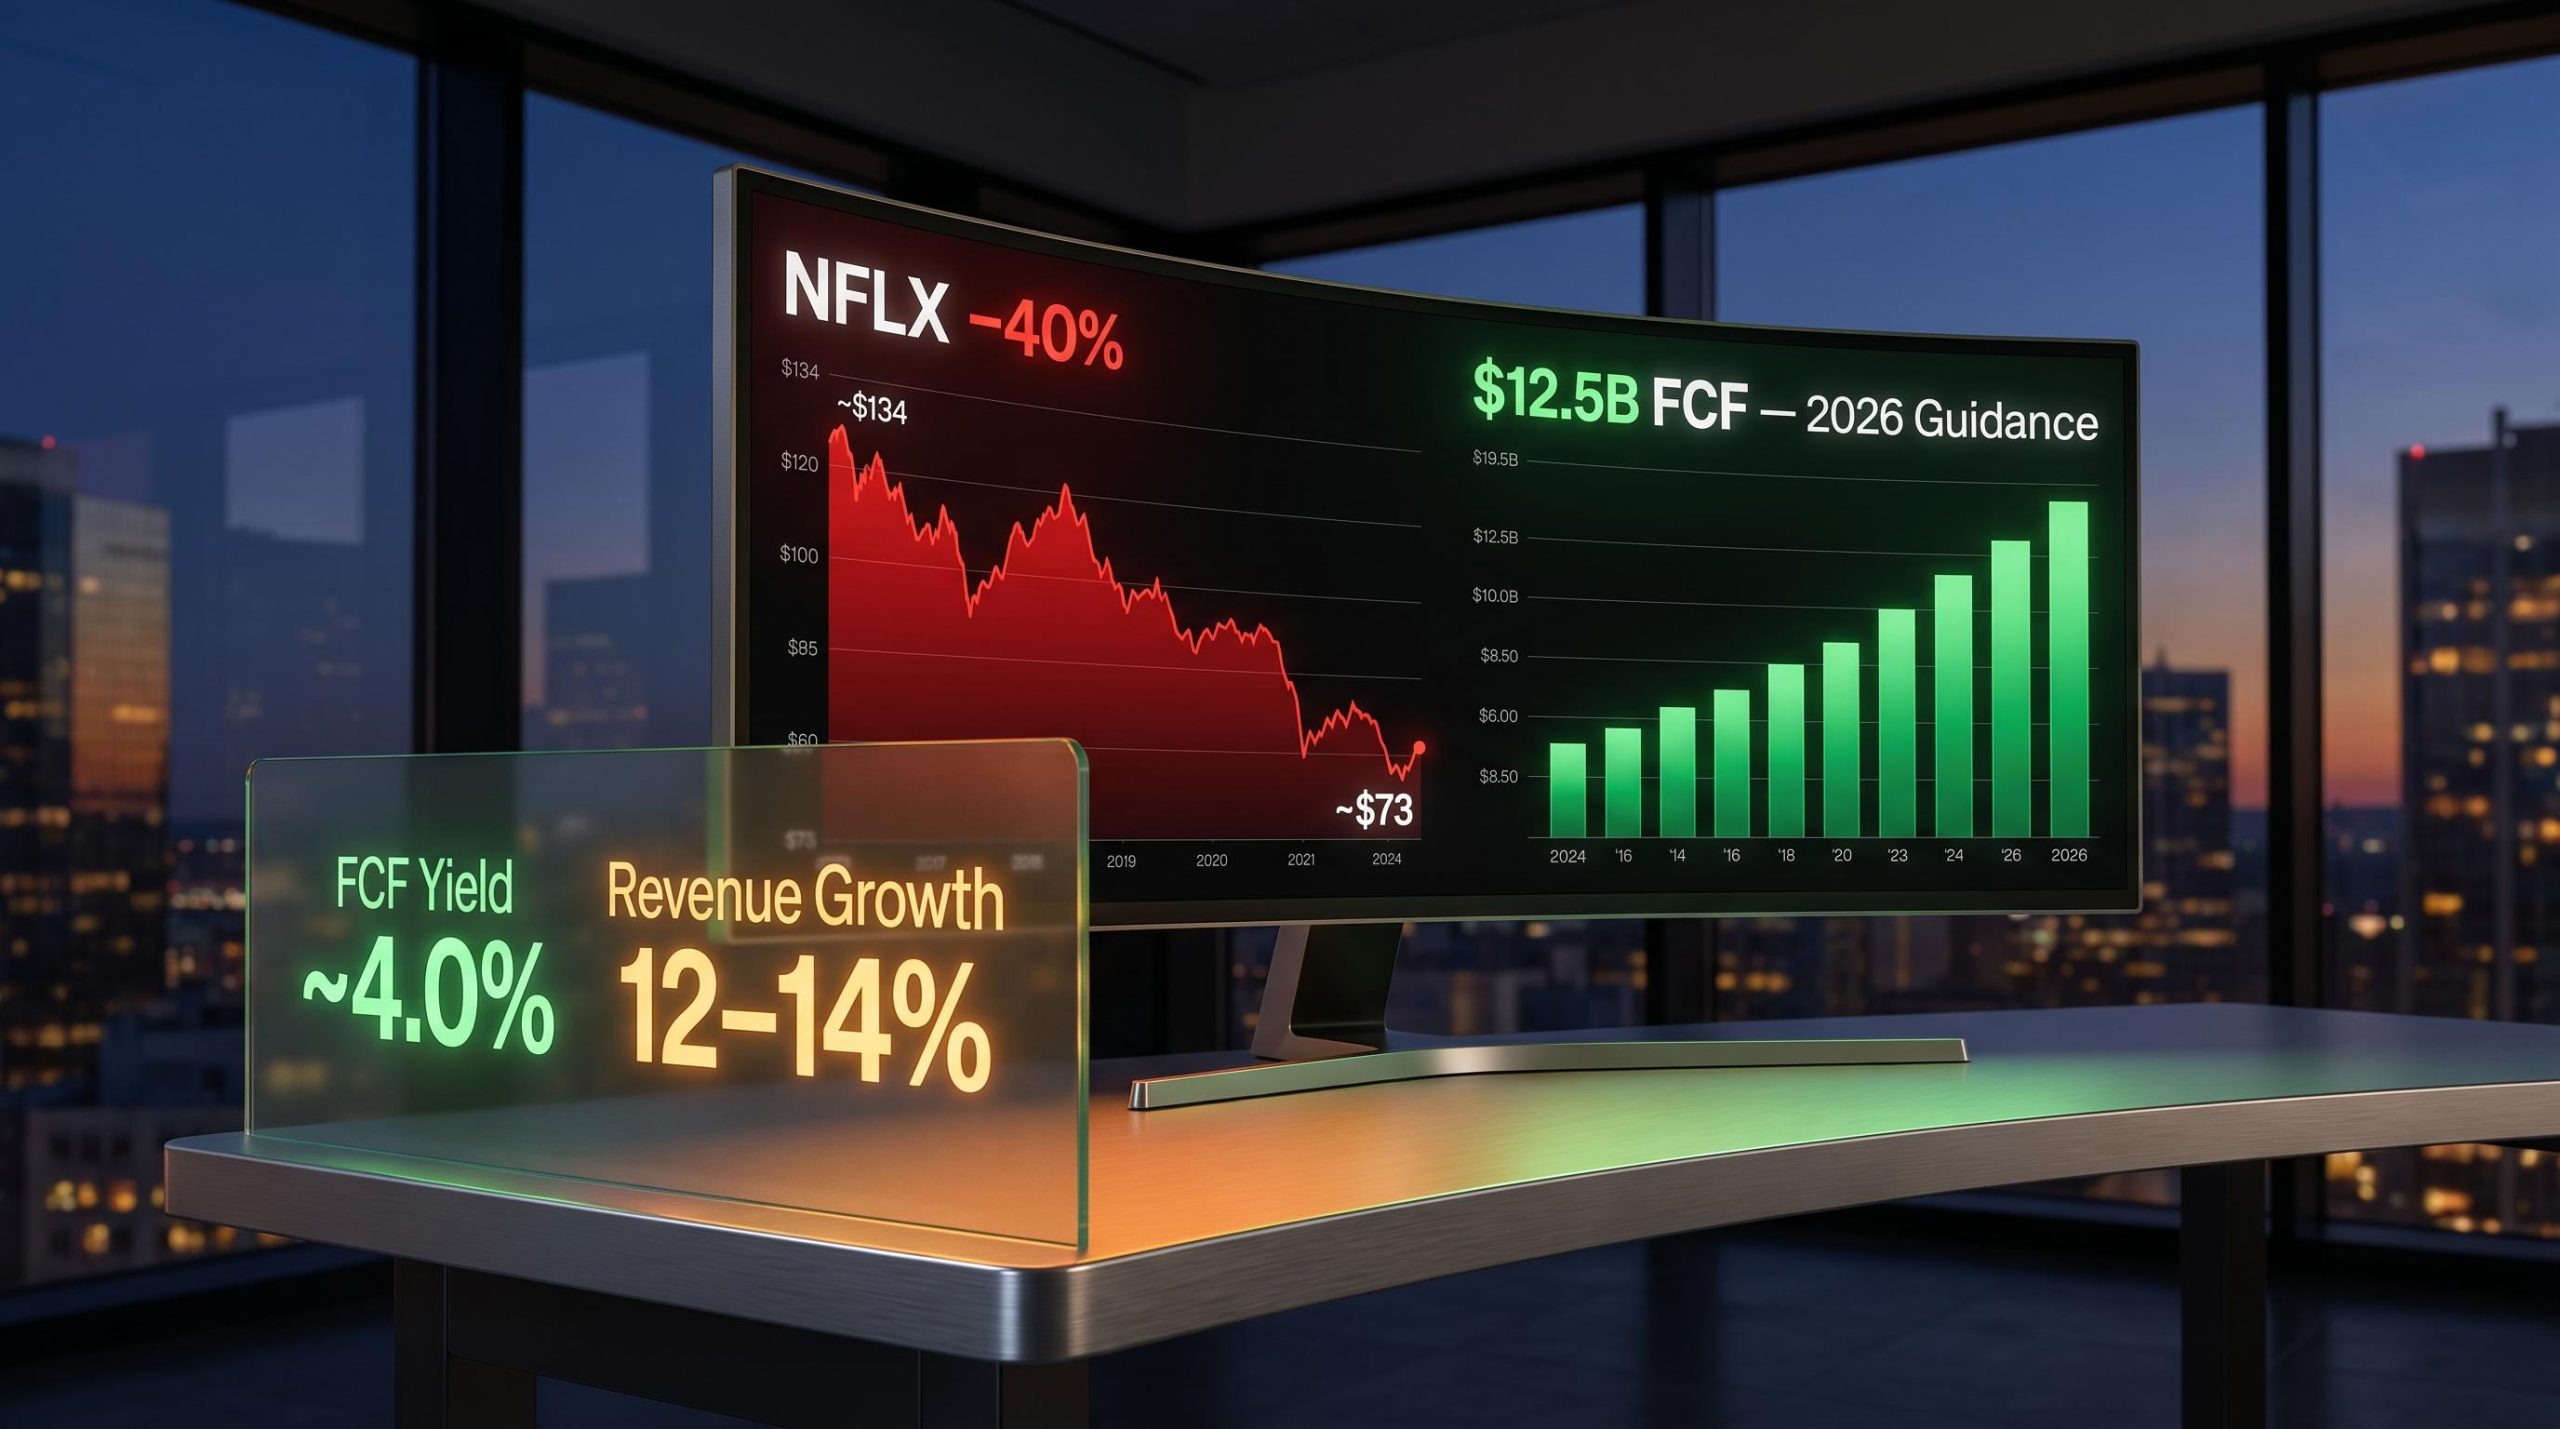
Netflix posted its strongest free cash flow in company history in 2026, guiding to approximately $12.5 billion for the full year. Over the same trailing twelve months, the stock shed roughly 40% of its value.
That dissonance is not a contradiction. It is a category reassignment. The market stopped pricing Netflix as a hyper-growth compounder and started pricing it as a mature, cash-generating media platform. The share price did not fall because the business deteriorated. It fell because the premium the market was willing to pay for 15-20% revenue growth evaporated once growth decelerated into the low teens. For investors evaluating the stock today, this distinction changes the entire analytical lens.
Here is the framework, the live numbers, and the moat assessment you need to form your own view on whether Netflix at current prices represents a reasonable allocation or a value trap in disguise.
The 40% decline that happened while the business got stronger
Start with the facts that make this situation uncomfortable.
Netflix shares have fallen approximately 40-42% from their 2025 all-time high near $134, trading around $73 in mid-July 2026. The decline included a 7% single-day drop following Q2 earnings. Market capitalisation now sits at roughly $310-320 billion.
None of the operating numbers explain that drawdown:
- Q1 2026 revenue grew 16% year over year to $12.25 billion
- Global paid memberships exceeded 325 million
- Full-year 2026 revenue guidance stands at $50.7-$51.7 billion, implying 12-14% growth (11-13% on an FX-neutral basis)
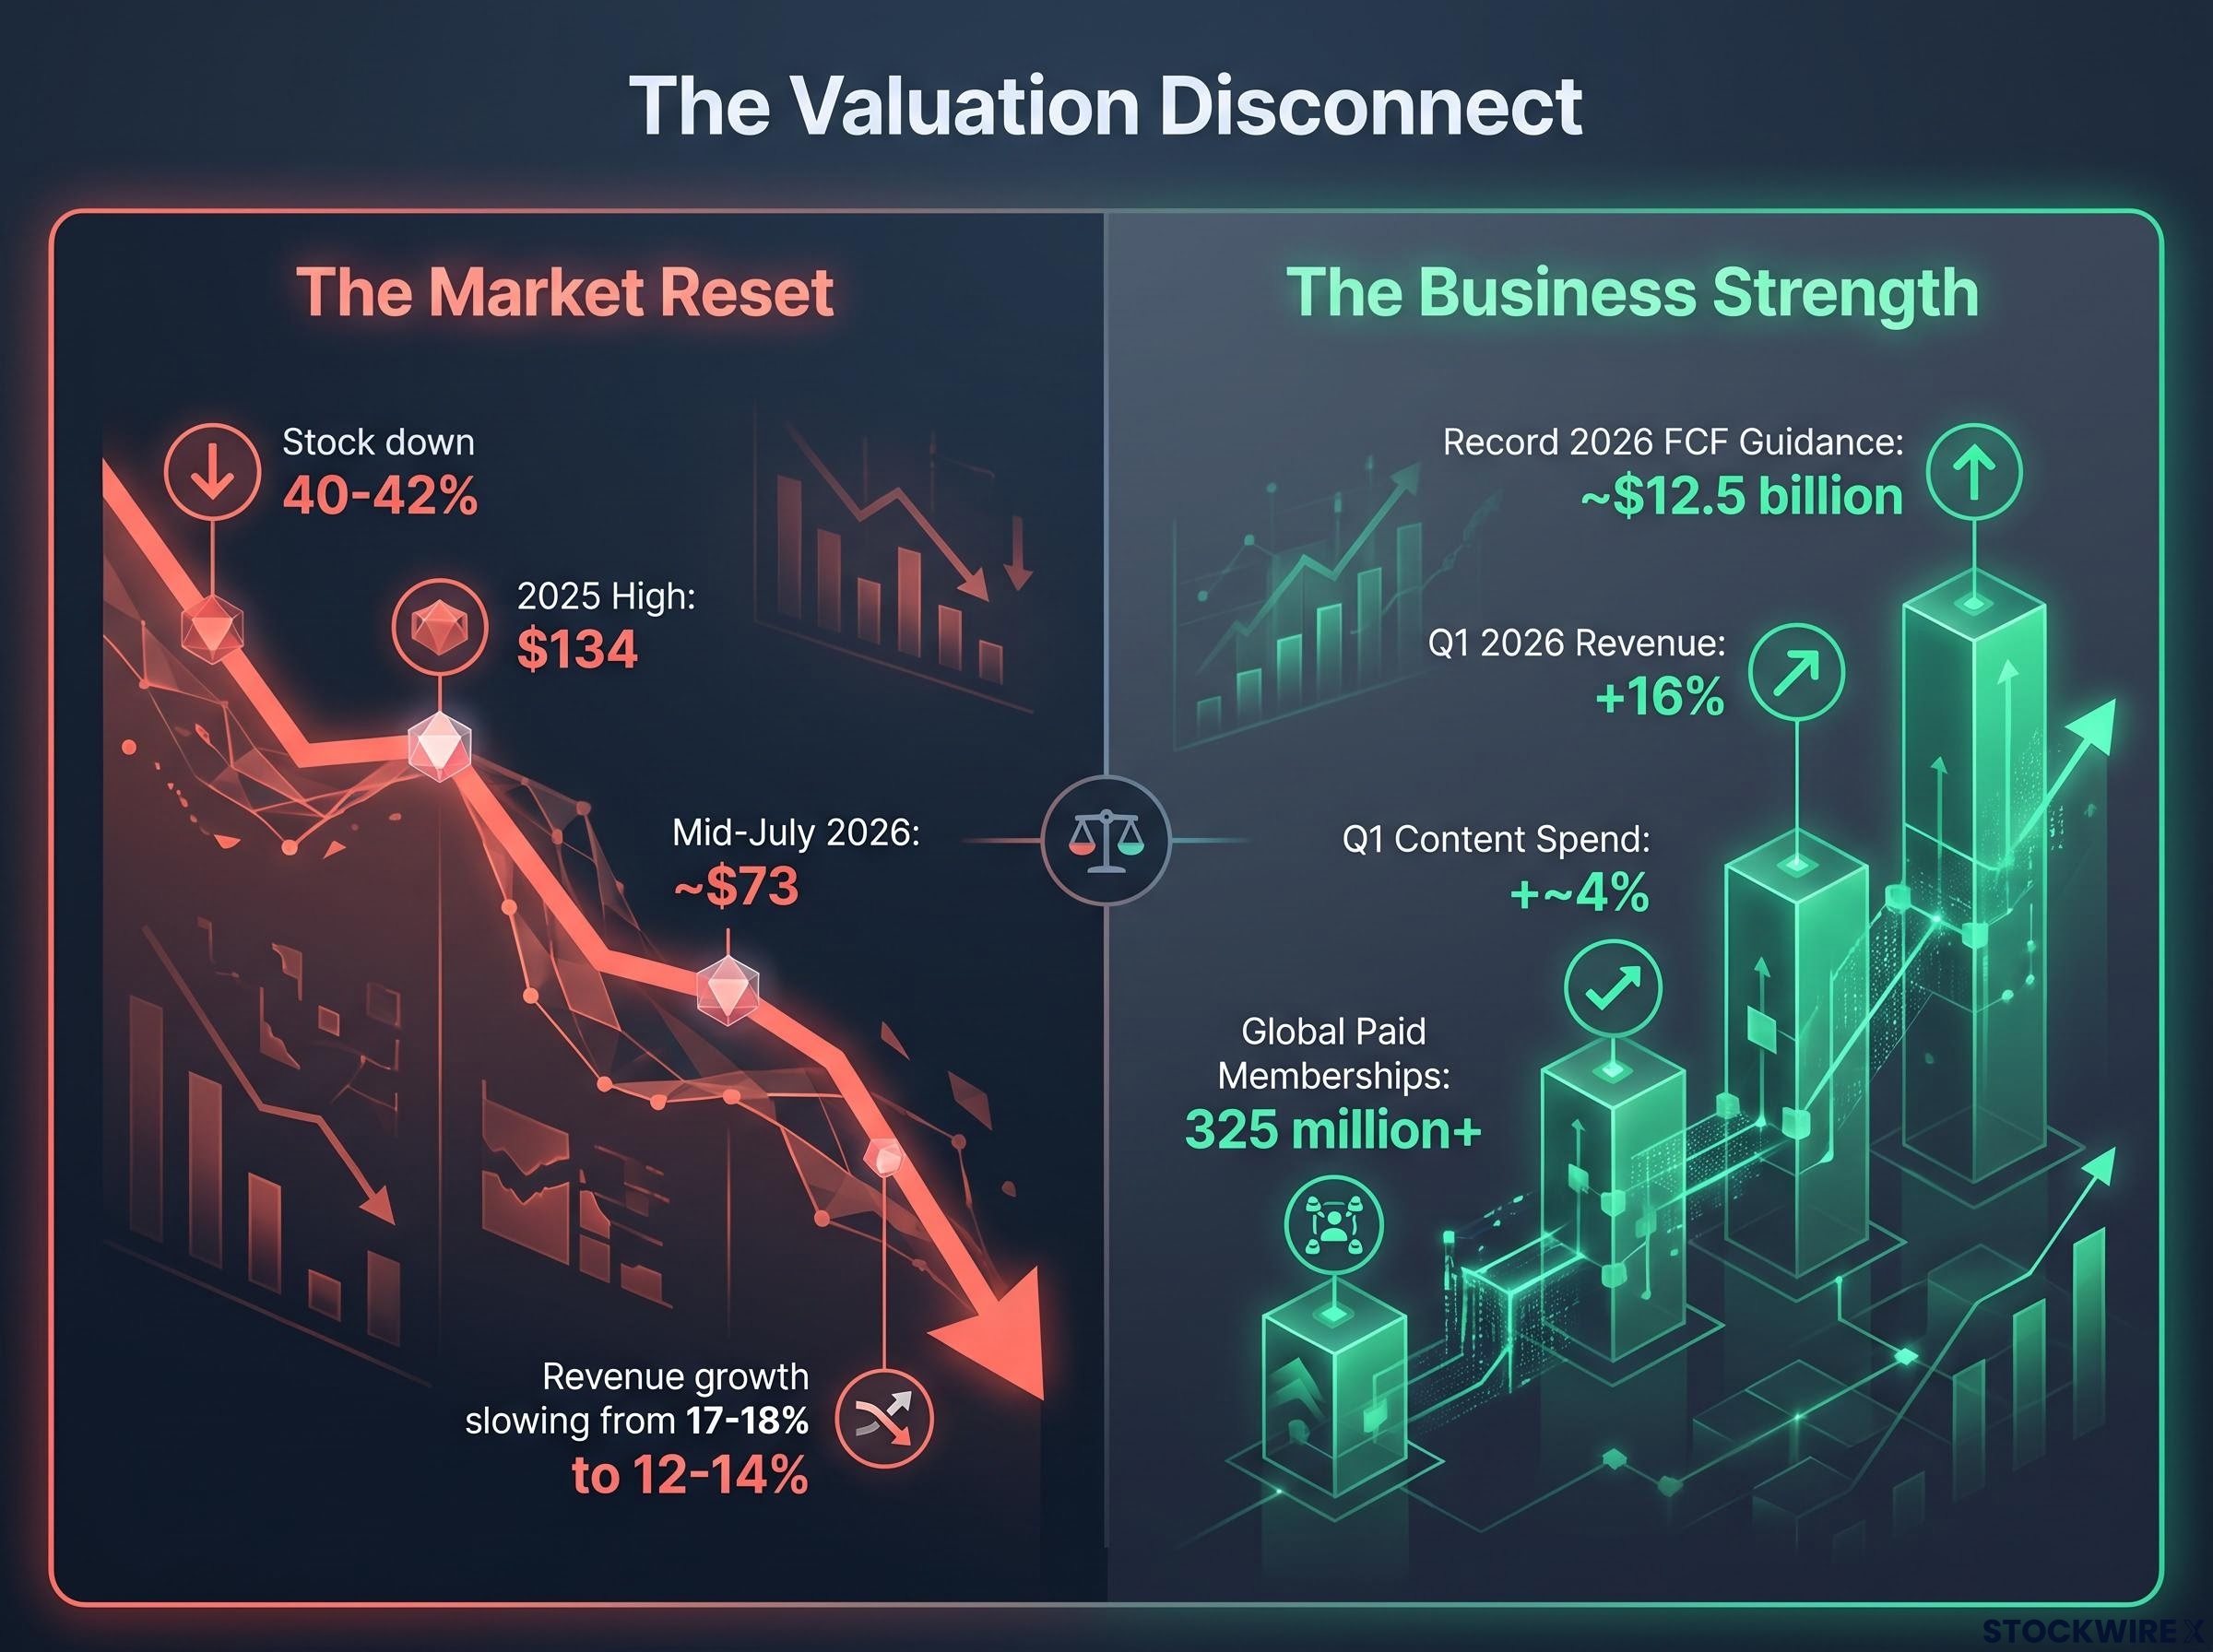
The cause is expectation deceleration. Revenue growth has come down from approximately 17-18% in prior years to a projected 12-14%. That moderation has repositioned Netflix away from the highest-multiple growth bracket and into a category where investors apply a very different valuation discipline.
Expectation deceleration is the dominant repricing mechanism at work, and four distinct forces compounded its effect on the share price: slowing subscriber net adds, governance uncertainty following Reed Hastings stepping back from the board, a failed acquisition attempt that raised capital allocation concerns, and sector rotation away from steady compounders toward AI-linked names.
Morningstar now views Netflix as fairly valued around the high $70s, assigning it a narrow moat and noting that outsize growth expectations are no longer priced into the stock.
The growth deceleration from 17-18% to 12-14% is not a crisis signal. It is a category signal. Understanding which one it is determines whether the current share price looks like a discount or a fair reset.
When big ASX news breaks, our subscribers know first
What $12.5 billion in free cash flow actually tells you about the business
For a content-heavy business with large non-cash amortisation charges, reported earnings per share can be a noisy measure of what the company actually generates for shareholders. Free cash flow (FCF), the cash left after all operating expenses and capital spending, captures what the business truly produces. It is now the correct analytical lens for Netflix.
The operating leverage driving the FCF surge is striking. In the most recent reported period, revenue grew approximately 16% while cash content spend rose only approximately 4%. That gap delivered an incremental margin of roughly 47%, lifting FCF from approximately $6.9 billion to $9.5 billion before Netflix raised its full-year 2026 guidance to approximately $12.5 billion (up from a prior $11 billion target).
The yield calculation makes the investment case concrete. Taking the $12.5 billion FCF guidance against a market capitalisation of approximately $320 billion produces a cash-on-cash yield of roughly 3.9-4.0%. That is comparable to the current 10-year U.S. Treasury yield, but it comes with business risk and potential growth attached. Unlike a bond, Netflix’s cash flows are expected to grow in real terms.
| Metric | Value | Analyst implication |
|---|---|---|
| FCF guidance (2026) | ~$12.5 billion | Strongest cash generation in company history |
| FCF yield at current market cap | ~3.9-4.0% | Comparable to 10-year Treasury, but with growth |
| Implied FCF multiple | ~23-27x | Premium to mature media; discount to prior growth multiple |
| FCF margins | Low-20s% | High cash conversion even as growth moderates |
| Revenue vs. content spend growth | 16% vs. ~4% | Operating leverage widening; content discipline intact |
- Non-recurring item to flag: The 2026 FCF guidance includes a $2.8 billion after-tax breakup fee paid by Paramount to Netflix in connection with a terminated transaction. This strengthens the near-term cash position but is not structural FCF. Strip it out and the underlying generation is still north of $9 billion, well above prior years.
A 4% FCF yield with 12-14% near-term revenue growth is a fundamentally different proposition from a bond. It is also fundamentally different from what Netflix was offering investors two years ago. Holding both comparisons simultaneously is how you assess whether this stock suits your portfolio.
Every FCF multiple embeds an implied growth rate, the minimum annual growth the business must sustain for investors to earn their target return, and at 23-27x FCF, Netflix’s current multiple encodes a specific and testable growth requirement that investors can calculate from publicly available inputs.
How to think about expected returns when the growth premium is gone
For a company that has moved past its hyper-growth phase, subscriber-count multiples and price-to-sales ratios tell you less than they used to. The more appropriate framework now is simpler: expected return roughly equals FCF yield plus sustainable growth.
Here is how to build it step by step:
- Start with cash generation. Use the $12.5 billion FCF guidance and benchmark FCF margins in the low-20s percent as a reference point.
- Calculate the FCF yield. FCF divided by current market cap gives you today’s cash-on-cash yield: approximately 4%.
- Estimate sustainable growth. Management guides 12-14% revenue growth near term, but realistically that decelerates to approximately 5-10% over a 5-10 year horizon as the subscriber base matures.
- Add them for an expected return range. Combining the FCF yield with the sustainable growth estimate produces an indicative annualised return of roughly 9-14%, provided the valuation multiple remains broadly stable across the holding period.
- Stress-test the multiple. If the FCF multiple compresses from the current 23-27x to 15-20x, total returns face a meaningful headwind even with strong cash generation. If it expands to 30x or above, total returns get a significant tailwind.
- Overlay moat and competitive risks. Assess whether scale, international reach, advertising, and pricing power are strengthening or weakening, and how rivals could affect content costs and churn.
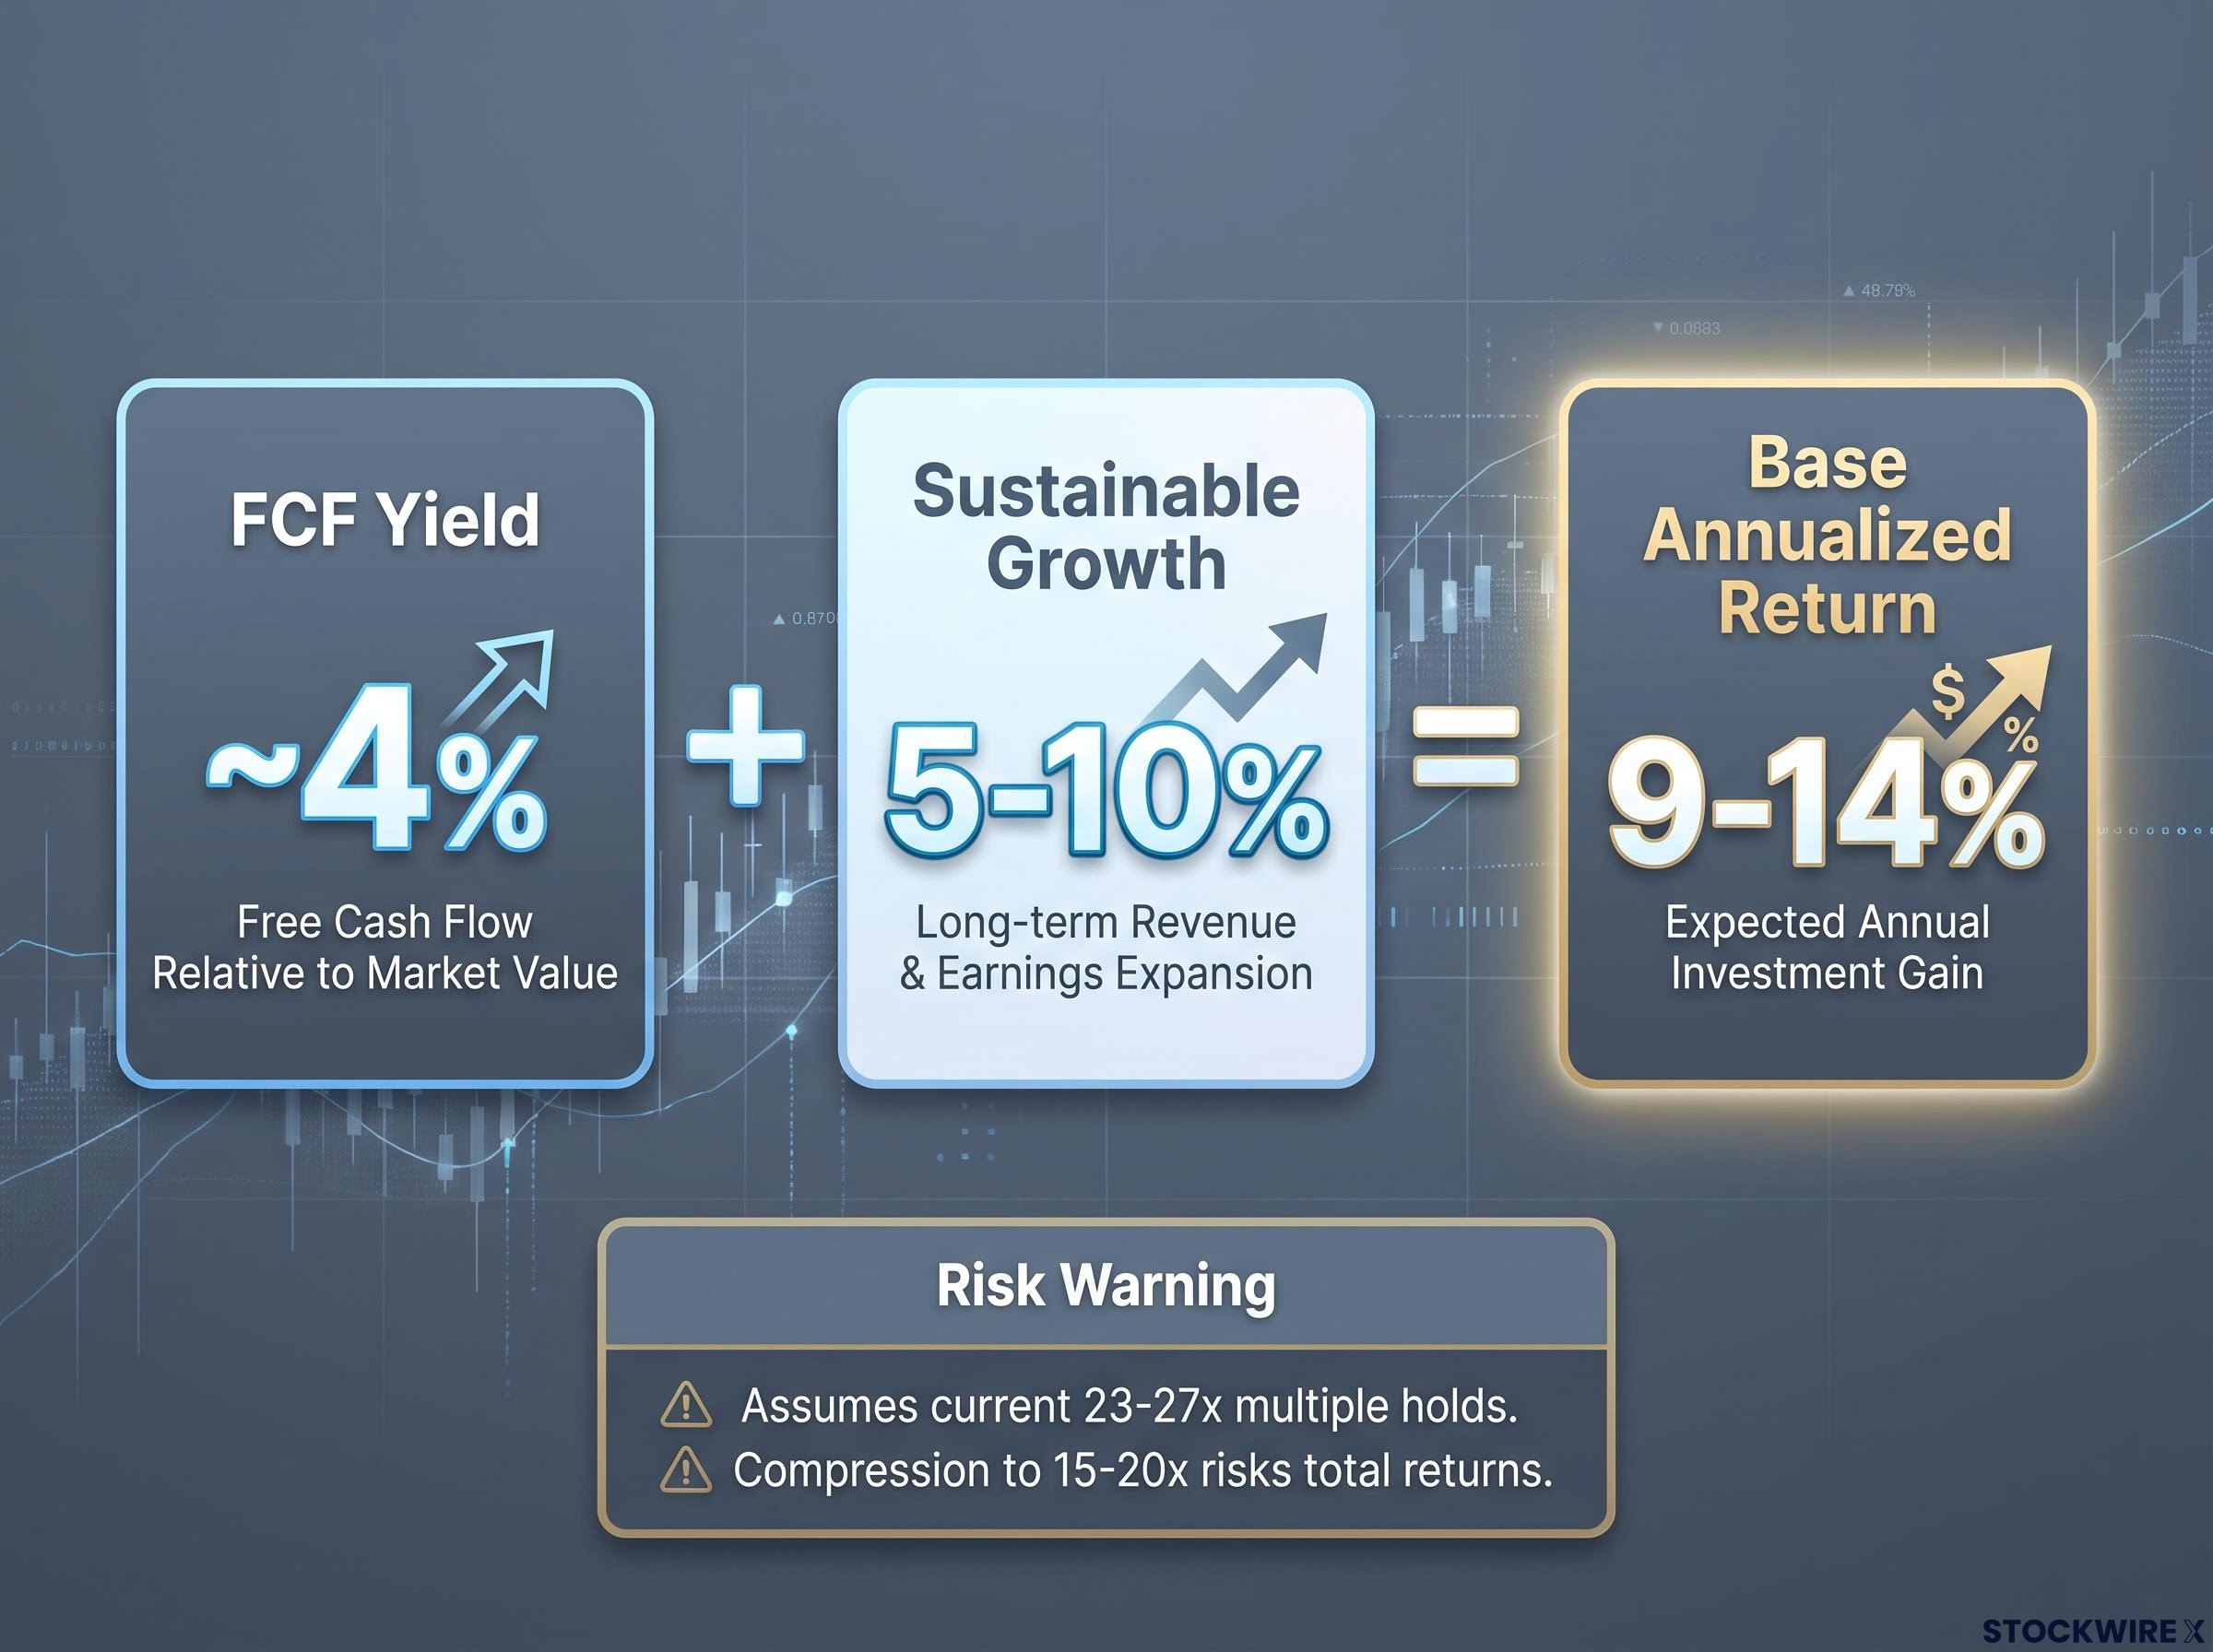
Approximately 4% FCF yield plus 5-10% sustainable growth equals a rough 9-14% annualised return in the base case, before multiple movement.
That 9-14% return band is only valid if the FCF multiple stays stable. That assumption is the single biggest variable you need to form a view on before committing capital. If the market decides a mature streamer deserves less than 20x FCF, the maths changes materially, even with strong underlying cash generation.
The moat question: what Netflix’s competitive advantages actually protect
The word “moat” gets used loosely. For Netflix, four structural advantages are doing specific, quantifiable work.
| Advantage | Current state | Upside scenario |
|---|---|---|
| Scale economics | 325M+ members spreading content costs across the largest global base | Content ROI discipline continues widening FCF margins |
| Advertising optionality | Ad revenue targeting ~$3 billion in 2026, roughly doubling year over year | Ad ARPU scales toward digital platform norms, adding several points to growth |
| International growth | Emerging market expansion via lower-priced and ad-supported tiers | Long runway extends membership growth beyond mature markets |
| Pricing power | Ongoing plan price increases driving ARM (average revenue per member) growth | Sustained pricing power compounds cash flow without proportional acquisition costs |
Morningstar’s narrow moat designation is honest. These advantages are real but not impenetrable. Amazon, Disney, Apple, and local players create competitive pressure on content costs and churn. The moat is wide enough to support a moderate valuation premium over traditional media businesses. It is not wide enough to justify the extreme growth multiples the stock carried in prior years.
Pricing power diagnostics, particularly the ability to assess them from publicly available earnings transcripts and competitor filings rather than proprietary data, make Netflix’s ongoing plan price increases one of the more testable moat claims available to individual investors evaluating the stock.
Advertising as the highest-optionality growth lever
Ad revenue at approximately $3 billion in 2026 is still a small share of a $51 billion business, but it is growing rapidly and it is where the upside case gets most interesting.
What “optionality” means in practice: if ad ARPU (average revenue per user from advertising) scales toward established digital or linear TV norms, this segment could add multiple percentage points to total revenue growth without proportional content cost increases. The high fixed-cost platform structure means incremental ad revenue flows through at high margins.
That is also where the uncertainty concentrates. The advertising business is where the valuation upside is most plausible but also most unproven. You need to form a specific view on ad ARPU trajectory before treating it as a growth driver rather than speculative optionality.
Live programming and the subscriber quality problem
Management reported that live event programming accounted for six of the top ten days by new member signups. As a headline, that sounds like a powerful acquisition engine.
Look closer.
Live programming accounts for roughly 5% of total content expenditure yet generates only around 1% of total viewing hours. Against a backdrop of approximately 97 billion total member viewing hours in prior periods, live content is an expensive slice with a thin viewing footprint.
Approximately 5% of the content budget generating approximately 1% of viewing hours is a ratio that demands explanation before live programming can be credited as a structural growth driver.
The concern is subscriber quality. Event-driven subscribers who sign up for a specific live broadcast and cancel afterward represent very different lifetime value (LTV, the total revenue a subscriber generates over their membership) than subscribers who engage broadly with the catalogue. High signup numbers can mask high churn if those members never convert into regular users.
The analytical framework for evaluating live programming requires three distinct steps:
- Separate acquisition metrics from value metrics. Signups, monthly active users, and viewing hours measure reach. ARM, LTV, and retention measure value. They are not interchangeable.
- Evaluate content ROI, not just headline audience. How do live events compare to series and films on cost per hour viewed and incremental revenue generated?
- Ask whether live initiatives deepen platform attachment or create one-off spikes. Do they build habitual usage across categories, or do they attract transactional viewers with weak long-term ties?
Netflix has not yet disclosed granular live-specific churn or LTV data, so this framework is prescriptive rather than conclusive at this stage. Until that data arrives, live programming should be viewed as strategic optionality with uncertain FCF impact.
Where the evidence points for different investor profiles
The investment case at current prices varies meaningfully depending on what kind of investor you are.
| Investor profile | What Netflix offers | Primary risk |
|---|---|---|
| Growth investor | 9-14% indicative return with FCF backing, not the 20-30% CAGR story of prior years | Growth slows closer to high single digits, eroding the premium case |
| Quality/compounder investor | Scale, disciplined content spending, pricing power, and advertising growth as compounding mechanisms | Competitive pressure from Amazon, Disney, Apple compresses margins |
| Income-aware investor | ~4% FCF yield with buyback support, resembling an equity bond with upside | FCF multiple compresses below 20x, reducing total returns despite strong cash generation |
The shared risk factor across all three profiles is the same: multiple compression. If the market re-rates a mature streamer below 20x FCF, total returns suffer even with strong underlying cash generation. That scenario is the one every investor needs to stress-test against their own risk tolerance.
Three variables will confirm or challenge the current thesis over the coming quarters:
- Advertising revenue growth trajectory: Is ad ARPU scaling toward digital norms, or plateauing at low levels?
- Content spend discipline relative to revenue: Does the incremental margin gap hold, or does competitive pressure force higher spending?
- Live programming retention data: If and when Netflix discloses churn and LTV figures for live-event subscribers, the subscriber quality debate moves from speculation to evidence.
Which investor profile you most closely resemble determines not just whether Netflix belongs in your portfolio but at what allocation size and with what monitoring triggers. That specificity is what separates an informed decision from a directional guess.
A repriced stock is not the same as a cheap one
Netflix’s 40% decline has moved the stock from overpriced on a growth basis to fairly valued on a cash flow basis. Those are two very different things, and neither one means undervalued.
At approximately 4% FCF yield plus a 9-14% indicative return band, the case is reasonable but not asymmetric. The multiple remains the swing variable. If it holds in the mid-20s, the maths works for patient capital. If it compresses toward 15-20x, even strong cash generation may not compensate.
The analytical discipline this demands is straightforward: separate what the market priced in, what the business actually delivers, and what the next chapter depends on. React to the framework, not the price chart.
For investors who want to stress-test this distinction with a worked DCF model, our full explainer on quality versus investment quality applies a three-scenario valuation to Netflix specifically, producing intrinsic value estimates that range from approximately $50 to $107 per share depending on the assumptions used.
This article is for informational purposes only and should not be considered financial advice. Investors should conduct their own research and consult with financial professionals before making investment decisions. Past performance does not guarantee future results. Financial projections are subject to market conditions and various risk factors.