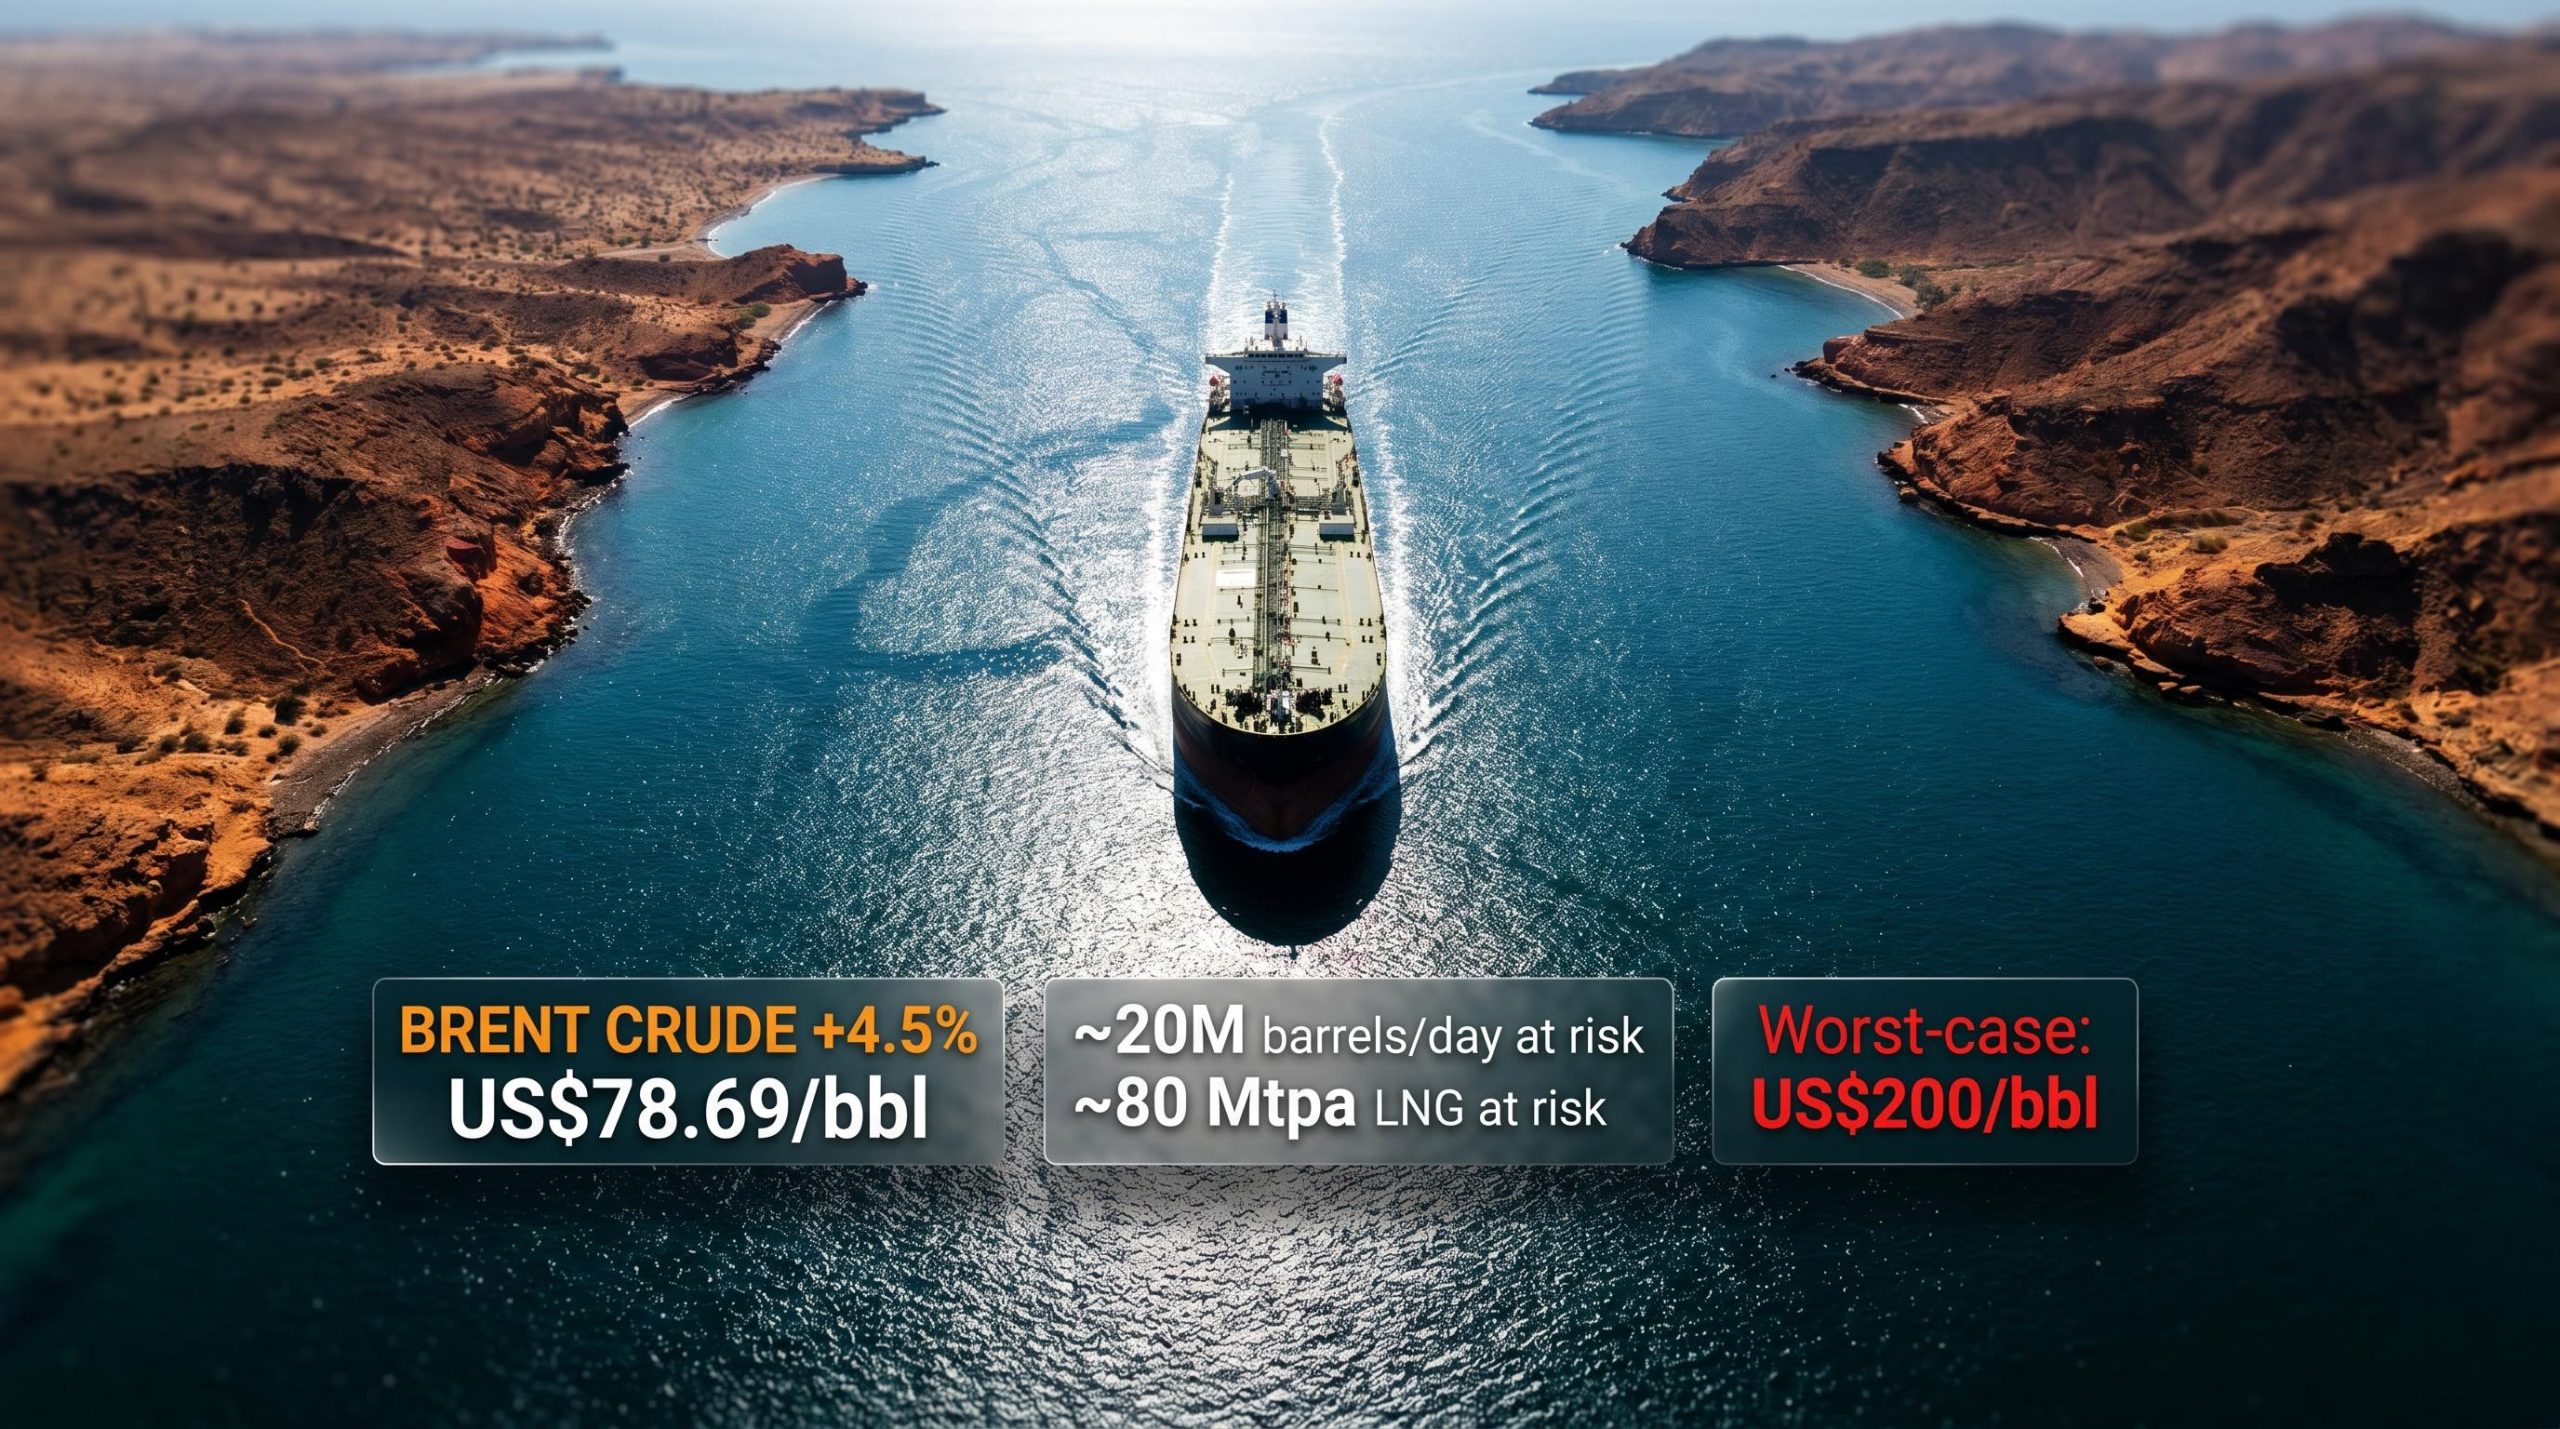
Over the weekend, Iran announced that the Strait of Hormuz was closed indefinitely, sending Brent crude up 4.5% to US$78.69 per barrel when markets opened on Monday. US Central Command pushed back promptly, asserting that the waterway remains outside Iranian control and that vessels were continuing to transit without interruption.
The gap between those two claims is where the investment risk lives right now.
The declaration followed the most intense week of US-Iran military exchanges in decades. By Saturday 12 July 2026, three waves of US strikes had hit more than 300 Iranian military sites in total, with the final wave alone striking roughly 140 locations. Iranian forces launched retaliatory drone and missile attacks against at least five regional neighbours, including Kuwait, Jordan, Qatar, Oman, and the UAE, with casualties and physical damage reported as minimal. Diplomatic channels remain active: Oman has put forward a framework to regulate transit through the strait, while Pakistan and Qatar are both engaged in efforts to restart US-Iran negotiations.
No resolution timeline exists. For Australian investors, that means the oil headline is only the beginning of the story. The Hormuz disruption creates simultaneous and opposing pressures across energy equities, materials, consumer sectors, bond markets, and the RBA’s policy path. Here is how each of those channels is moving, what the market reaction is actually telling you, and where the positioning decisions sit this week.
Why the Hormuz closure threat is the single biggest energy risk in decades
The Strait of Hormuz is a narrow waterway between Iran and Oman through which approximately 20 million barrels per day of crude oil flow, roughly 20% of global petroleum liquids. It also carries approximately 80 million tonnes per annum (Mtpa) of liquefied natural gas (LNG), representing one-fifth of global supply, primarily from Qatar and other Gulf producers. No other chokepoint on earth concentrates this much energy supply in such a confined space.
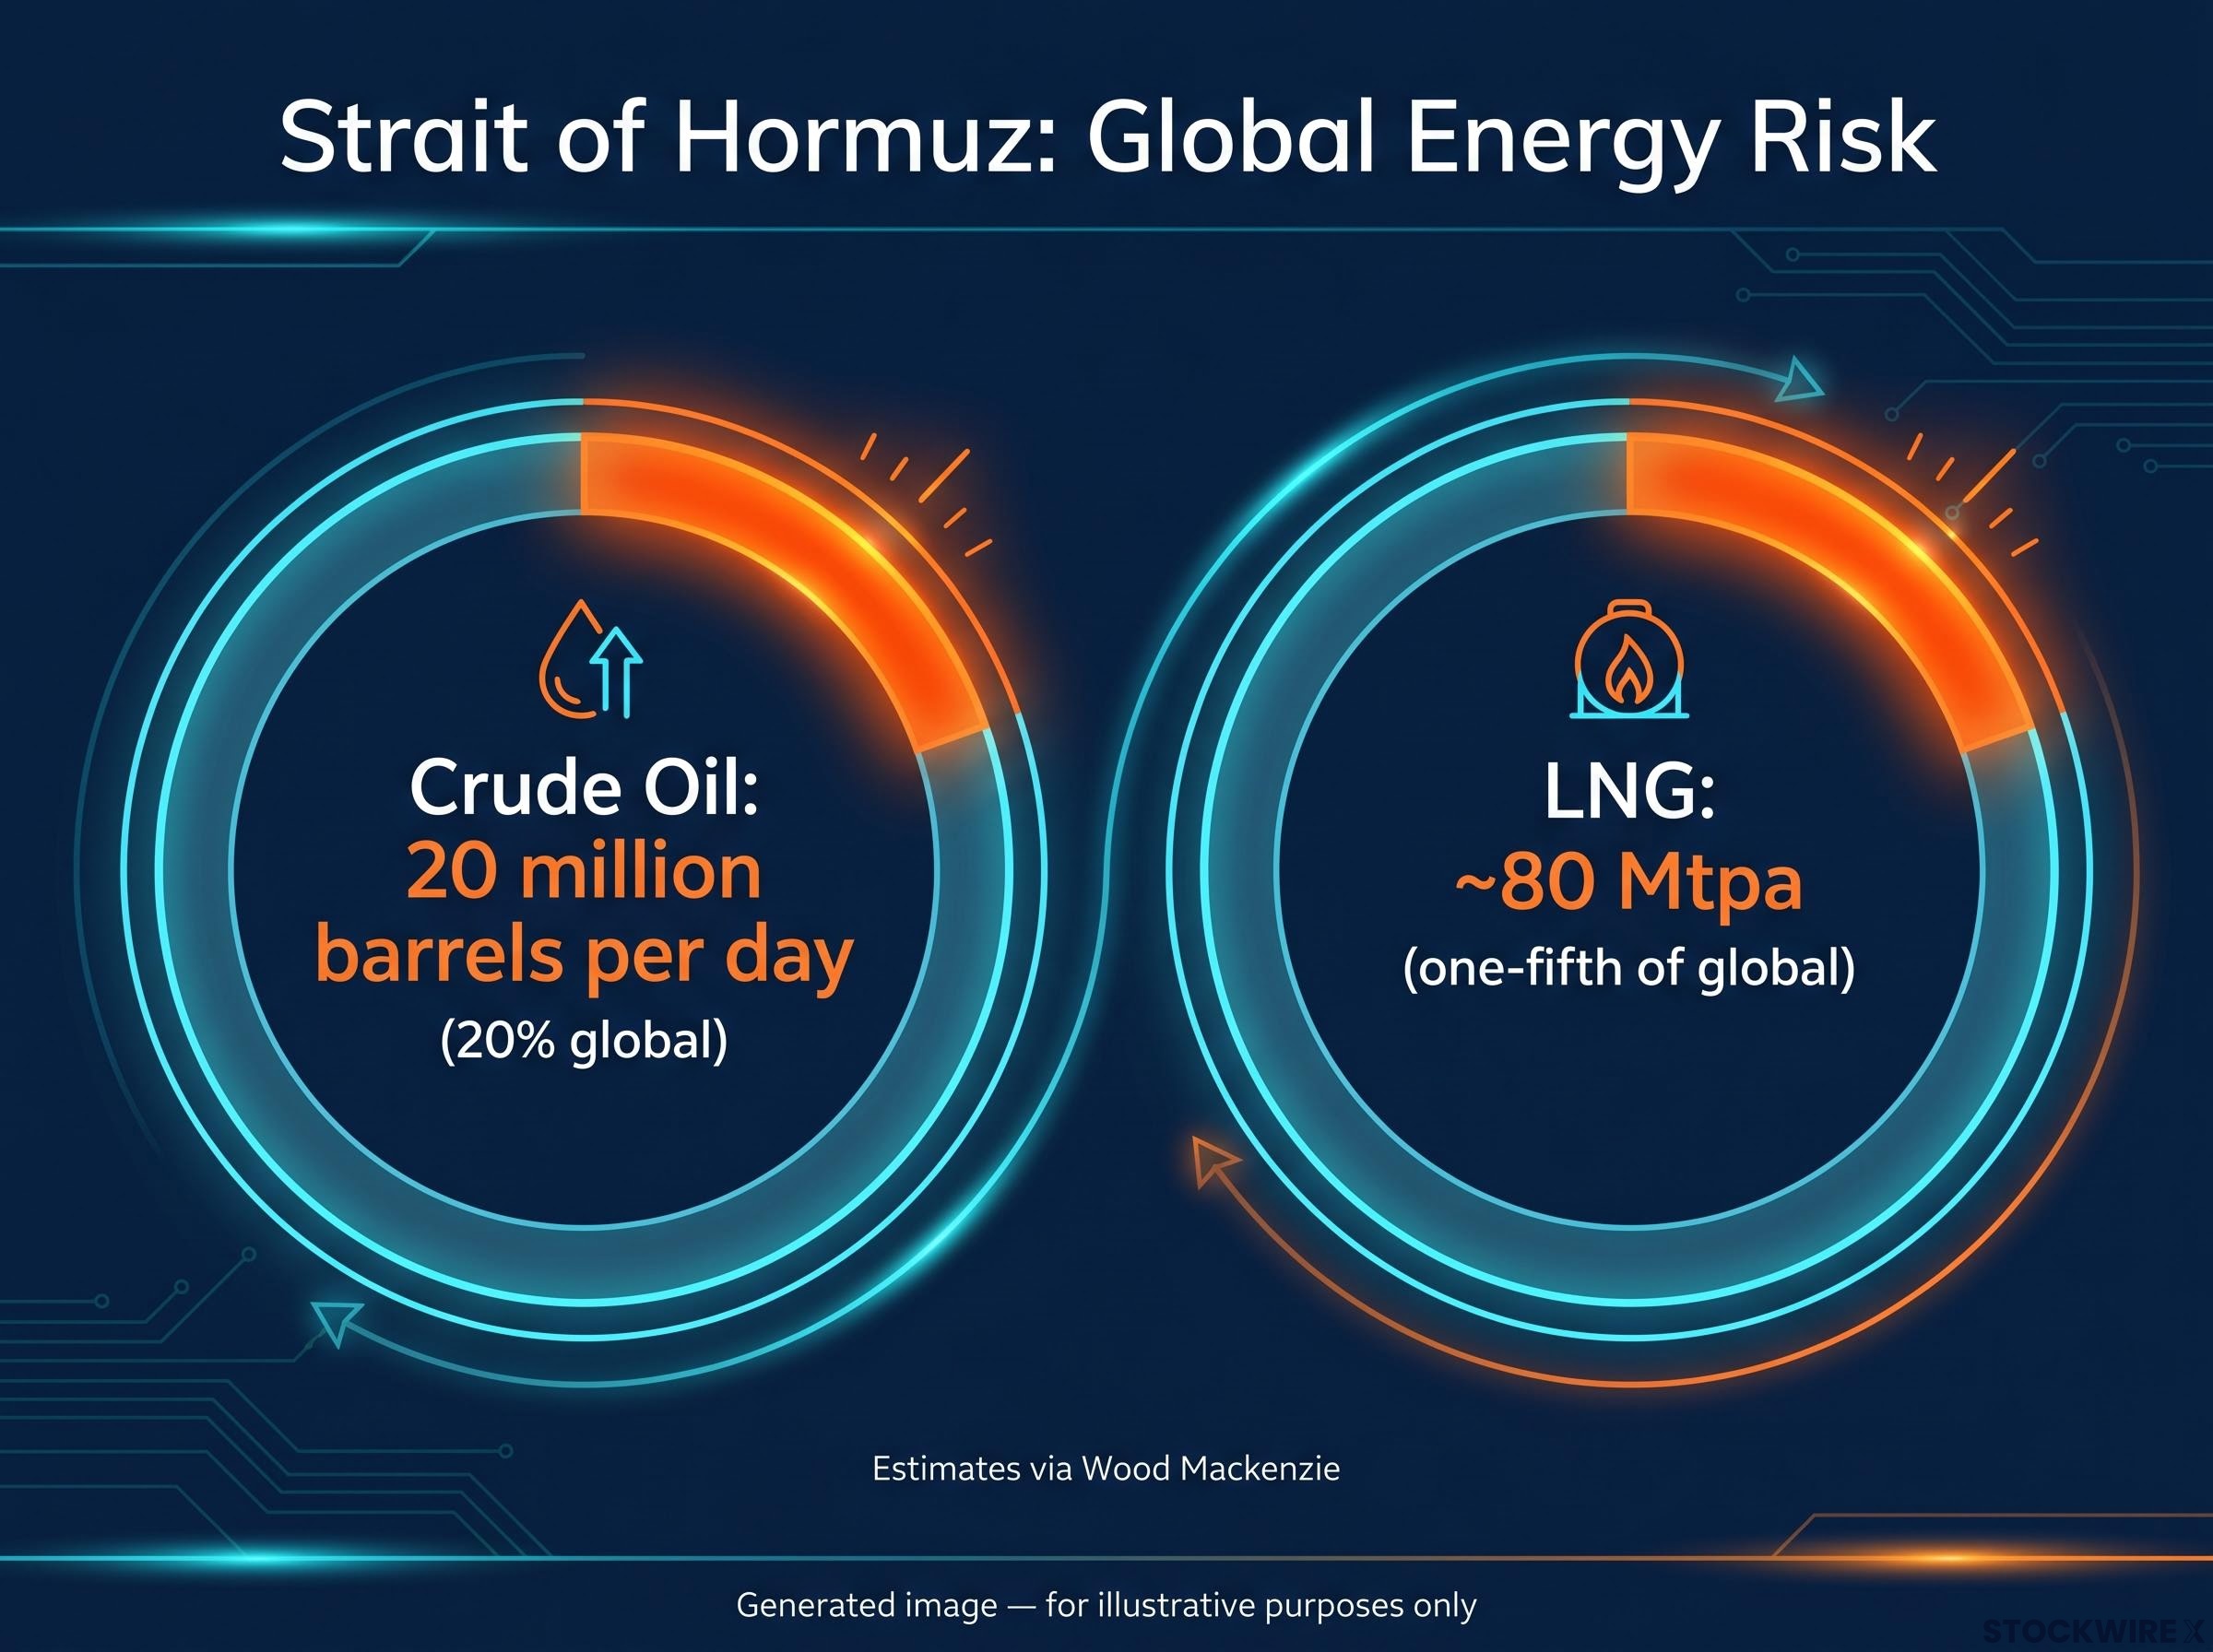
Wood Mackenzie describes a prolonged Hormuz closure as “the single greatest threat to global energy markets in decades.”
That is why a closure declaration moves markets even when ships are still sailing. The physical blockade is not the only mechanism. Persistent uncertainty, higher war-risk insurance premiums, and intermittent disruption capability are sufficient to keep a substantial risk premium embedded in oil prices for months. Insurers and shipping operators price the threat itself, not just the outcome.
War-risk insurance premiums are one of the mechanisms through which uncertainty transmits into prices even when ships continue to sail; with commercial insurers having effectively withdrawn standard cover from Hormuz traffic at the peak of the disruption, VLCC daily hire rates tracked as high as approximately $110,000 per day as a real-time physical signal of disruption severity.
| Metric | Figure | Context |
|---|---|---|
| Brent crude reaction | +4.5% to US$78.69/bbl | Early Monday, 13 July 2026 |
| LNG at risk | ~80 Mtpa (one-fifth of global) | Wood Mackenzie estimate |
| Worst-case Brent projection | ~US$200/bbl | Wood Mackenzie, toward end-2026 |
| Worst-case GDP impact | ~0.4% global contraction | Wood Mackenzie (recession-consistent) |
| Emergency reserve offset | ~2.5-3 mb/d | Brookings (finite and temporary) |
The worst-case projections, Brent at US$200 and diesel near US$300 per barrel in key refining hubs, are not the base case. But their existence means professional investors are now pricing a non-trivial probability of a recession-scale energy event. Australian portfolios need to account for that tail risk explicitly, even if the most likely outcome falls well short of it.
When big ASX news breaks, our subscribers know first
What the immediate market reaction tells us about investor confidence
Start with what confirmed expectations. Brent surged 4.5% to reach US$78.69, while steel ETFs climbed 2.09%, copper miners added 1.51%, and uranium moved 1.46% higher. Those moves were predictable.
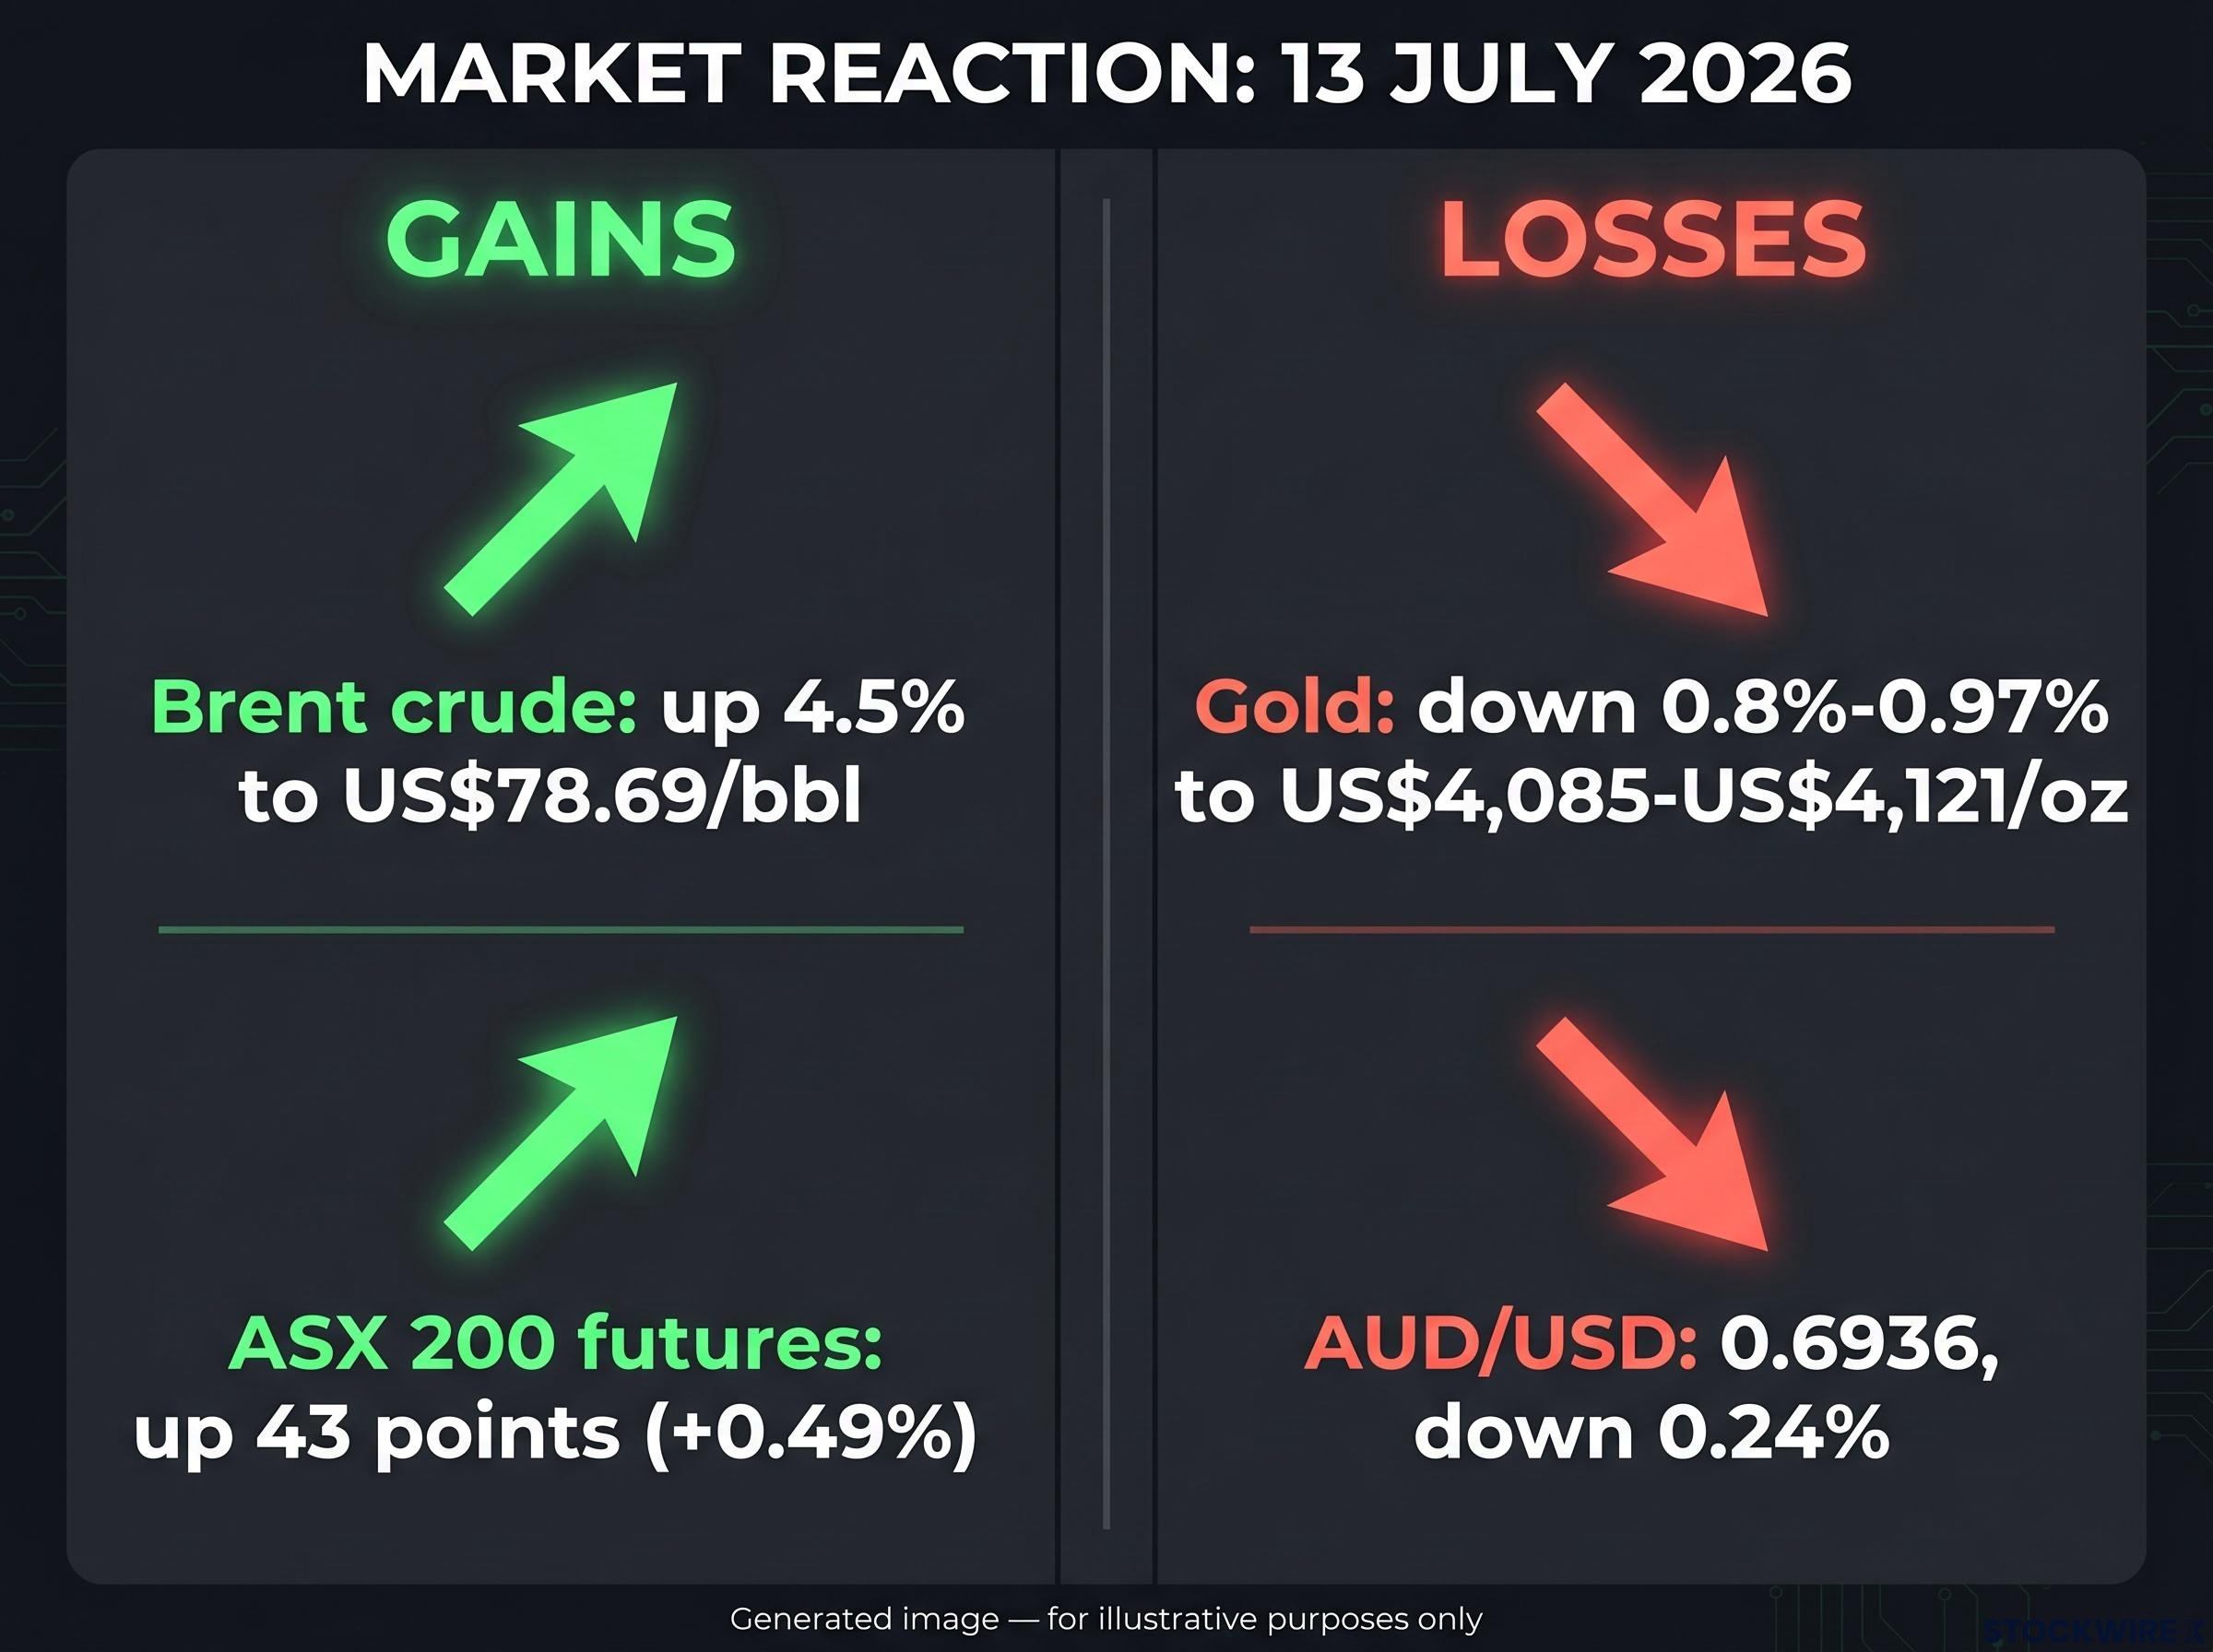
Now look at what did not behave as expected:
- Brent crude: up 4.5% to US$78.69/bbl
- Gold: down approximately 0.8%-0.97% to around US$4,085-US$4,121/oz, an unusual divergence from safe-haven norms
- Copper: down 0.56% to US$6.20
- AUD/USD: 0.6936, down 0.24%
- ASX 200 futures: up 43 points (+0.49%)
- Silver miners ETF: down 0.59%
- Lithium and battery tech ETF: down 0.69%
Gold falling while oil spikes is the signal worth isolating. In a pure geopolitical flight-to-safety event, gold rises. When it falls alongside an oil surge, institutional money is reading the shock as inflationary rather than deflationary. That distinction has direct consequences for how bond yields and credit spreads are likely to move in the weeks ahead.
As of the week ending 11 July 2026, aggregate primary dealer positioning in corporate bonds turned net short for the first time in data stretching back to 1998. That structural fragility in credit markets predates the Hormuz escalation, but an inflationary oil shock makes it substantially more relevant.
The ASX 200 futures rising 43 points is not a blanket risk-on signal. It reflects the selective nature of the response: energy names are lifting the index while consumer and growth names face the opposite pressure.
For Australian energy stocks and LNG exporters, this is the scenario they are built for
Australian LNG exporters sit outside the Strait of Hormuz. That geographic fact becomes a strategic advantage when Gulf LNG supply, approximately 80 Mtpa from Qatar and neighbouring producers, is threatened. Non-Hormuz LNG supply becomes relatively scarcer and more strategically valuable, and Australia is one of the world’s largest sources of it.
Many LNG contracts are indexed to oil benchmarks, meaning sustained higher crude prices support LNG contract revenues over time even without direct spot-market exposure. The escalation was specifically identified as potentially benefiting energy-related ASX equities including coal, oil and gas, and refiners.
Australian resources and energy export data from the Department of Industry, Science and Resources confirms that LNG volumes have remained strong heading into the escalation, reinforcing the strategic positioning advantage that non-Hormuz exporters hold when Gulf supply faces sustained disruption.
The clearest beneficiaries and the more qualified exposures are not the same:
- Clearest beneficiaries: Upstream producers with unhedged or lightly hedged output and strong balance sheets; LNG exporters outside the strait with oil-indexed contracts
- More qualified exposures: Heavily hedged producers who may capture less upside than investors expect; energy services firms facing higher war-risk insurance and operating costs
Why hedging structures matter for the size of the gain
The critical caveat is duration. Crude prices had retreated toward recent lows before the closure declaration, meaning the 4.5% Brent move represents a repricing from a depressed base, not a continuation of a prior spike. If the disruption proves short-lived, spot prices can spike then mean-revert, and highly hedged producers may see limited benefit. The thesis works most clearly for producers with unhedged exposure, and it depends on the disruption being sustained.
Materials, consumers, and bond markets: where the pressure accumulates
The energy tailwind does not extend evenly across the ASX. Three distinct channels transmit cost pressure to sectors that do not benefit from higher oil:
- Mining cost pressure: Diesel for haulage, explosives, power generation, and transport all become more expensive. Unless iron ore, copper, and other commodity prices rise enough to offset those higher energy inputs, margins compress. Prior to this shock, the ASX Materials sector had already pulled back roughly 13% from the record highs it set on 17 June 2026, before posting a 2.3% recovery on Friday 11 July 2026.
- Consumer income squeeze: Higher petrol and transport costs function as a household tax, reducing real disposable income. Retailers, consumer discretionary names, travel operators, and airlines face reduced spending power from customers and higher operating costs simultaneously.
- Bond and credit market dynamics: Oil shocks historically raise inflation by a few tenths of a percentage point over a one-to-two year window, according to Joint Economic Committee and UNCTAD analyses, and can nudge unemployment higher. Higher inflation expectations push bond yields up and credit spreads wider.
For Australian investors holding materials names or leveraged consumer stocks, the Hormuz shock introduces cost-push pressure that is not offset by the commodity price tailwind benefiting energy producers. If higher oil coincides with higher bond yields, the environment becomes especially difficult for leveraged consumer names and rate-sensitive sectors.
Corporate bond markets enter this oil shock in a structurally weakened state: dealer net short positioning has reached levels not seen at any point in the period since 1998, reducing the market’s capacity to absorb additional stress if the inflationary impulse intensifies.
The RBA, the AUD, and the Australia-specific complication
Australia’s position in this shock is more ambiguous than the commodity-exporter label suggests. Three Australia-specific risk vectors complicate the picture:
- RBA policy path: A sustained oil shock that lifts headline inflation reduces the scope for near-term rate cuts. That directly affects rate-sensitive ASX sectors, housing-linked names, some financials, and growth equities, independently of what is happening in energy earnings.
Energy costs passing through into wages was the specific second-order mechanism the RBA cited when it raised the cash rate to 4.35% in May 2026, a decision that made Australia’s central bank the most aggressive among developed-world peers and created a divergence of up to 235 basis points relative to the Fed, ECB, and Bank of England.
- AUD behaviour: The Australian dollar weakened to 0.6936 against the US dollar, down 0.24% on the day. For a commodity-exporting currency, that is counterintuitive. Global growth uncertainty is outweighing any commodity-currency tailwind from higher oil, at least in the immediate shock period.
- China demand exposure: This is the variable that could override everything else for Australian miners. Wood Mackenzie’s worst-case scenario projects a global GDP contraction of approximately 0.4%. If that materialises, Chinese industrial demand for Australian iron ore and bulk commodities weakens, compounding the cost-side pressure on miners already dealing with higher energy input costs.
Australia sits at the intersection of energy export upside and China demand downside risk. How those two forces balance depends entirely on the disruption’s severity and duration. The AUD and RBA signals are worth watching as leading indicators of which force is winning.
How to position an Australian portfolio when the duration is genuinely unknown
The central variable is duration, and nobody has visibility on it. That means positioning needs to generate a reasonable outcome across a range of scenarios rather than depending on one extreme resolving in a specific direction.
| Portfolio Category | Positioning Signal | Key Caveat |
|---|---|---|
| Quality energy and LNG producers | Consider emphasising; clearest beneficiaries of sustained disruption | Benefit depends on hedging levels and disruption duration |
| Defensive sectors (Staples, Healthcare, select Insurers) | Portfolio stabilisers; less sensitive to real income swings | Insurers face mark-to-market pressure if yields rise and spreads widen |
| Consumer discretionary and travel | Approach with caution; oil functions as a direct tax on spending power | Higher fuel costs compound weaker consumer demand |
| Energy-intensive materials | Caution unless revenue leverage clearly offsets cost pressure | Sector entered the shock down ~13% from June highs |
| Leveraged or long-duration growth names | Sensitive to higher yields and wider credit spreads | Primary dealer short position adds credit market fragility |
Diplomatic channels remain active. Oman’s traffic-management proposal, and Pakistan and Qatar’s efforts to revive US-Iran talks, mean rapid price reversals are plausible. Positioning that only works if the strait stays closed, or only works if it reopens quickly, carries significant execution risk in either direction.
A supply chain recovery timeline of approximately two years is the IEA’s projection even under a best-case diplomatic outcome, a figure that shaped how Asian equity markets responded when a preliminary US-Iran memorandum of understanding was announced in mid-June 2026, with South Korea’s KOSPI surging roughly 5% while China’s CSI 300 gained only 1.2-1.3% due to more diversified supply arrangements.
What happens next depends on which version of this crisis is real
Two competing claims define the situation. Tehran maintains that the Strait of Hormuz is shut without a fixed reopening date, while US Central Command holds that Iran lacks the authority to close the waterway and that vessels remain in transit. That credibility gap is unlikely to be resolved quickly, and it is the single variable that determines how severe the market impact becomes.
Three signals are worth monitoring in the coming days:
- Credit spread behaviour: The primary dealer net short position is the structural fragility indicator. If corporate credit spreads begin widening materially, it signals the oil shock is transmitting into broader financial stress.
- Brent crude price sustainability: Whether Brent sustains above US$78.69 or retreats below the closure-day level will indicate whether the market is pricing a sustained disruption or a temporary spike.
- Diplomatic channel progress: Oman’s traffic-management proposal and the Pakistan-Qatar mediation efforts are the most visible de-escalation pathways. Any framework announcement could trigger a rapid repricing in the opposite direction.
Ambassador Waltz indicated that Iran had failed to honour its ceasefire commitments and that the Trump administration was keeping every option open. The situation was already under active diplomatic management before the closure declaration, and the market’s job is to price the distribution of outcomes, not the single most alarming one.
For Australian investors, the practical implication is that the oil risk premium may remain elevated for weeks even if physical flows through the strait are uninterrupted. The market cannot price the threat away until the political and military uncertainty resolves. These three signals are where the early evidence of direction will appear.
This article is for informational purposes only and should not be considered financial advice. Investors should conduct their own research and consult with financial professionals before making investment decisions. Forward-looking projections, including Wood Mackenzie’s worst-case scenarios, are subject to market conditions and various risk factors. Past performance does not guarantee future results.