Why the 2026 Midterm Could Break a Rare Presidential Streak
1 hr ago

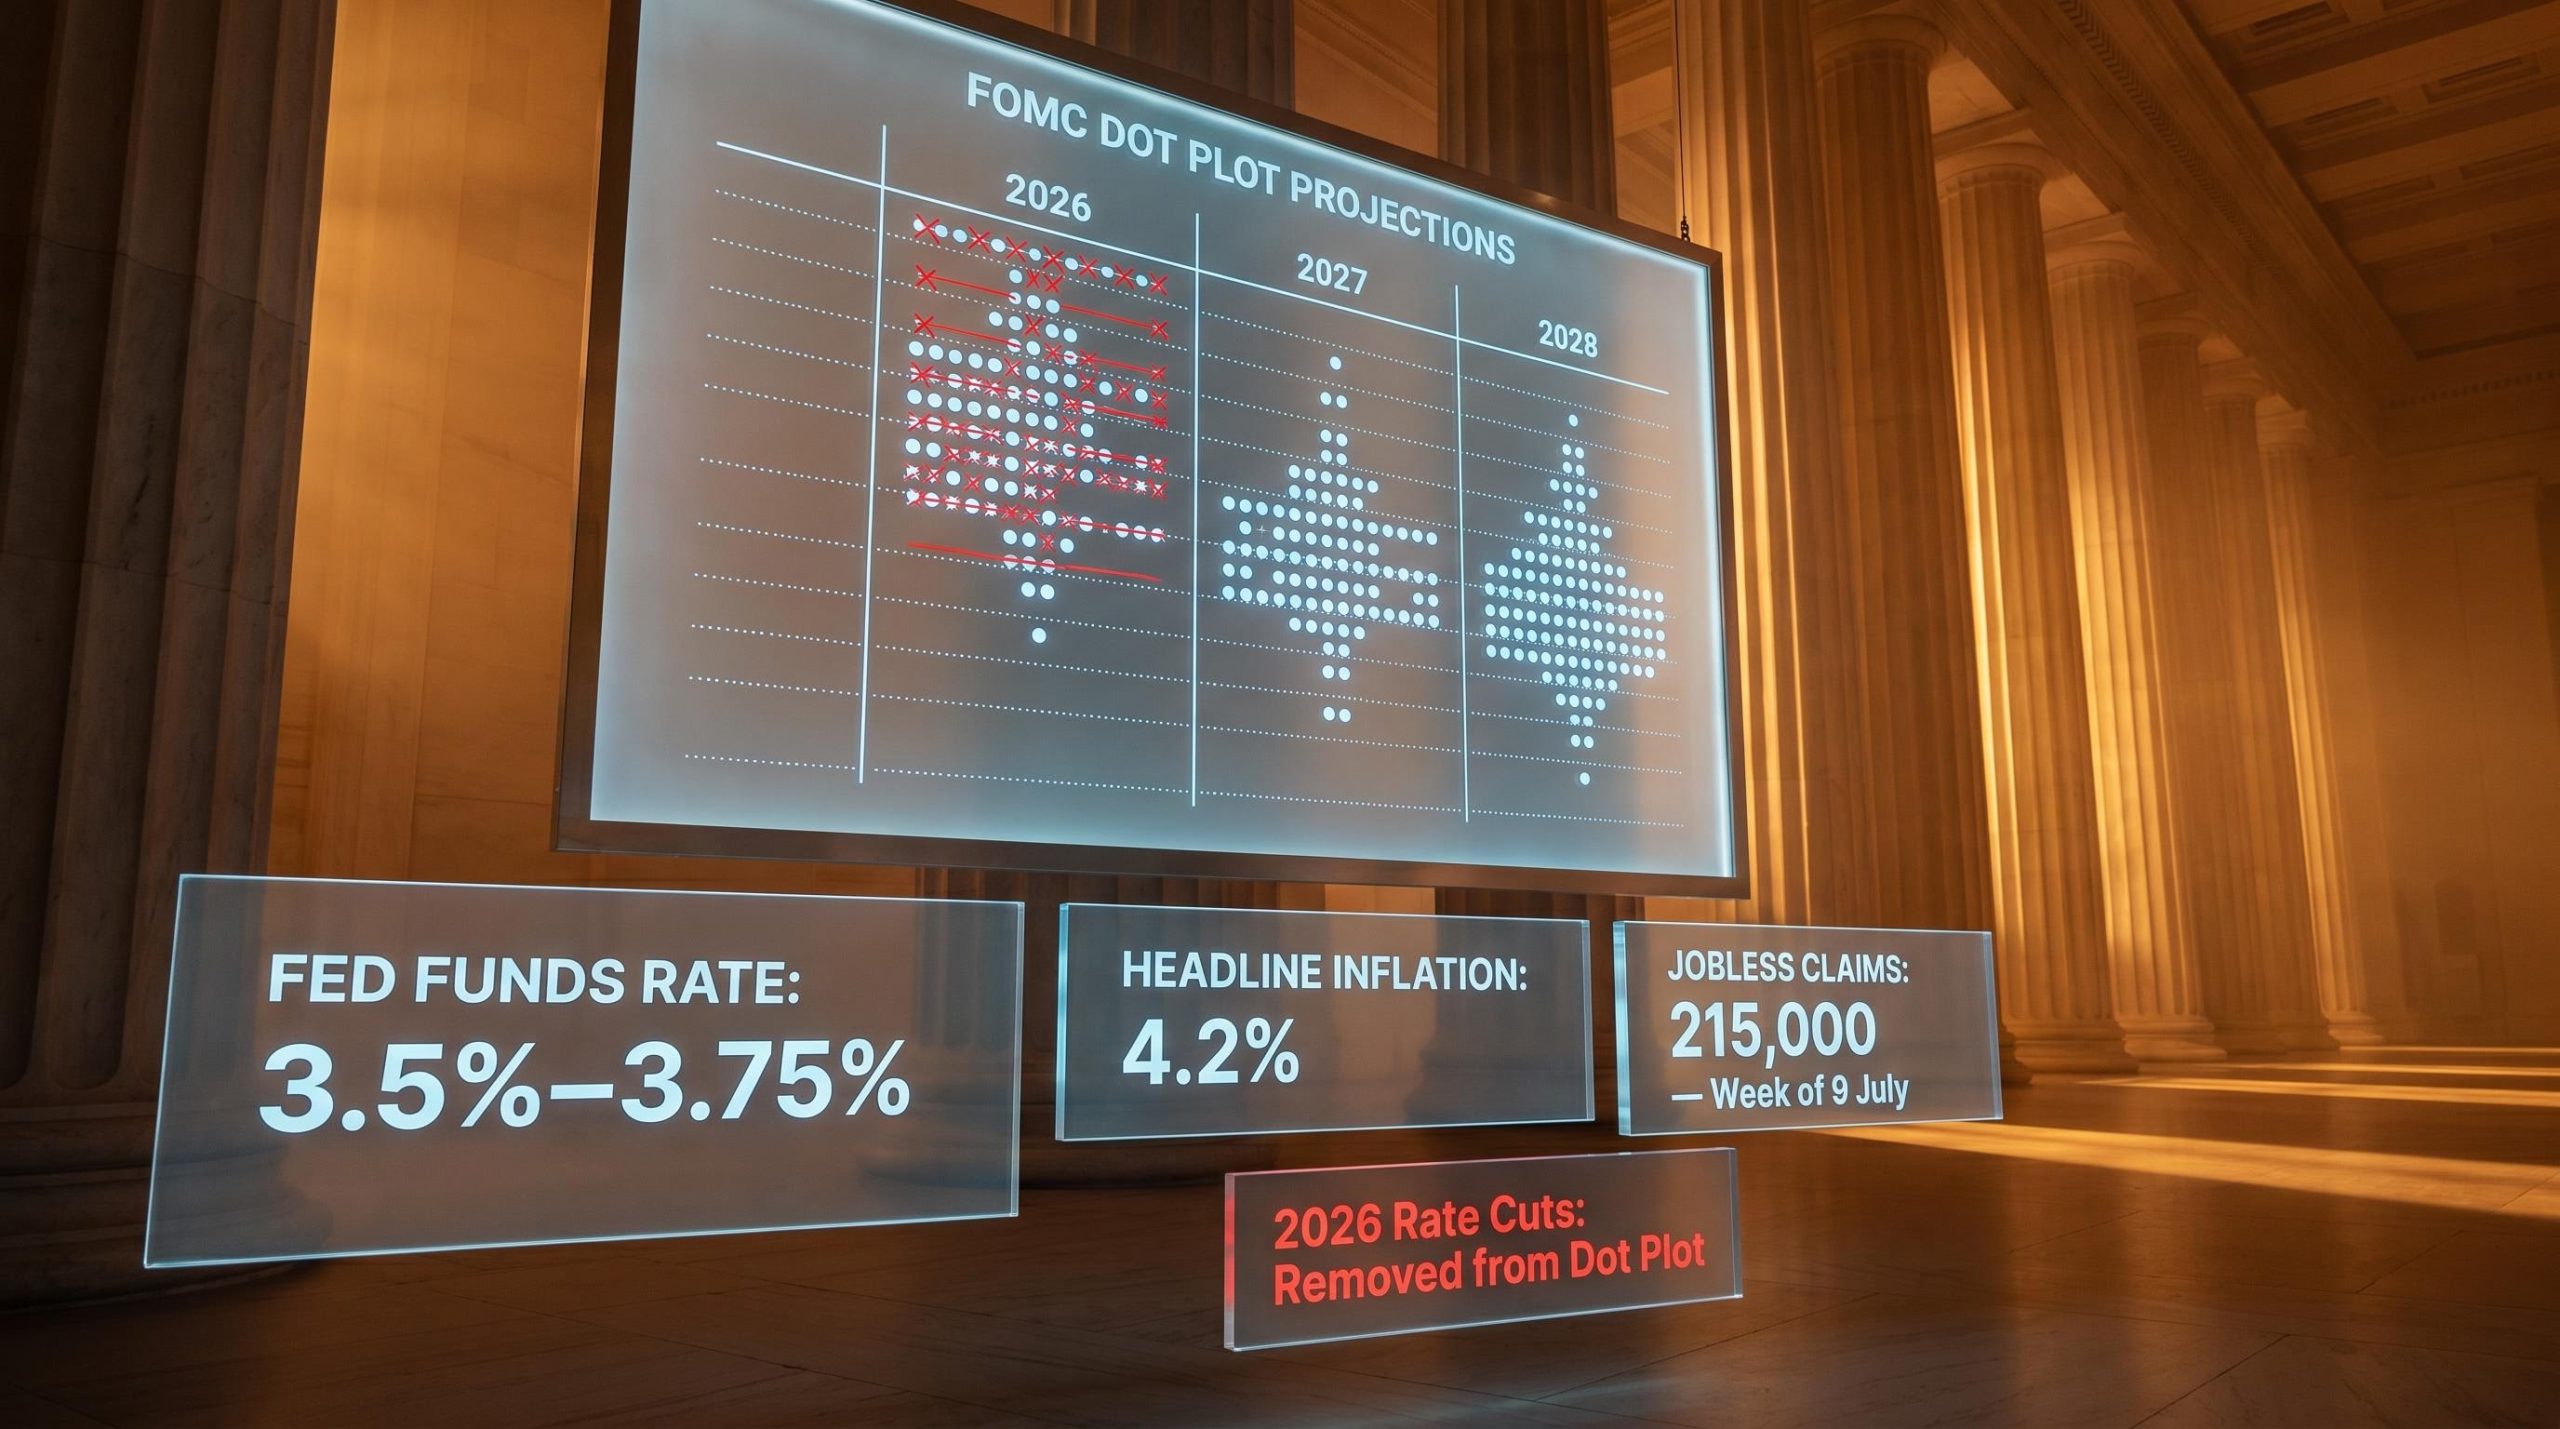
The Fed minutes landed on 9 July. The jobless claims number landed the same day. Together, they delivered a message the market has heard before but keeps testing: there is no cavalry coming on rates in 2026. Investors who have been waiting for a policy pivot to do portfolio work for them are now facing an earnings season that will settle the question of whether corporate America can make this environment work without Fed help.
The federal funds rate sits at 3.5%-3.75%, headline inflation is running near 4.2%, and weekly jobless claims printed at 215,000, a figure that reflects a labour market running well above recessionary thresholds. The conditions that would justify a rate cut simply do not exist. What does exist is a Q2 earnings season beginning the week of 14 July, led by major banks, that will either confirm the soft-landing thesis or start chipping away at it.
This piece works through what each of those three macro signals means for the Fed rate cut outlook, how bank earnings arriving this week function as a live test of the broader narrative, and what a portfolio built for this environment should actually look like. Not for a rate-cut world that has not arrived, but for the one you are operating in right now.
The hawkish hold is not new. The Fed has been sitting at 3.5%-3.75% for months, and nobody expected a cut this week. What changed on 9 July is the specificity of the language.
The hawkish tilt in the 9 July minutes reflects FOMC internal divisions that have been widening since the May meeting, when the committee recorded its largest dissenting bloc since 1992, with members pulling in opposite directions on both the hike and cut sides of the debate.
The minutes did not merely restate a preference for holding. They explicitly entertained the possibility of one to two additional hikes if inflation remains above target, a shift in tone from earlier in the year when the debate was still framed around the timing of cuts. That framing is gone.
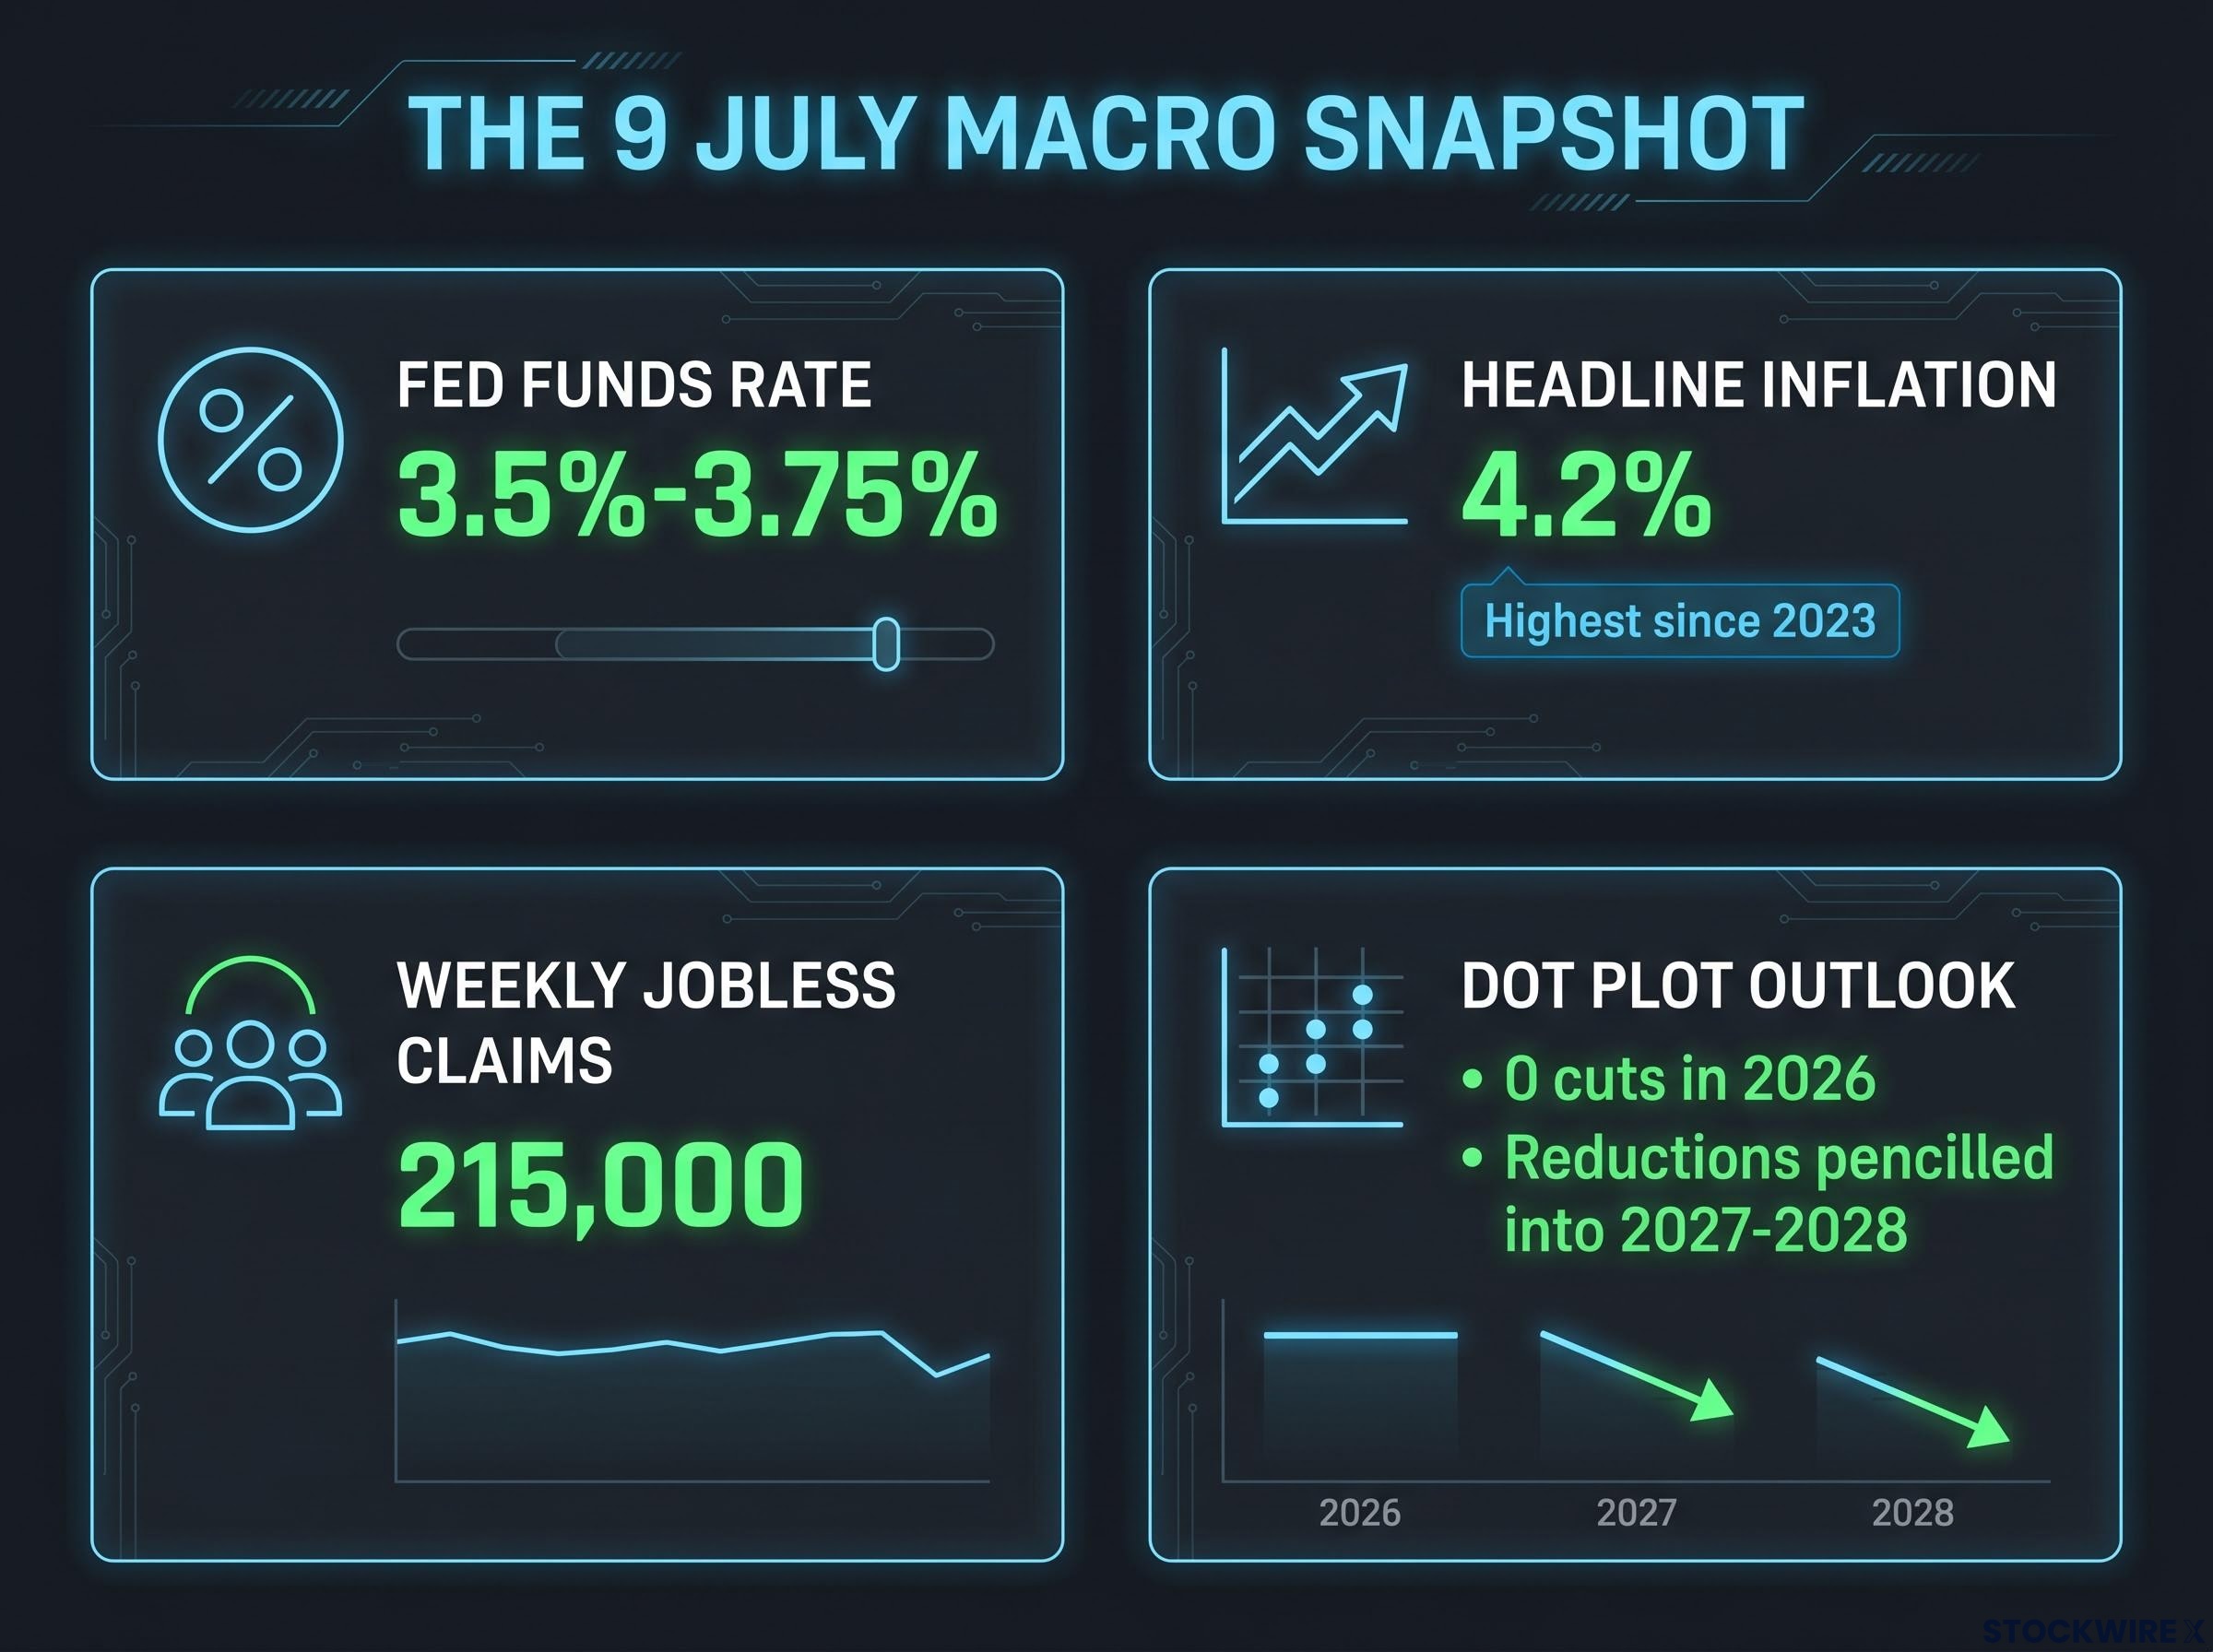
The dot plot, which maps each Fed official’s projected path for the federal funds rate, has been revised. Any cuts that appeared in earlier 2026 projections have been removed entirely. The year-end rate was revised modestly higher, and reductions are now pencilled into 2027-2028.
The removal of 2026 cuts from the dot plot is not a neutral update. It means any portfolio strategy built on cheaper capital arriving this year is operating on a premise the Fed has explicitly rejected.
With headline inflation near 4.2%, the highest reading since 2023, the Fed’s own projections are now the single most important input to any rate-sensitive investment thesis. This is not a hedge phrase anymore. “Higher for longer” is an operational planning assumption, and the duration exposure you hold and the multiple you assign to growth-oriented equities need to reflect that.
The latest weekly jobless claims figure, covering the period ending around 9 July 2026, registered 215,000. That reading sits comfortably within the range associated with a healthy, fully employed economy, not one showing any sign of meaningful deterioration. Companies are not shedding workers. The labour market is holding.
The 215,000 weekly claims figure sits against a more mixed underlying labour market than the headline implies; the June payroll print of just 57,000, roughly half the consensus forecast, introduced a contradictory signal that the claims data has not yet resolved, leaving the labour market picture genuinely two-sided for the first time this cycle.
That sounds like good news. It is, for the real economy. But for anyone waiting on rate relief, it is the opposite.
A tight labour market feeds back into sustained Fed restriction through three reinforcing channels:
The counterintuitive reality is that strong employment data is neutral-to-negative for rate-sensitive assets. It inverts the usual market logic that many retail investors still operate under, where good economic news equals good market news.
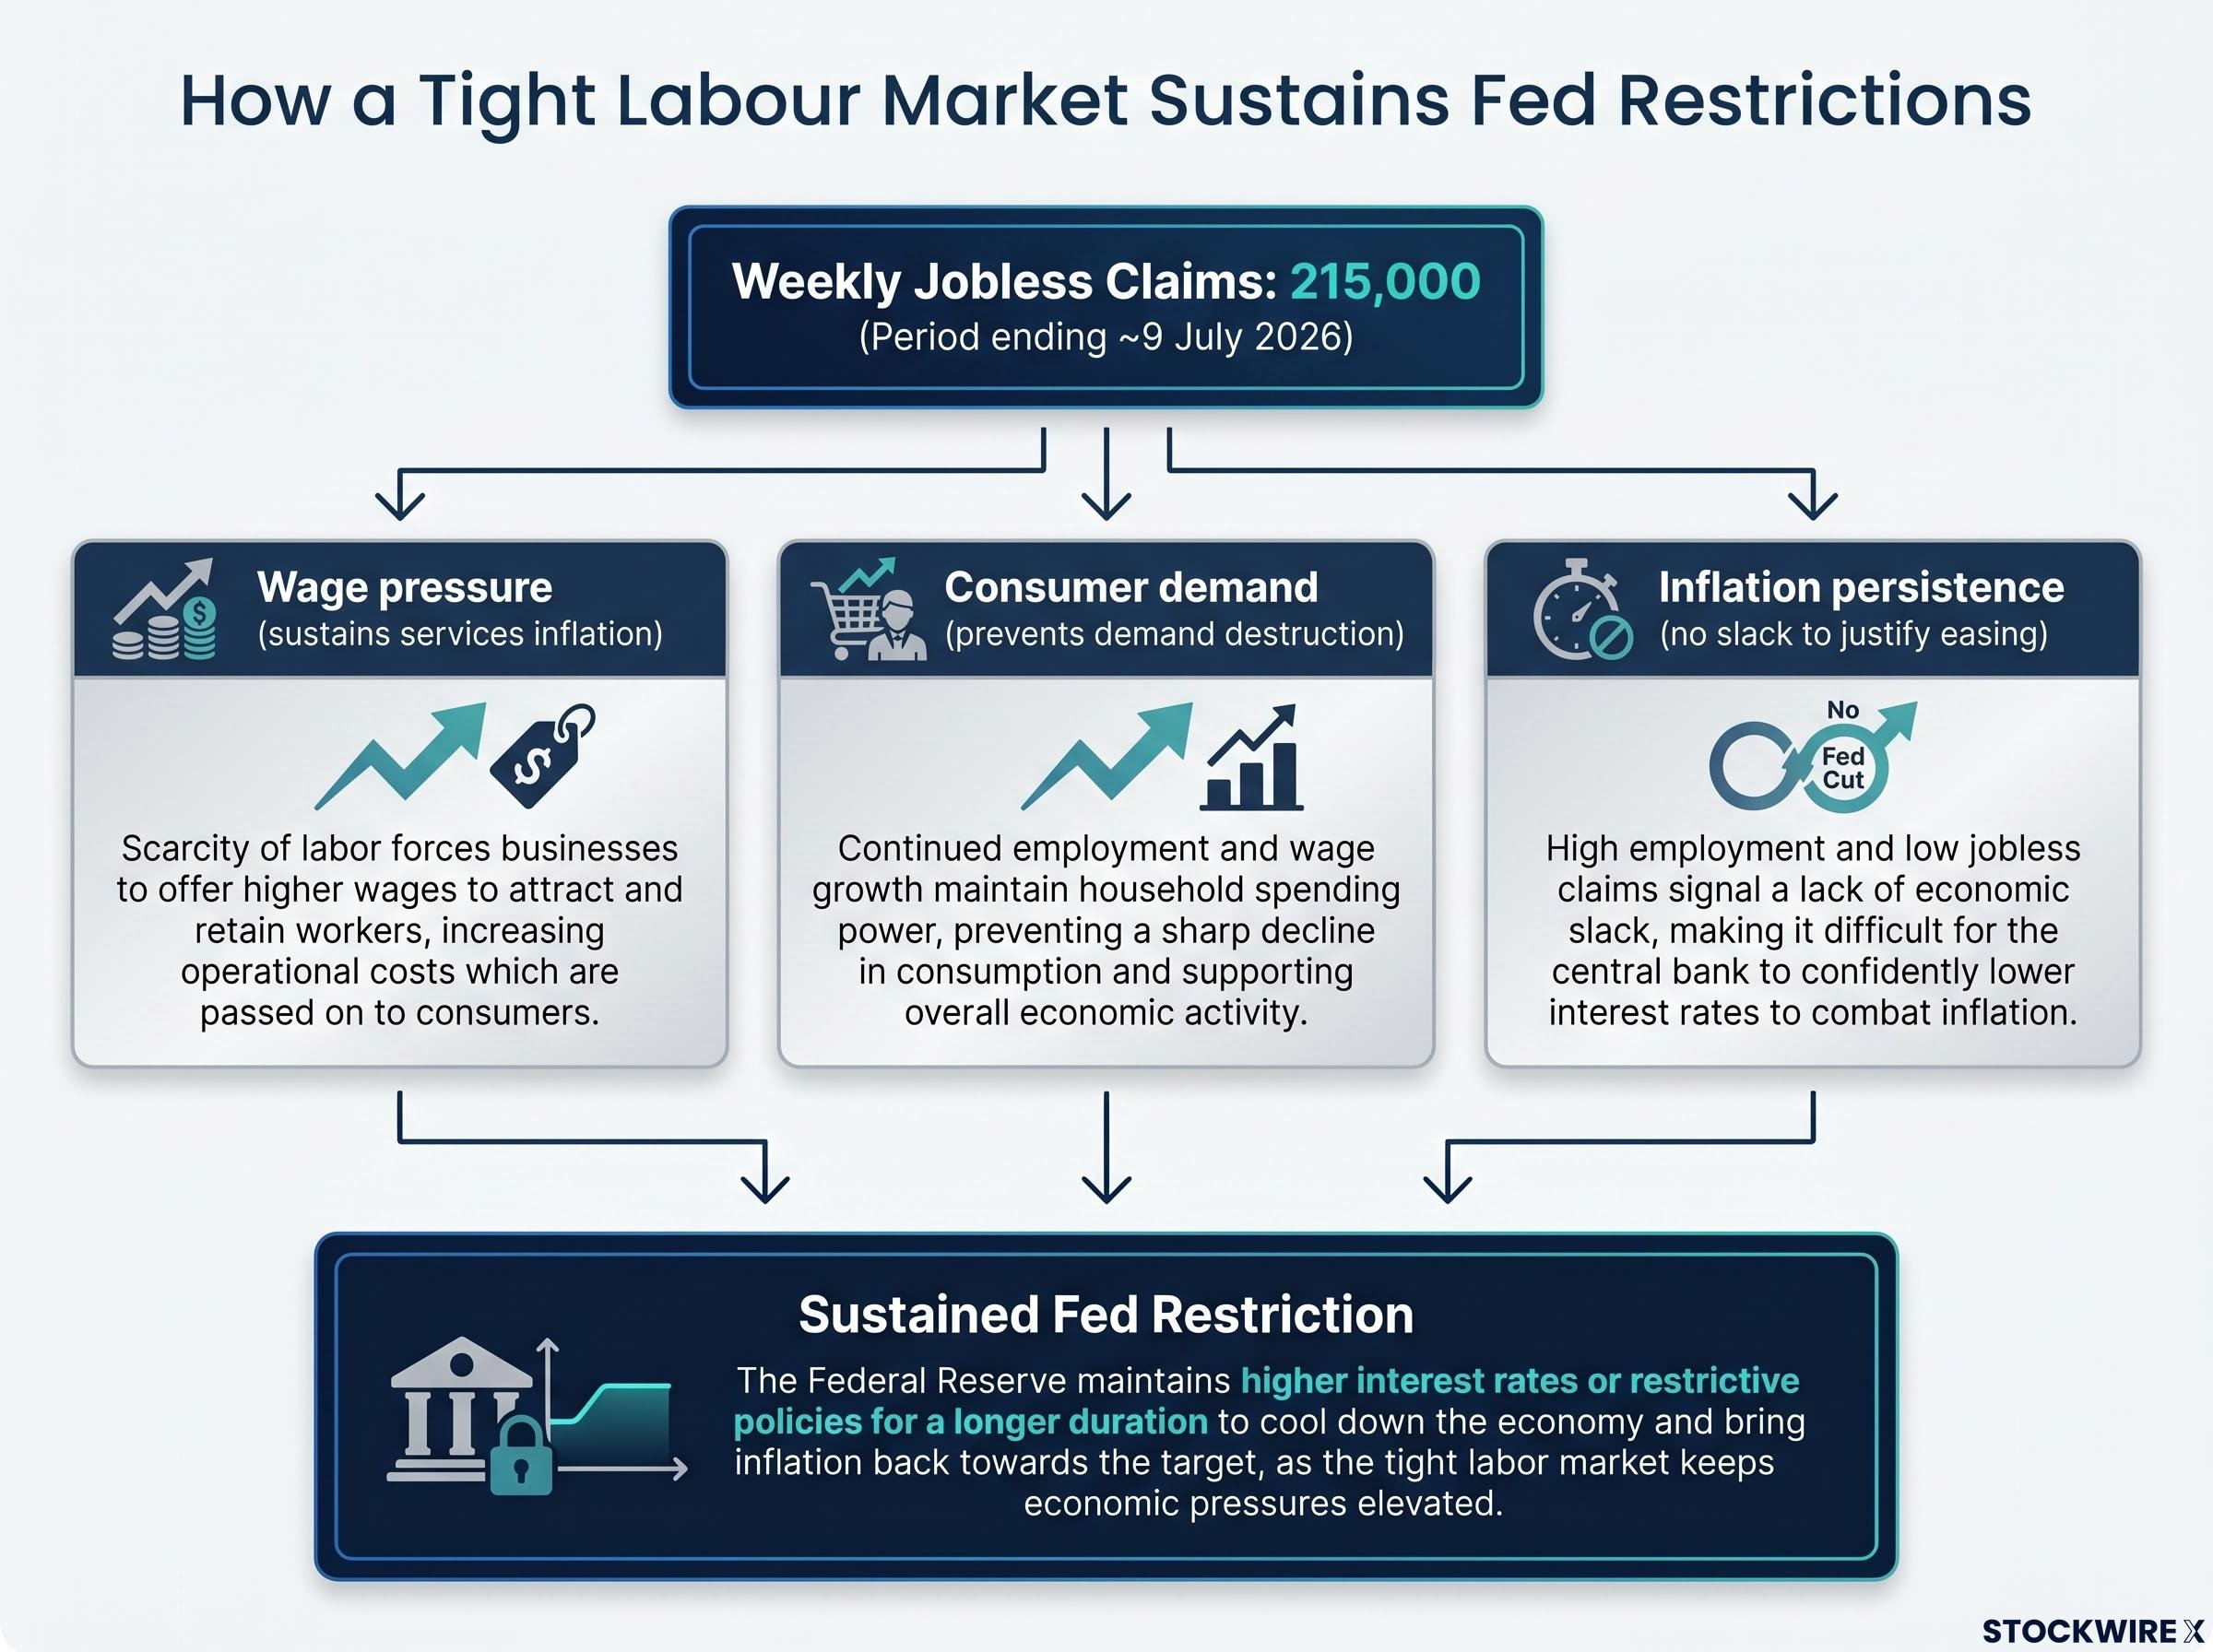
For you, a resilient jobs number right now means the rate environment is not going to soften on its own timetable. The economy has to show visible strain before the Fed acts, and that strain is not yet in the data.
If you want to see what sustained rate restriction actually looks like in a specific sector, housing is the clearest example available.
Mortgage rates remain above 6% on 30-year fixed-rate loans as of mid-2026. Home prices are expected to essentially stall. Sales are improving only gradually. The sector-specific data released around 9 July confirmed what the trend has been saying for months: demand is suppressed, and it is not coming back on its own.
| Housing metric | If rate cuts arrived in 2026 | Under current no-cut base case |
|---|---|---|
| Mortgage demand | Recovery in applications as borrowing costs fall | Constrained at current levels through year-end |
| Home price trajectory | Modest appreciation as affordability improves | Essentially flat, with regional pockets of decline |
| Homebuilder revenue outlook | Volume recovery supports top-line growth | Margin pressure persists; volume stagnation likely |
The important distinction is that housing weakness is doing targeted damage without transmitting into a broader economic contraction. The wider economy remains warm. But homebuilders, mortgage lenders, and housing-adjacent retailers need to be evaluated on a no-cut basis, not on the assumption that eventual rate relief will restore demand sometime this year.
The damage to homebuilders, mortgage lenders, and housing-adjacent retailers runs through the same rate transmission channels that affect the broader REIT complex: higher discount rates compress net asset values, rising debt costs pressure distributable income, and yield competition from short-duration Treasuries diverts capital away from income-oriented property vehicles.
If you hold meaningful exposure to these names, the current rate path is already embedded in what those businesses can earn this year and next. Housing functions as a map for identifying where else in your portfolio elevated rates may be doing quiet, cumulative damage.
The Fed minutes are backward-looking. The jobs number is a snapshot. The most actionable forward-looking information enters the picture starting the week of 14 July, when the largest US banks open Q2 reporting season.
Bank earnings function as the economy’s first real-time read on whether corporate America is absorbing the rate environment or beginning to crack under it. Consensus expectations are strong: FactSet projects S&P 500 earnings growth of roughly 22%-24% year over year for Q2, on low-double-digit revenue growth. Prior quarters showed high beat rates on both revenue and earnings estimates.
But the reported numbers matter less than what management teams say about the second half of 2026. Here are the four metrics to watch, in priority order:
Bank CEO commentary on consumer delinquencies and commercial real estate provisioning functions as an early warning system for the broader credit cycle. Historically, guidance revisions from bank management on the rate path and credit conditions have moved sentiment more than the reported earnings figures themselves.
If the banks’ forward guidance reflects continued confidence in consumer health and stable credit, the soft-landing trade remains intact and you can hold or modestly add to quality risk assets. If it signals credit deterioration or pulled guidance, that is your cue to upgrade defensiveness before the broader market reprices. This is not just a financials sector story. It is the earliest available signal on whether the macro environment will remain benign enough to support the aggressive earnings growth expectations priced into the broader S&P 500 for Q2 and beyond.
The core positioning error to avoid right now is building a portfolio that requires rate cuts in 2026 when the Fed’s own projections have removed that possibility.
The alternative is a framework that holds regardless of whether earnings season confirms or challenges the soft-landing thesis. Here is what that looks like in practice.
| Positioning principle | What it means in practice | What to watch that could change it |
|---|---|---|
| Accept higher-for-longer as the base case | Do not build strategies requiring imminent easing when the Fed explicitly entertains a hike | A sustained inflation decline below 3% over multiple readings |
| Favour earnings quality over multiple expansion | Tilt toward pricing power, free cash flow, and balance sheets that do not rely on refinancing at lower rates | A meaningful shift in dot-plot projections back toward 2026 cuts |
| Shorten duration in fixed income | Short-duration Treasuries and investment-grade corporates offer competitive real yields with less rate risk | Clear signals of economic contraction that would bring the long end down |
| Be selective with housing and real estate | Treat housing weakness as a sector headwind that persists without broad recession; demand a margin of safety in valuations | Mortgage rates falling below 5.5% on sustained policy easing |
| Use earnings season to update the macro view | If results and guidance align with strong-jobs, solid-earnings story, hold quality risk; if credit deteriorates, upgrade defensiveness | Bank guidance on H2 consumer delinquencies and CRE provisioning |
Portfolios should be built to rely on real earnings and prudent risk control, not on an aggressive policy pivot that has not materialised.
The practical implication is not to move to cash entirely. Cash and money-market instruments now earn meaningful real returns compared with the post-GFC era, making them genuine competition for risk assets. But the goal is to ensure that every position in your portfolio can generate adequate returns at the current rate level, because waiting for cuts to do the heavy lifting is a strategy the Fed has now explicitly foreclosed.
Short-duration Treasury instruments have moved from a holding pattern to a genuine portfolio allocation in the current rate environment, with three-month T-bills yielding above 3.7% and carrying state tax exemptions that can make them competitive with nominally higher-yielding alternatives on an after-tax basis.
Three signals arrived on 9 July: sticky Fed policy, a tight labour market, and continued housing softness. Read together, they paint a single coherent picture. The economy is holding up, but the rate relief that would unlock the next phase of the cycle is not coming this year. The dot-plot projections push easing out to 2027-2028. That is the operating environment.
Earnings season does not resolve this uncertainty. It provides the next diagnostic window. Major bank results beginning the week of 14 July will either reinforce the soft-landing narrative or start introducing cracks. The positioning framework above is designed for both outcomes.
The single most important variable to watch in the weeks ahead is not whether banks beat their earnings estimates. It is what their H2 guidance says about the credit cycle and consumer health. That is where the next recalibration, if one is needed, will start.
If bank forward guidance signals stable credit and confident consumer outlooks, the current framework holds. If it signals deterioration, that is the specific trigger to revisit your positioning.
This article is for informational purposes only and should not be considered financial advice. Investors should conduct their own research and consult with financial professionals before making investment decisions. Past performance does not guarantee future results. Financial projections are subject to market conditions and various risk factors.
—
The dot plot maps each Federal Reserve official's projected path for the federal funds rate. As of July 2026, all previously projected 2026 rate cuts have been removed, with easing now pencilled in for 2027-2028, meaning any portfolio strategy built around cheaper capital arriving this year is operating on a premise the Fed has explicitly rejected.
Based on the 9 July 2026 FOMC minutes and updated dot plot projections, the Fed has removed all 2026 rate cuts and explicitly raised the possibility of one to two additional hikes if inflation stays above target; reductions are now projected for 2027-2028.
A tight labour market, reflected in the 215,000 weekly claims print, sustains wage growth and consumer spending, which keeps services inflation elevated and gives the Fed no justification to ease; strong employment data is therefore neutral-to-negative for rate-sensitive assets, inverting the usual logic that good economic news equals good market news.
The most important signals are not the headline EPS figures but the forward guidance: net interest margin trends, loan demand, credit quality in commercial real estate, and management commentary on H2 2026 consumer health will reveal whether the soft-landing thesis holds or cracks are forming.
The article recommends favouring companies with pricing power, free cash flow, and debt structures that do not depend on refinancing at lower rates; shortening fixed income duration toward short-duration Treasuries; and treating housing and real estate names as persistent headwinds rather than rate-cut recovery plays.