ASX’s 63-Point Spread: Winners and Losers in the Oil Shock
2 hrs ago


A year of geopolitical shocks, an oil price spike that briefly sent crude toward US$120 per barrel, three RBA rate hikes, and rolling trade tensions: the list of reasons FY2025-26 should have punished portfolios is long. Yet balanced growth superannuation funds still returned approximately 9%. That headline number is reassuring. It is also incomplete.
The gap between the year’s best and worst asset classes was unusually wide. Australian investors who leaned heavily into domestic equities, A-REITs, or bond-heavy allocations experienced a materially different year from those with genuine global diversification and a growth tilt. Knowing the blended outcome matters less than understanding which components drove it and which held it back.
Here is what the full asset class performance data across Australian and global markets actually tells you: which allocation decisions mattered, which narratives turned out to be noise, and what the year’s patterns signal about portfolio construction heading into the next cycle.
The spread between the year’s strongest and weakest performers tells the story before any analysis does. Global equities returned approximately 23% in local currency terms. A-REITs lost approximately 2.2%. That is a gap of more than 25 percentage points between two mainstream asset classes sitting in portfolios side by side.
| Asset Class | FY2025-26 Return (Approx.) | Key Takeaway |
|---|---|---|
| Global equities (local currency) | ~23% | Standout performer; Japan, Asia, and China led |
| Global equities (AUD) | ~15% | AUD appreciation trimmed but did not erase gains |
| Australian equities | ~6.1% | Positive, but well behind global shares |
| Global listed property (REITs) | ~14.4% | Strong recovery from 2022-24 downturn |
| A-REITs | ~-2.2% | Worst mainstream performer; highly rate-sensitive |
| Australian residential property | ~7.3% (national) | Solid year overall; late softening in final quarter |
| Cash | ~3.9% | Laggard among major assets aside from A-REITs |
| Gold | Strong H1, faded H2 | Worked as a hedge during peak stress, then lost momentum |
| Bitcoin | Gains then pullback | Year of two halves; weak diversification benefit |
Balanced growth super funds returned approximately 9% for FY2025-26, according to Dr Shane Oliver at AMP. That blended outcome sits between the extremes shown above, and understanding which components pulled it up and which dragged it down is where the real portfolio insight lives.
Where your money was allocated mattered far more than whether you were invested at all this year. The 9% balanced fund return is a reasonable result, but it masks significant divergence beneath the surface.
The macro headwinds arrived in sequence, each one looking severe enough on its own to justify a defensive crouch:
The RBA’s three consecutive rate increases across FY2025-26 unfolded against a backdrop of stubborn trimmed mean inflation holding above the 2-3% target band, with eight of nine Board members voting for the final hike in May and forward guidance language deliberately preserving full policy optionality through to the July 2026 meeting.
Any one of these would normally dominate an annual review. Together, they looked like a recipe for negative returns. They were not.
The relationship between geopolitical risk and equity resilience follows a consistent pattern across modern market history: events are processed as probability-adjusted inputs to forward earnings rather than proportional headline shocks, which is why Goldman Sachs attributed roughly 12% EPS growth, not geopolitical resolution, as the primary driver of S&P 500 performance in the months the Iran conflict dominated headlines.
Even as recession fears resurfaced in the wake of the oil shock, global growth came in at roughly 3% for the year. Company earnings proved considerably more resilient than analysts had pencilled in, providing a firm foundation that offset much of the anxiety generated by geopolitical and rate headwinds.
AI optimism continued to drive gains in US technology equities, but the genuine surprise leaders were Japanese, Asian, and Chinese equities, which outperformed other major global share markets. Despite its continuing property sector difficulties, China kept expanding at a solid pace by pivoting exports toward non-US markets to compensate for reduced American demand.
The fact that earnings held up globally is the single most important explanation for why diversified investors avoided the downturn many feared. Your portfolio’s resilience, or lack of it, likely traced directly to how much earnings-driven global exposure you held.
Most investors think of “property” as a single allocation. FY2025-26 made the cost of that assumption concrete:
That is a gap of more than 16 percentage points between global REITs and their Australian-listed counterparts. Same asset class label, entirely different outcomes.
The 7.3% national figure disguises sharp geographic divergence. Perth, Darwin, and Brisbane posted robust price growth. Sydney went largely sideways for the year. Melbourne saw values move into negative territory.
Recent reporting on city-level residential price divergence, drawing on Cotality data through June 2026, confirms the geographic split the national headline figure conceals: Perth and Brisbane recorded solid gains, Sydney was largely flat, and Melbourne posted negative annual returns.
The final quarter added a further complication: residential prices softened nationally as the RBA’s rate hikes, budget measures targeting property investors, and a deterioration in household confidence all weighed on market activity. The full-year number looks healthy. The exit trajectory does not.
If your portfolio description includes “property” as a single line item, this year is a direct prompt to break that category apart. Each of these three exposures responded to different drivers, and treating them as interchangeable left investors exposed to outcomes they did not anticipate.
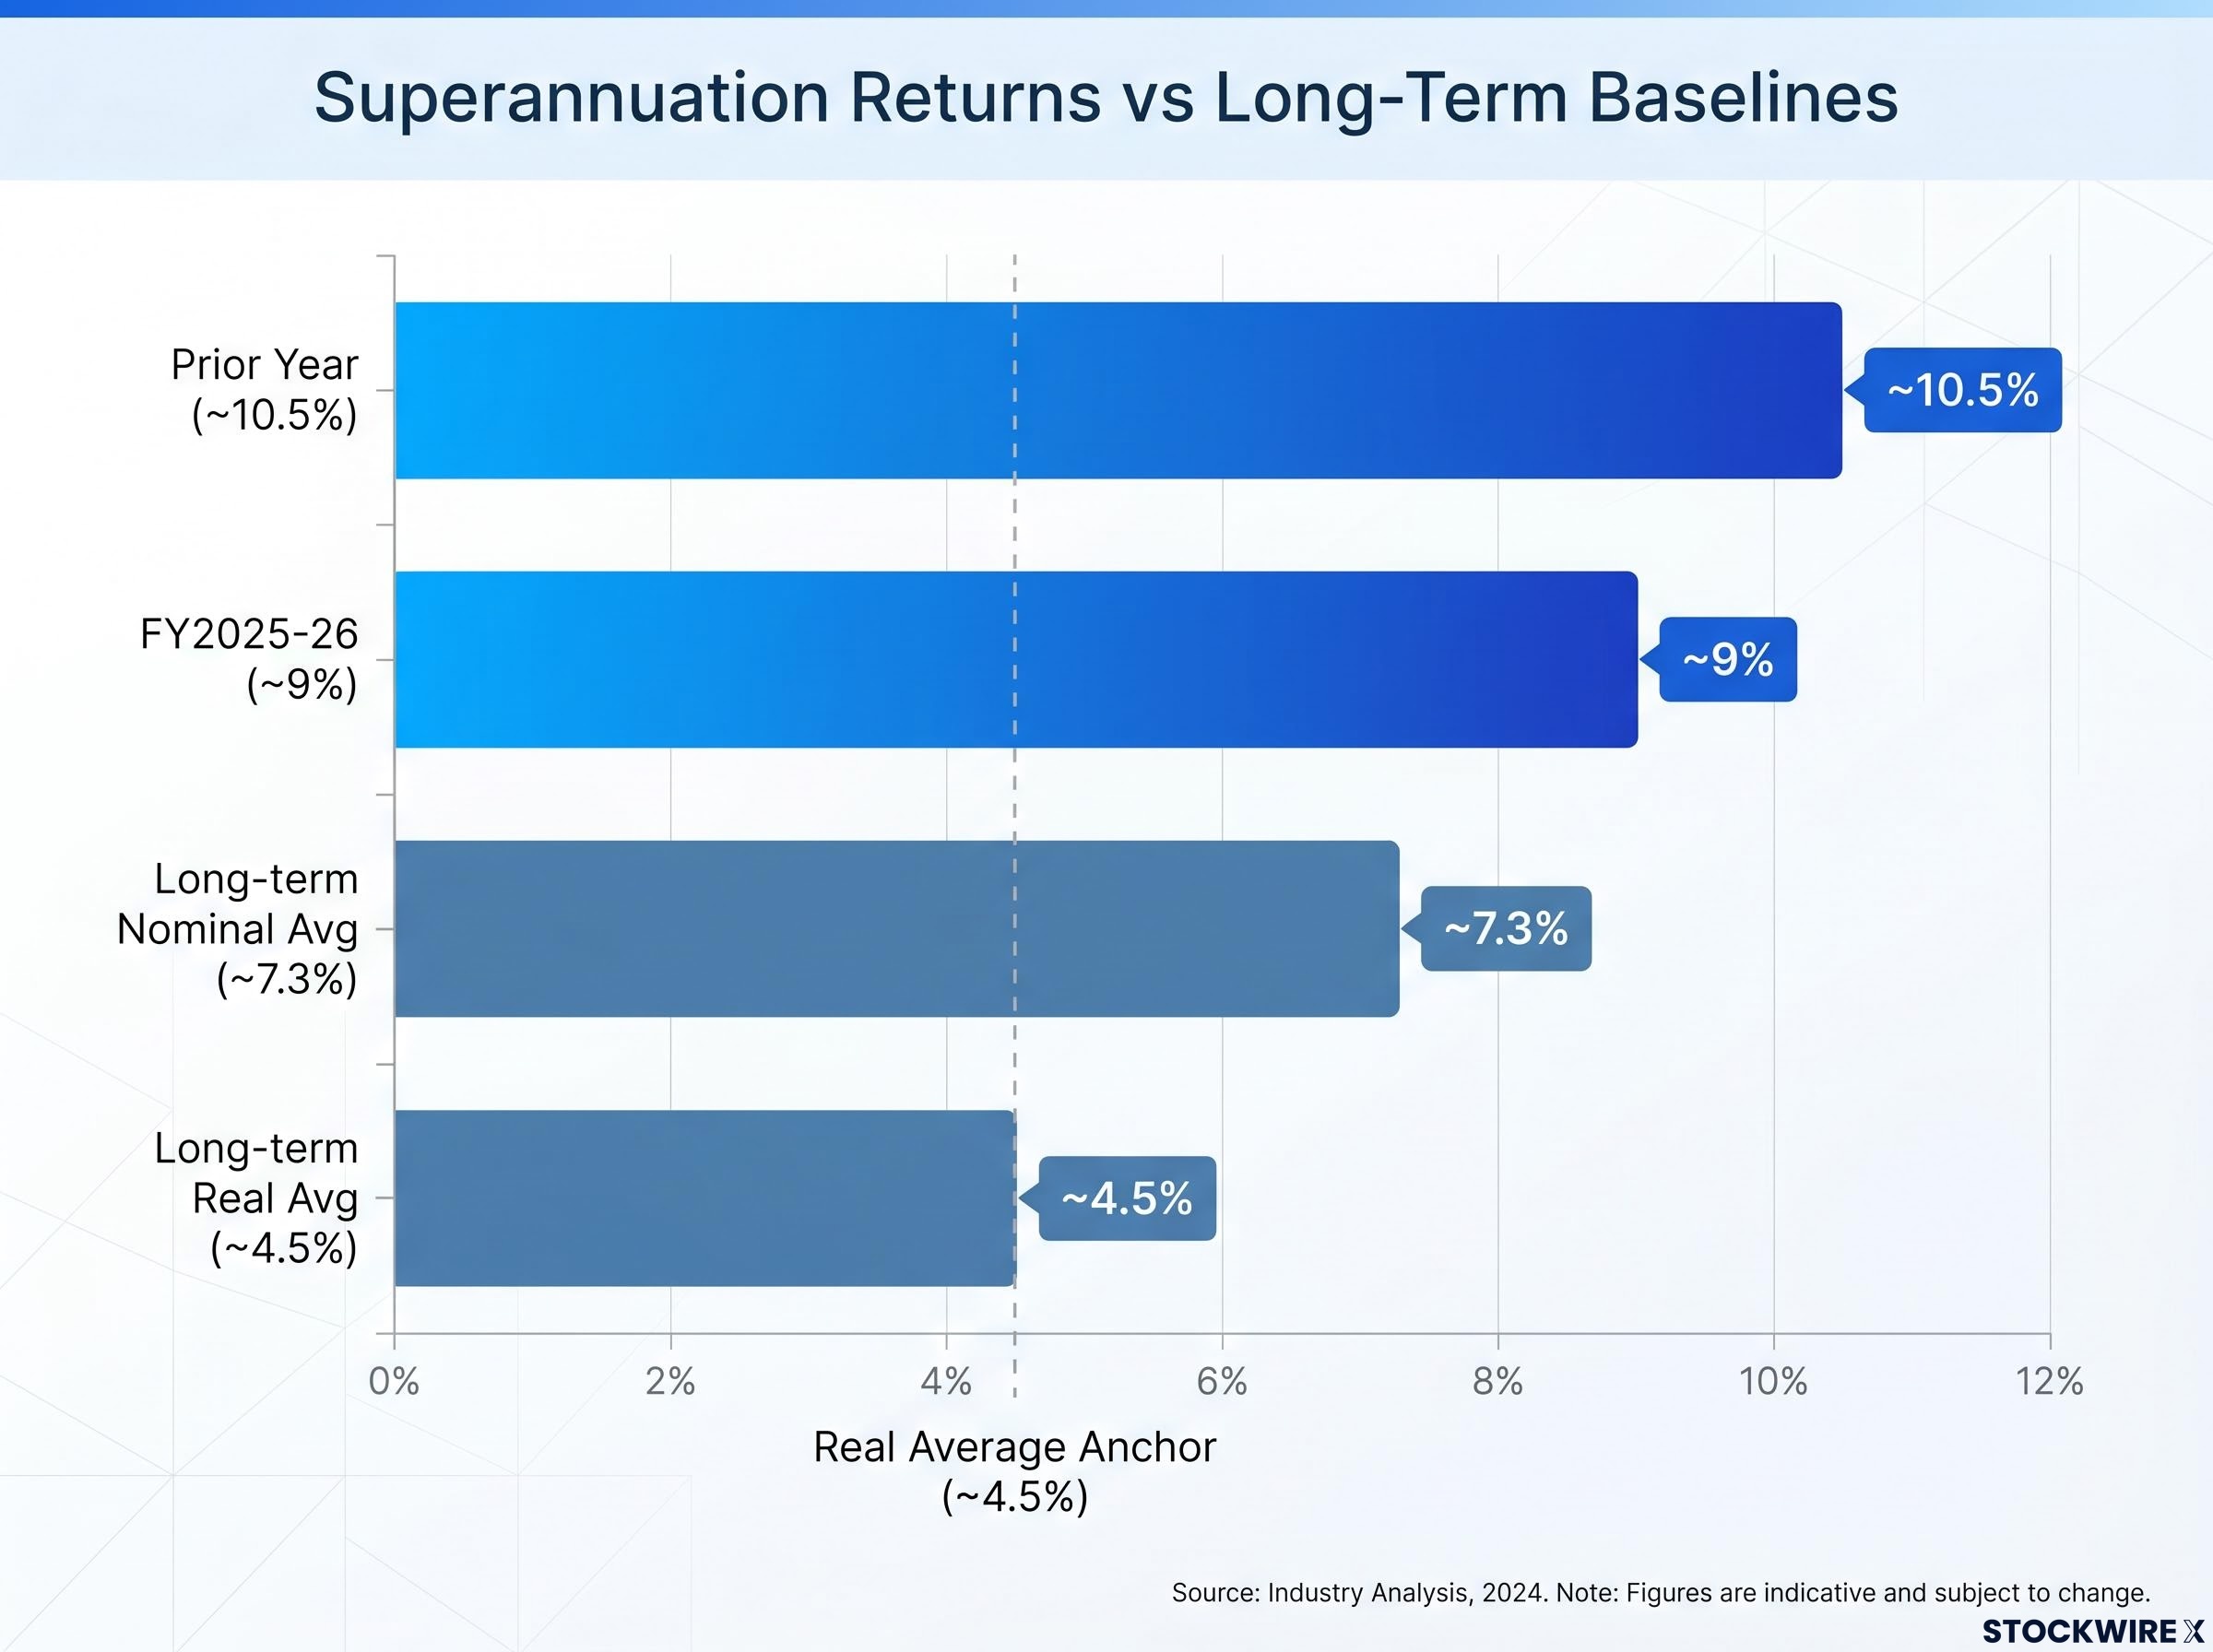
The 9% balanced growth super fund return for FY2025-26 is a strong result. It also marks the fourth straight financial year of above-average gains since the 2021-22 inflation shock dragged on returns, leaving account balances not only restored but meaningfully higher. But the number needs context before it becomes a forward expectation.
The long-term real return of approximately 4.5% after inflation is the meaningful anchor for retirement planning, not whether this year beat last year. These figures are net of fees and taxes, representing the actual return landing in members’ accounts, according to data from Dr Shane Oliver at AMP sourced from Bloomberg.
Four consecutive strong years raise, rather than reduce, the statistical probability of a weaker year ahead. That is not alarmist; it is arithmetic. Historical data consistently shows that extended positive runs are followed by periods of mean reversion.
The four-decade decline in Australian government bond yields was the primary structural engine behind superannuation return benchmarks that now look like a permanent baseline but may not repeat, a dynamic that makes the long-run real return of approximately 4.5% per annum a more reliable planning anchor than any single year’s headline figure.
The 9% figure is above average, not a new baseline. Treating it as a forward expectation is the specific cognitive error this year’s context should help you avoid.
One structural pattern connected the year’s underperformers. A-REITs at approximately -2.2%, weak fixed income returns, domestic bonds under pressure, and parts of the ASX that disappointed all shared a common thread: direct exposure to the RBA’s policy direction.
The rate transmission channels connecting RBA policy to A-REIT valuations operate through four distinct mechanisms: the signal the rate path sends about economic conditions, the discount rate effect on future distributions, the direct cost of REIT debt financing, and the relative yield competition with government bonds, which is why a rate-hiking cycle can compress A-REIT prices even when underlying property fundamentals remain stable.
Global assets less tied to the RBA generally outperformed. The comparison is stark:
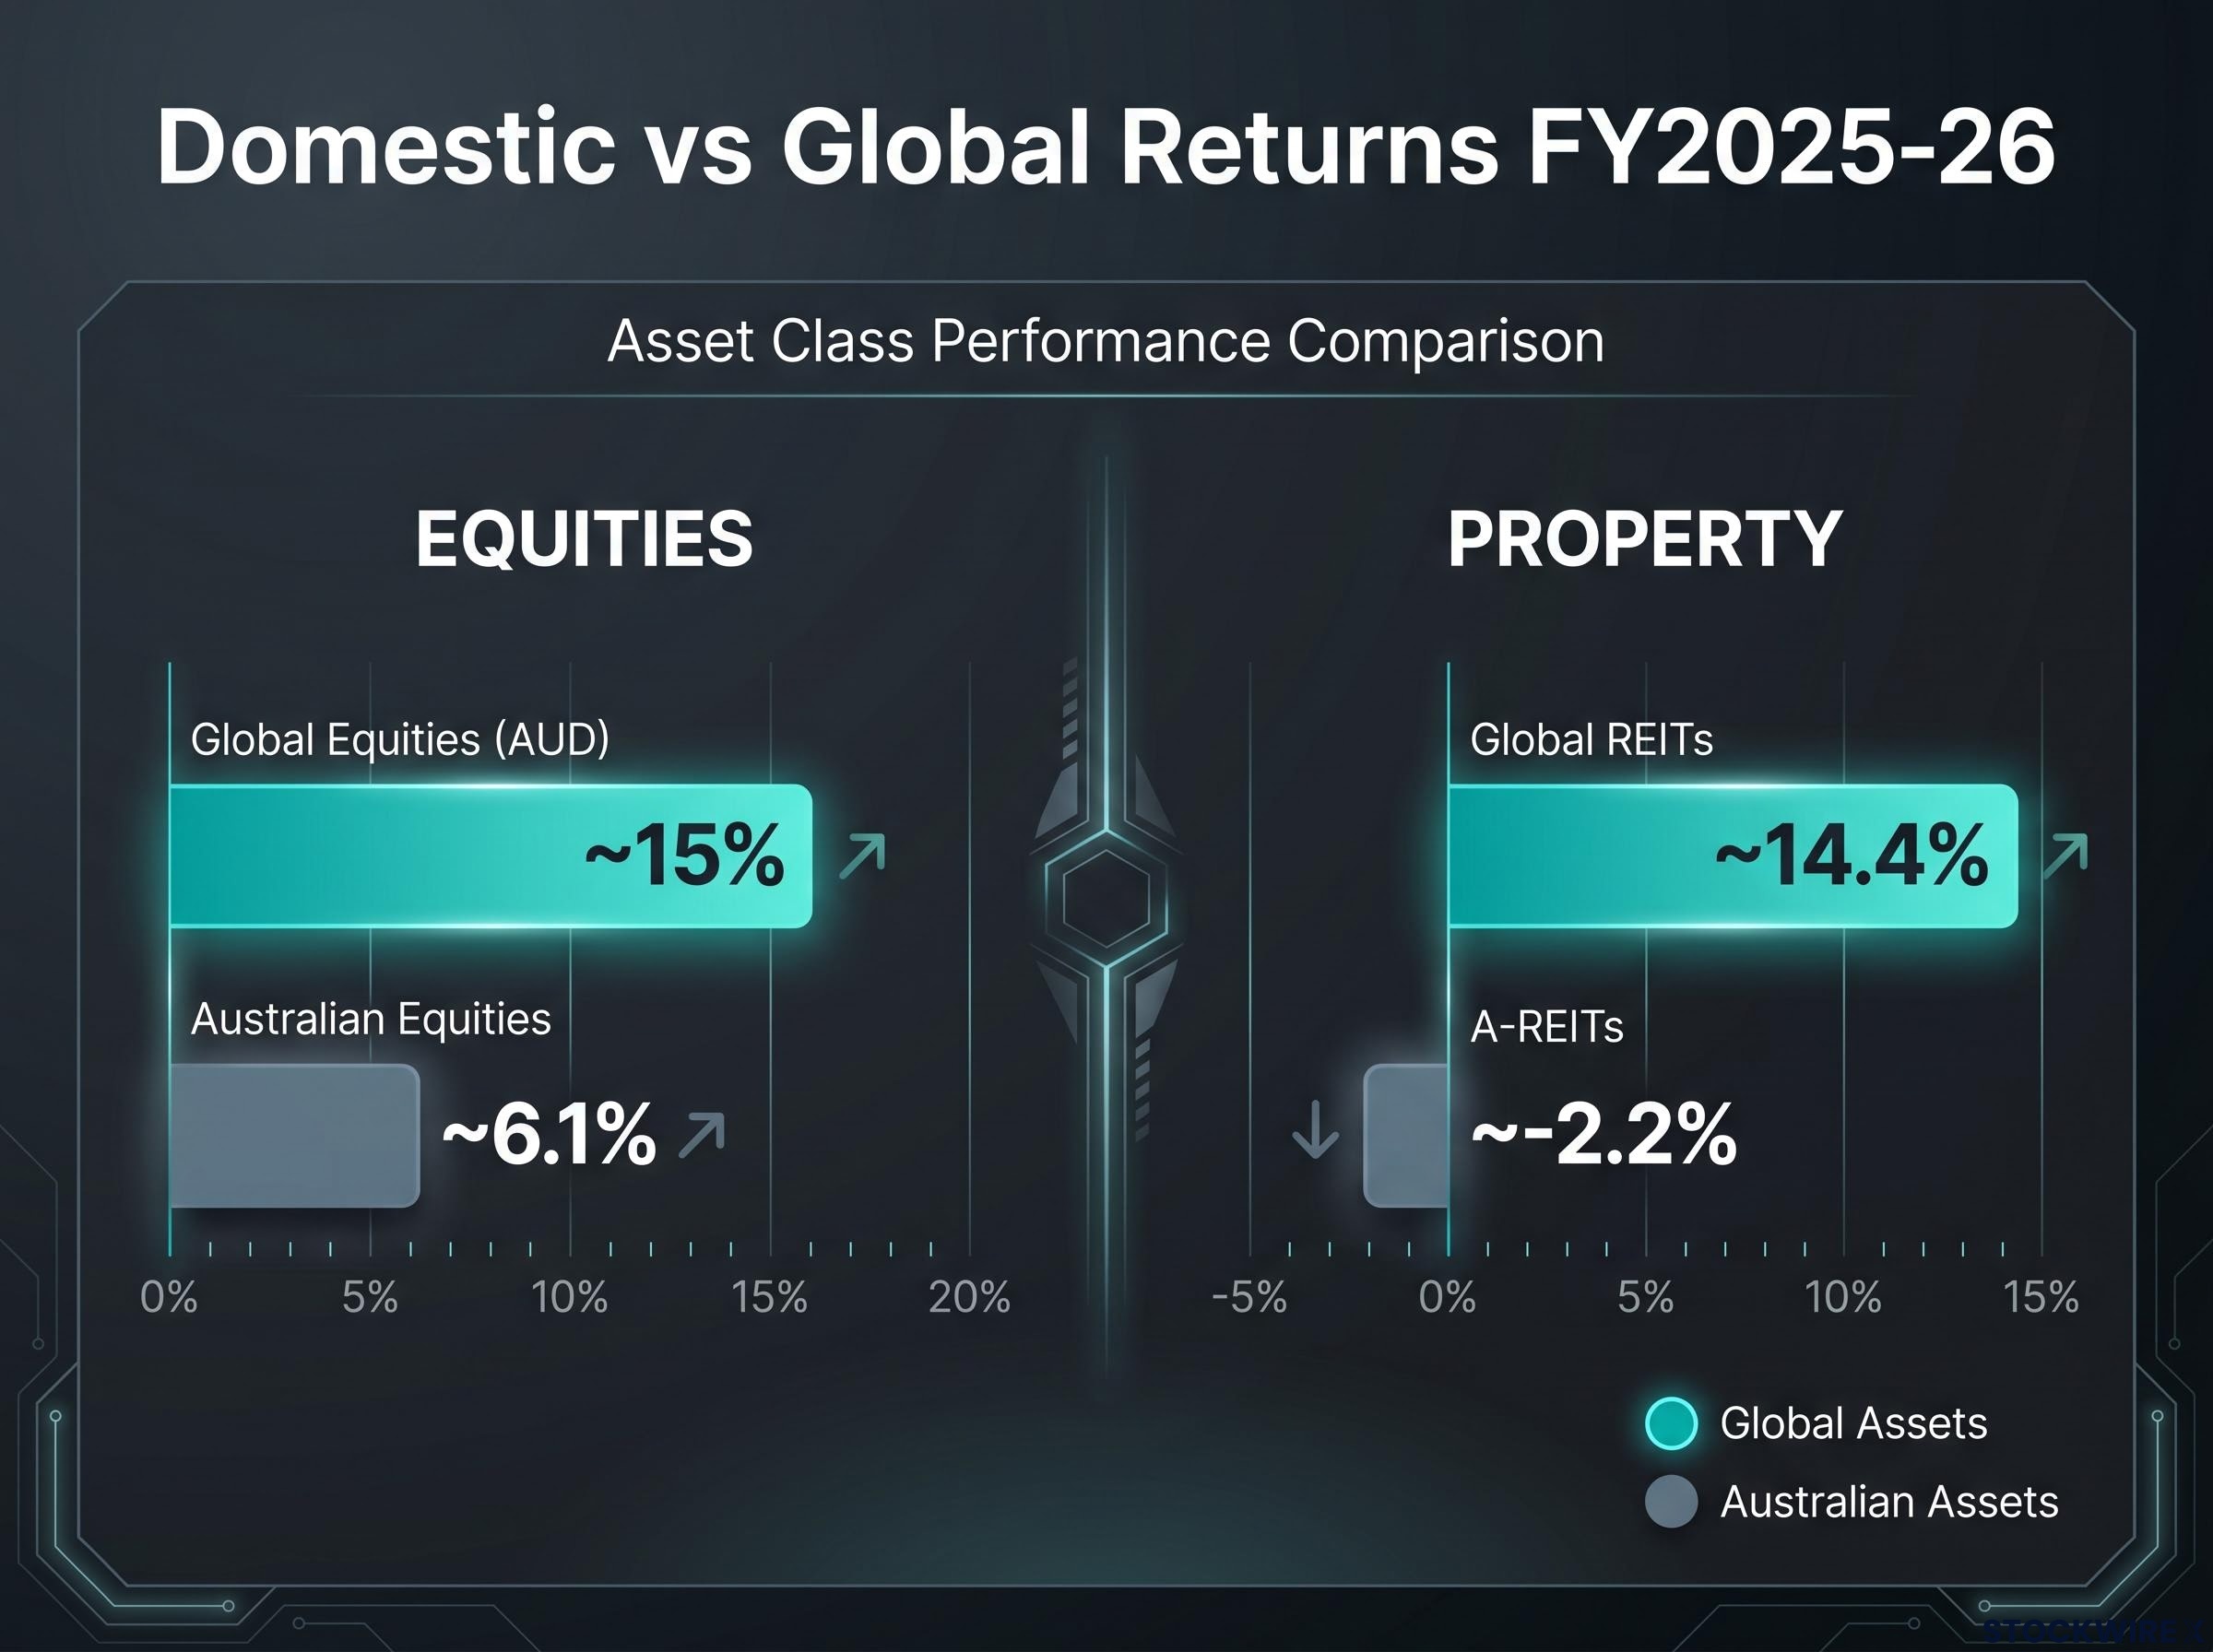
| Asset | FY2025-26 Return (Approx.) | Rate-Sensitivity |
|---|---|---|
| Australian equities | ~6.1% | High (RBA-exposed) |
| Global equities (AUD) | ~15% | Low (diversified rate exposure) |
| A-REITs | ~-2.2% | High (RBA-exposed) |
| Global REITs | ~14.4% | Low (diversified rate exposure) |
| Cash | ~3.9% | Moderate (rate-linked) |
Cash at 3.9% declined from the prior year as the RBA cut rates during 2025 before reversing course. Bond returns were weak throughout the year, belying their defensive reputation, as sticky inflation and central bank rate-hike signalling combined with sovereign budget deficits above 5% of GDP across several major economies, including the United States, to sustain upward pressure on yields.
Investors with equity allocations concentrated in Australian shares at approximately 6.1% significantly underperformed those with genuine global diversification at approximately 15% in AUD terms. How much of your portfolio’s underperformance or outperformance relative to the 9% balanced fund average traces directly to Australian interest rate exposure is the diagnostic question worth asking of your own holdings.
The RBA’s hawkish pivot was not a surprise event. It was a domestic policy decision with predictable effects on rate-sensitive assets. Identifying where that concentration sits before the next rate cycle begins is the practical takeaway.
The year’s patterns coalesce into five portfolio construction lessons that apply beyond this single financial year:
Cash and bonds dragged on portfolio performance in what turned out to be another strong year for risk assets. For investors with long time horizons and growth-heavy allocations, the cost was modest. For investors approaching or in retirement, the calculus is different.
Defensives provide liquidity, capital stability, and drawdown protection. These qualities matter most when the eventual market setback arrives, not during the good years. Abandoning defensive allocations based on recent underperformance is a decision that looks rational right up until the year it proves costly. Four consecutive positive years make that year statistically more likely, not less.
FY2025-26 delivered another above-average result for diversified Australian investors. The roughly 9% balanced fund result comfortably exceeds the decade-long nominal average of 7.3% per annum and is substantially higher than the real return of around 4.5% per annum once inflation is stripped out.
But four consecutive positive financial years are a statistical signal to review portfolio resilience, not an invitation to increase risk in pursuit of a fifth. The meaningful benchmark remains the long-run real return, which is the number that actually determines retirement outcomes over decades.
The value of FY2025-26 is not the number itself. It is what the year’s patterns revealed about where structural exposures sit in your portfolio: geographic concentration, rate sensitivity, property conflation, and the temptation to treat an above-average year as the new normal. Those are the questions worth answering before the next cycle begins.
This article is for informational purposes only and should not be considered financial advice. Investors should conduct their own research and consult with financial professionals before making investment decisions. Past performance does not guarantee future results.
Global equities were the standout performer, returning approximately 23% in local currency terms and around 15% in AUD terms after the Australian dollar appreciated. Japanese, Asian, and Chinese equities led gains within that category.
A-REITs lost approximately 2.2% because they are highly sensitive to RBA rate decisions, and the Reserve Bank delivered three successive rate hikes across the year. Investor-unfriendly tax changes introduced in the federal budget added further pressure on top of the rate headwind.
Balanced growth super funds returned approximately 9% for FY2025-26, according to Dr Shane Oliver at AMP. That result is above the decade-long nominal average of approximately 7.3% per annum and marks the fourth consecutive financial year of above-average gains.
Australian residential property rose approximately 7.3% nationally, but with sharp city-level divergence: Perth and Brisbane posted solid gains while Melbourne moved into negative territory. Global listed REITs returned approximately 14.4%, more than 16 percentage points ahead of A-REITs and significantly ahead of the national residential average.
The long-term real return for Australian balanced growth super funds is approximately 4.5% per annum after inflation, net of fees and taxes, over the preceding decade. This figure is the meaningful anchor for retirement planning because it reflects what members actually receive in purchasing power terms, unlike any single year's headline number.