Delivery Hero Shareholders Reject Uber’s €33 Bid, Demand €40+
12 mins ago
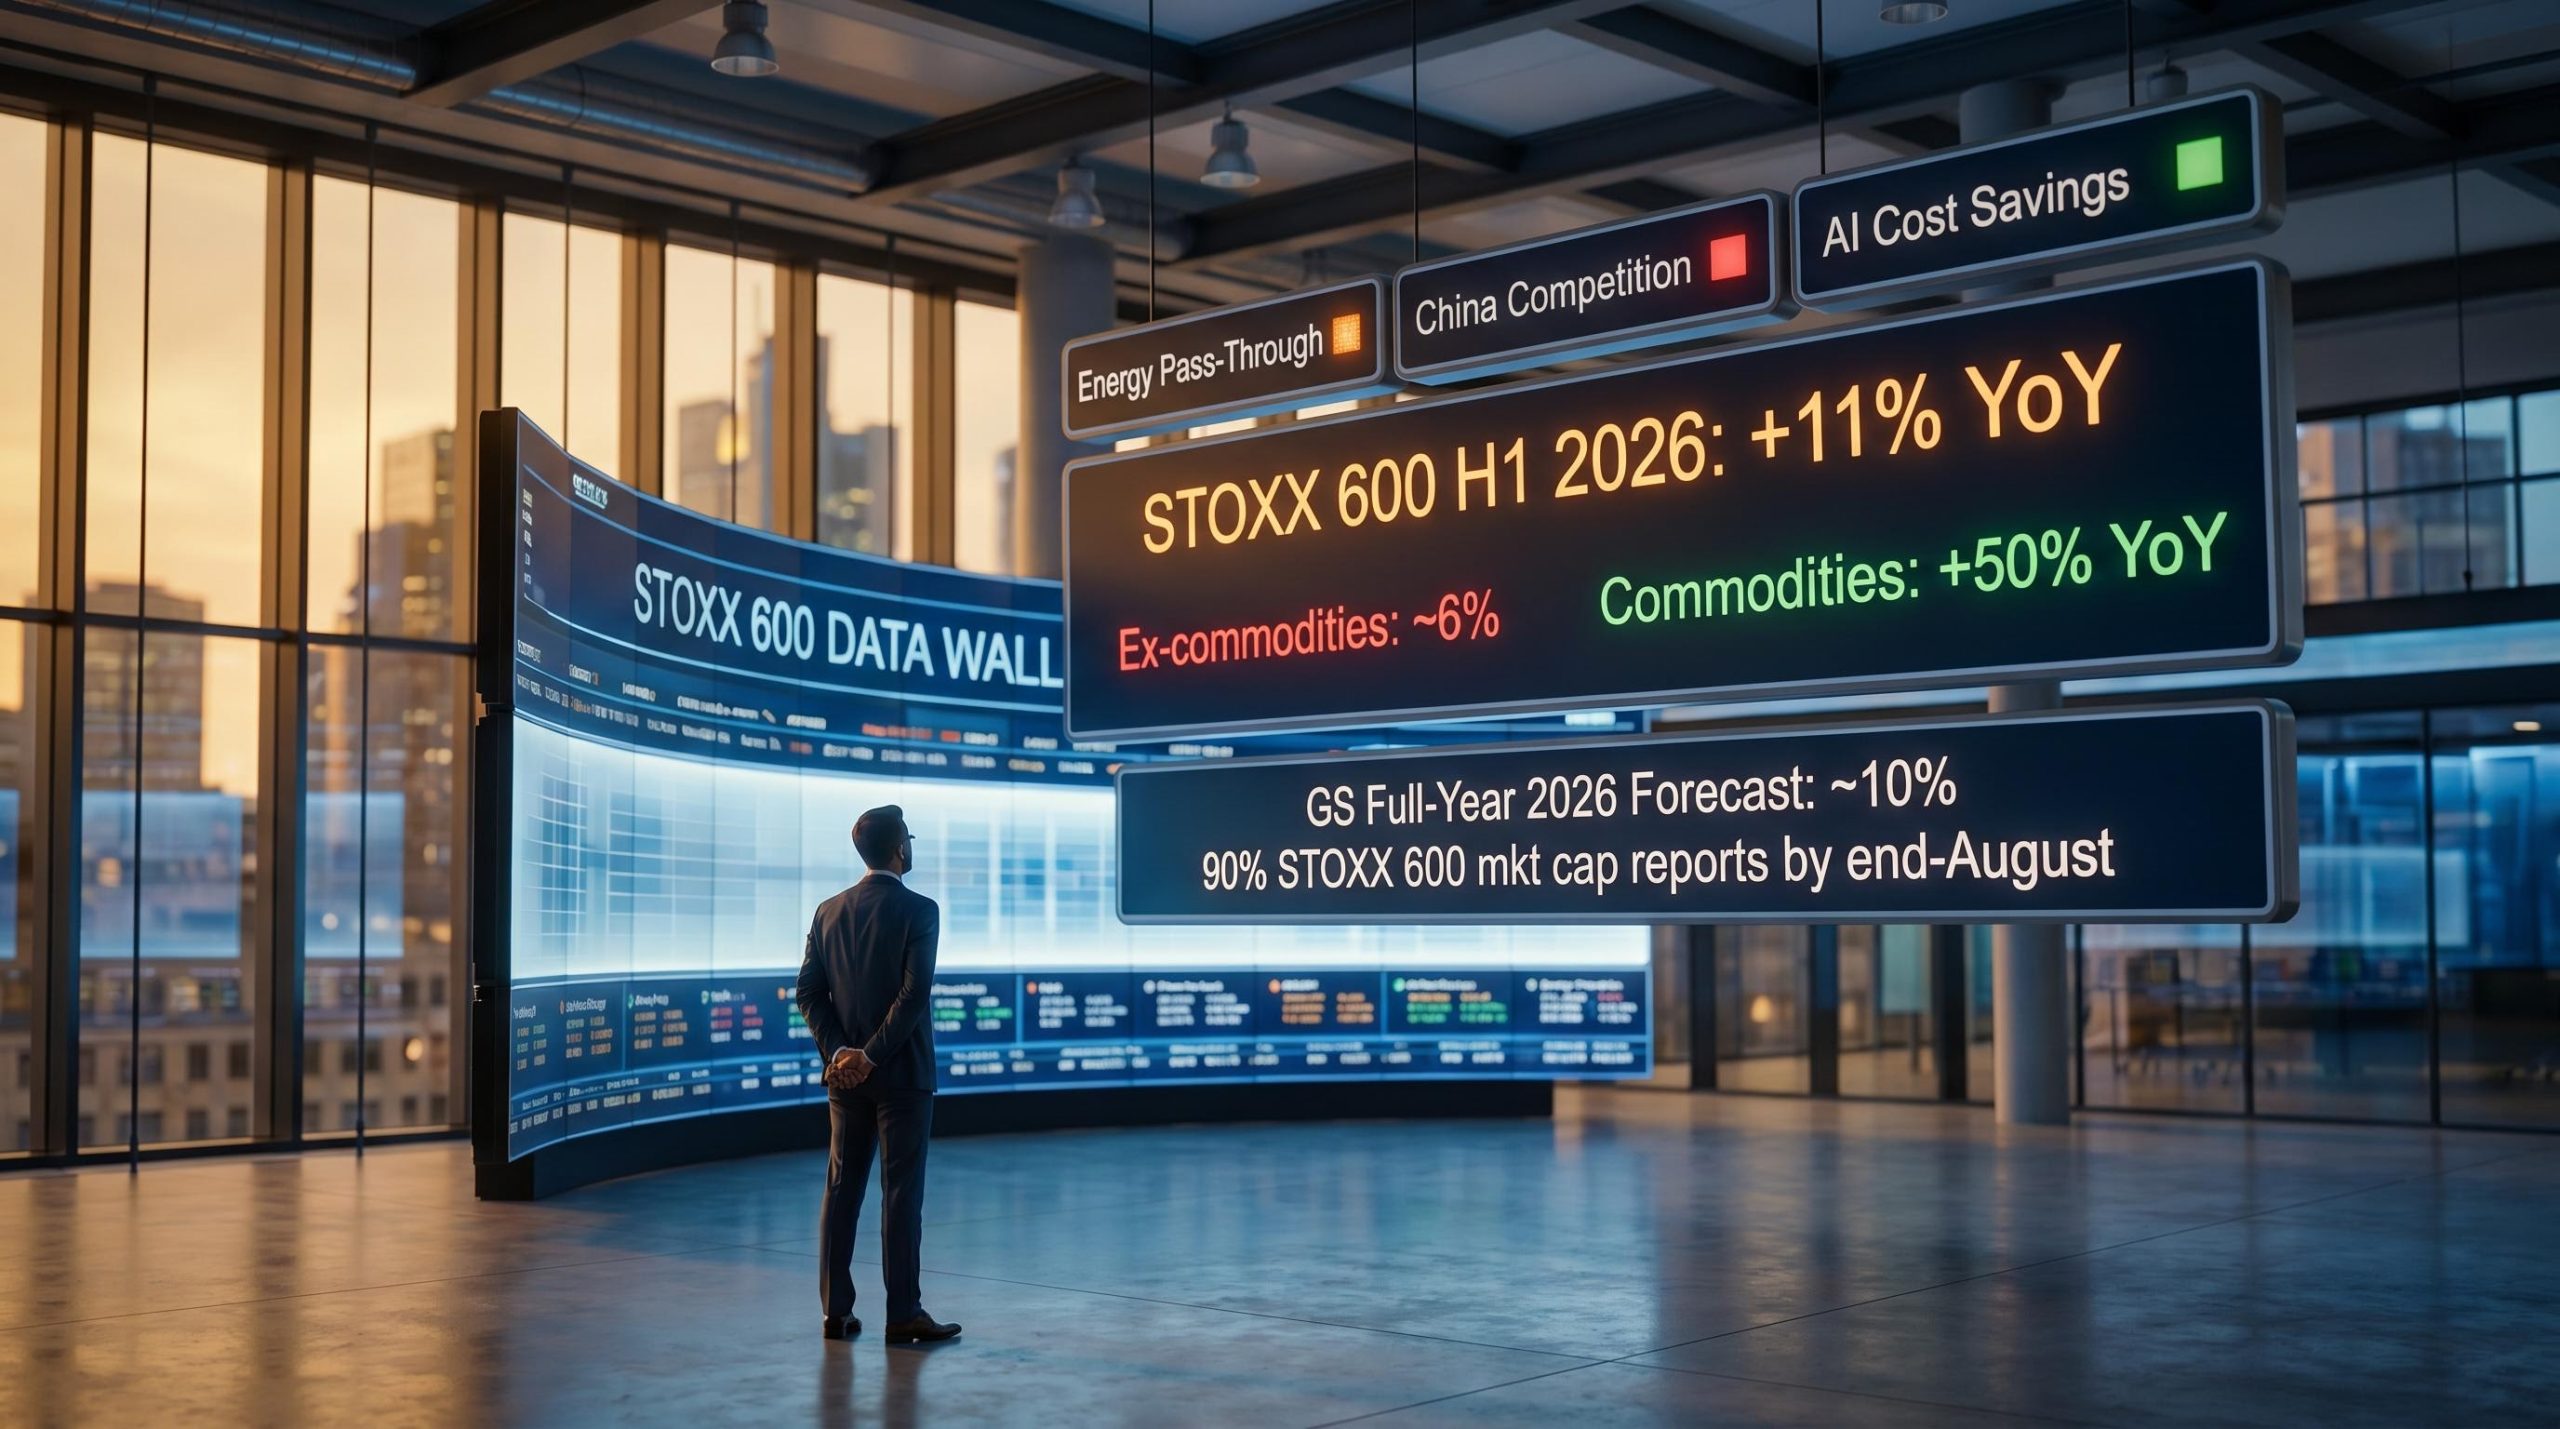
European equity valuations have already priced in an optimistic outcome. Market consensus points to roughly 11% year-on-year earnings growth for the STOXX 600 in H1 2026, with banks and technology names having re-rated sharply over the course of Q2. When expectations are this rich, reporting season stops being a confirmation exercise and becomes a stress test.
Three specific areas are in focus for Goldman Sachs as Europe’s corporate earnings season gets under way. Disclosure activity reaches its highest concentration in the final week of July 2026, with the period through end-August expected to account for over 90% of STOXX 600 market capitalisation by reporting volume. In this environment, Goldman’s European equity strategists are moving beyond simple earnings-per-share scoreboards. Their analysis examines structural durability across three distinct questions: how energy cost pressure travels through the value chain, where European companies stand against Chinese rivals, and whether AI investment is showing up in measurable cost improvements on the income statement.
Those three signals will determine which European equities hold their valuations through this season and which give back their Q2 gains. Here is the framework for separating genuine structural winners from companies riding the cyclical tailwind, and exactly what to look for in each set of results.
The macro case for European equities looks solid on the surface. It is worth sitting with that for a moment before examining why that strength is actually the problem.
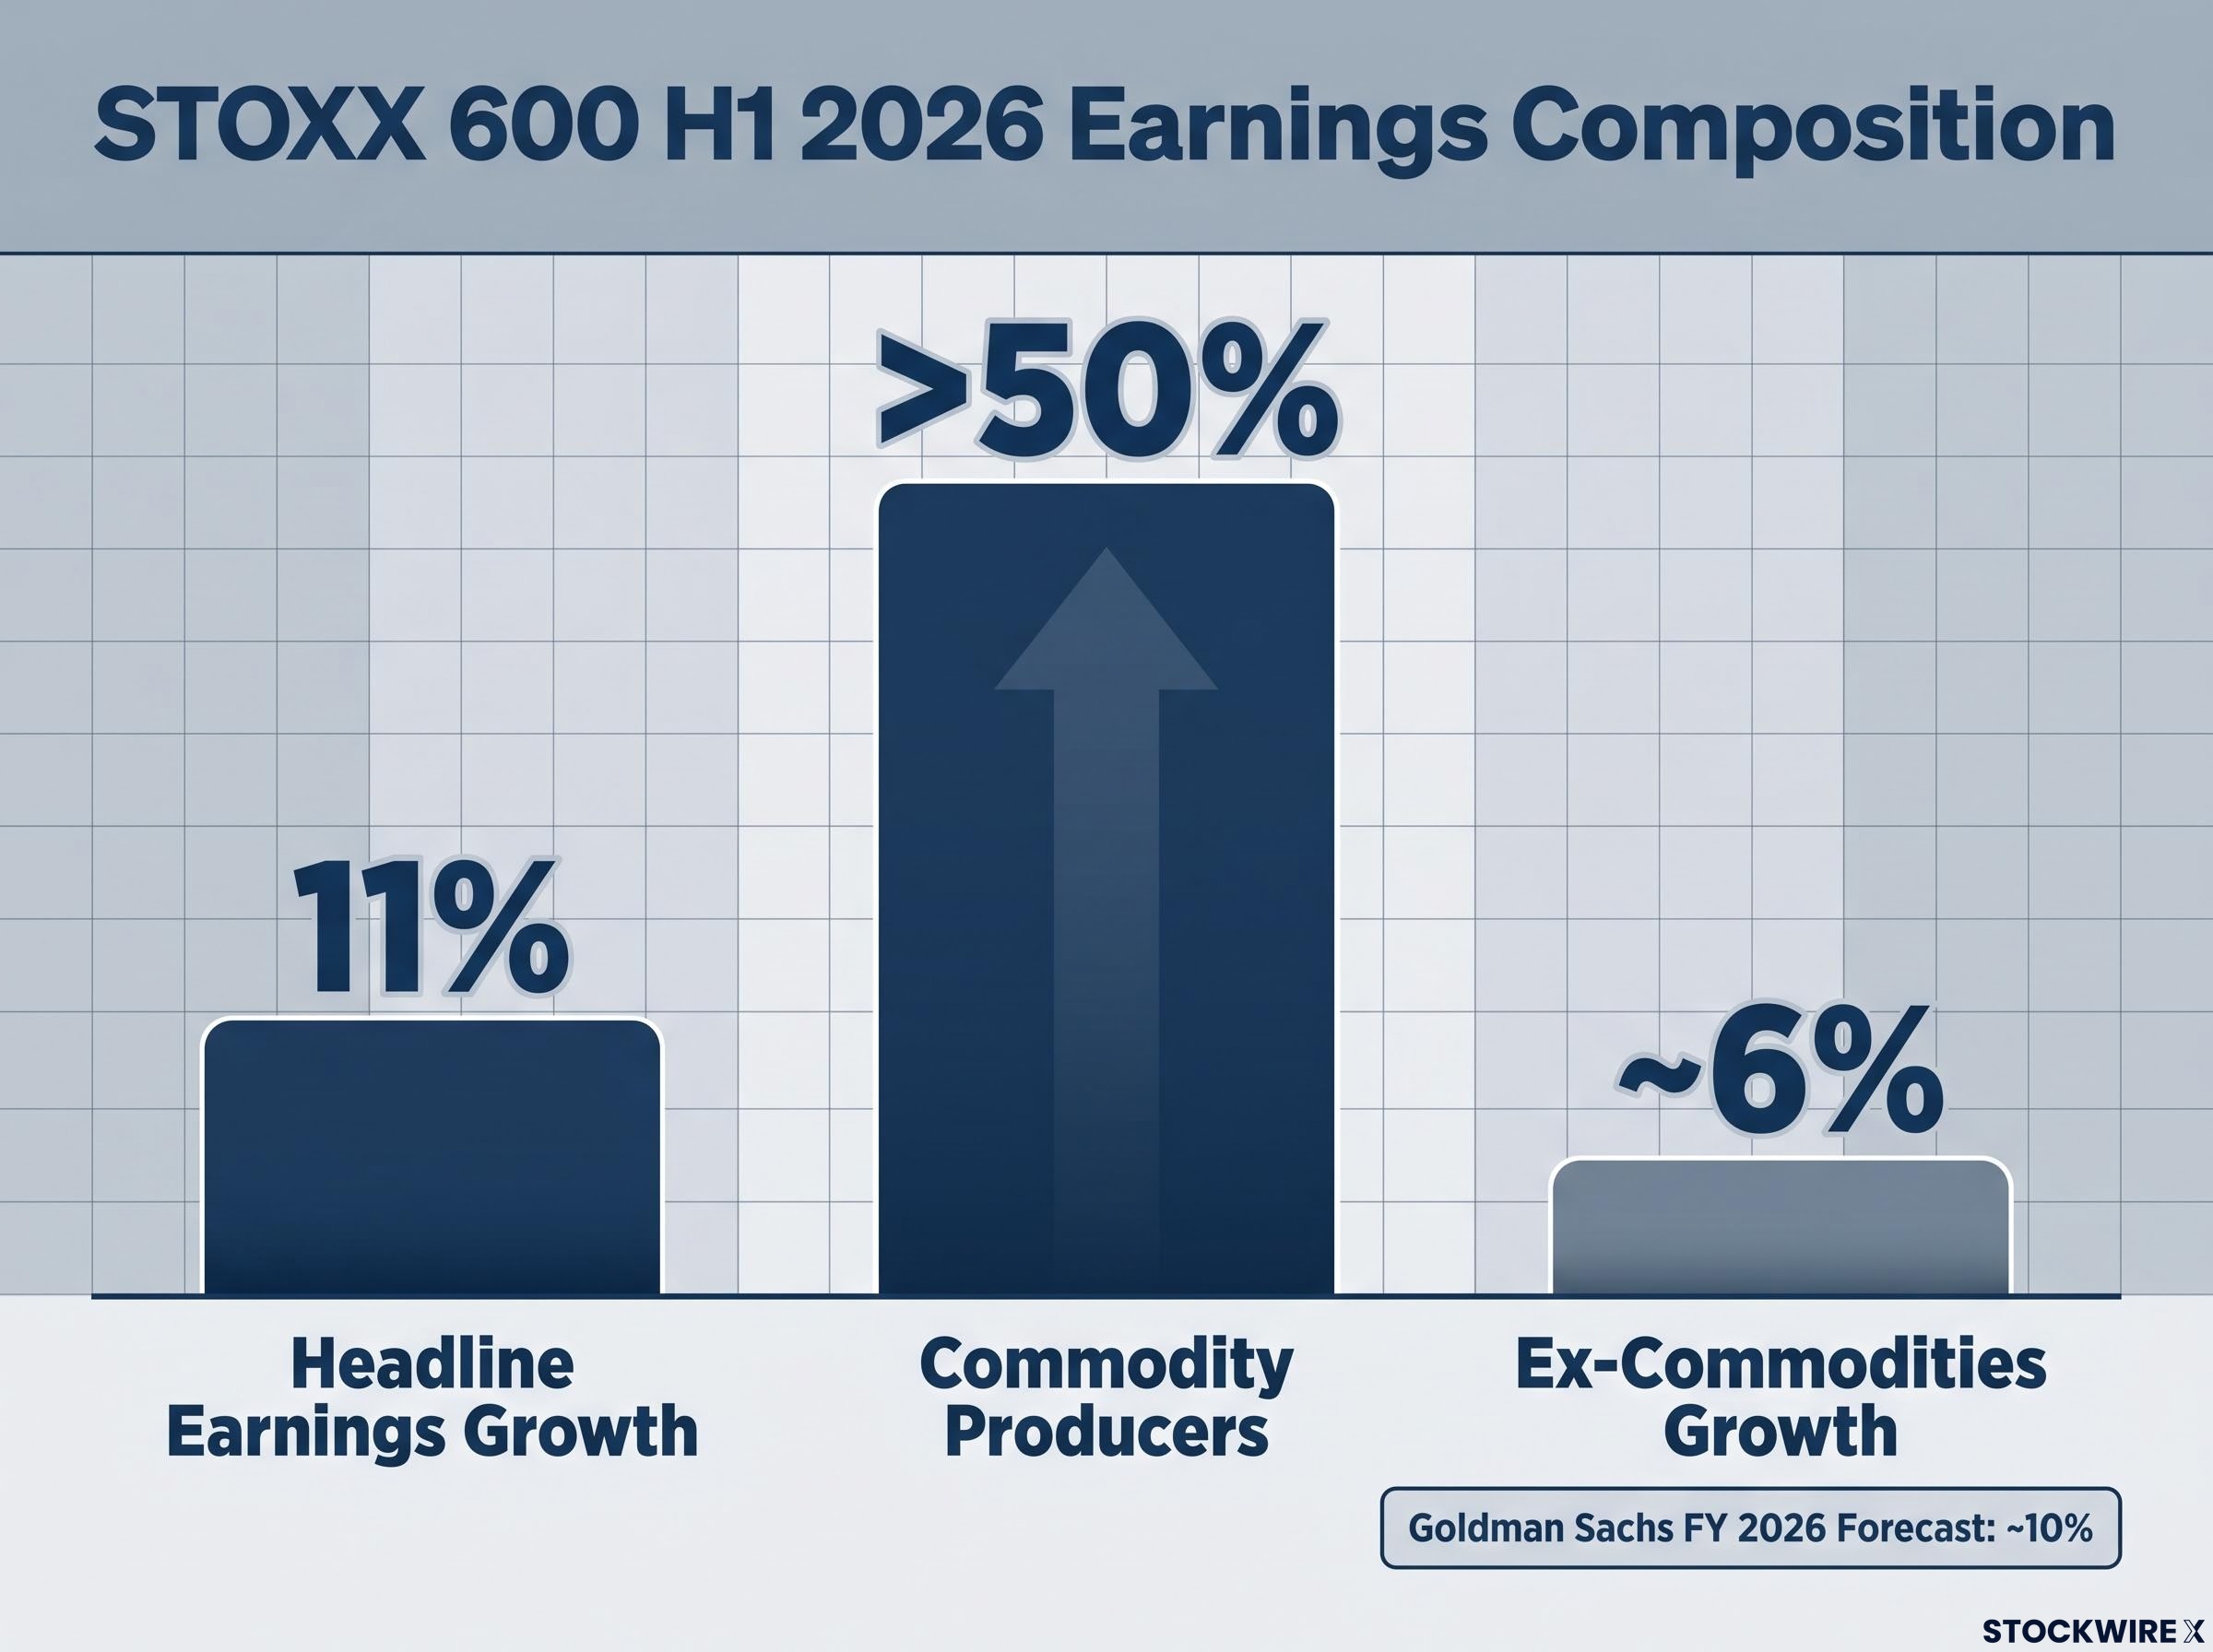
The headline earnings growth figure tells a comfortable story: approximately 11% year-on-year for the STOXX 600 in H1 2026. Look past the aggregate, however, and the composition becomes more complicated. Commodity producers have delivered year-on-year earnings growth of over 50%, providing the bulk of the index’s lift. Once that sector is excluded, growth falls to around 6%, meaning the headline figure is doing considerable flattering work on behalf of one concentrated pocket of outperformance.
For investors wanting to trace exactly how that commodity distortion was built into the headline figure, our full explainer on Goldman’s STOXX 600 commodity revision breaks down how non-commodity margins came in flat against a consensus forecast of 100 basis points of improvement.
Goldman Sachs’ European equity strategists warn of “sharper reactions for misses” as richer valuations in banks and technology amplify downside risk when companies disappoint or guide cautiously.
— Goldman Sachs European equity strategy, early July 2026
The firm’s own full-year 2026 forecast puts STOXX 600 earnings growth at around 10%, a figure that sits comfortably with consensus but carries a demanding implicit requirement for banks and technology. Both sectors saw price-to-earnings multiples expand through Q2, creating a situation where those valuations now require results and guidance that can justify the new levels, not merely match prior expectations. That 11% headline will appear in plenty of commentary over the coming weeks; understanding that it is doing most of its work for commodity producers is the first step toward reading this season accurately.
European earnings calls have mentioned artificial intelligence with increasing frequency over the past several reporting seasons. If that has made you sceptical, the scepticism is warranted. The question for H1 2026 is not whether companies talk about AI; it is whether they can show you the numbers.
Goldman Sachs is making this shift explicitly. After multiple seasons of strategic AI commentary from management teams, the firm now wants P&L-level evidence, meaning specific line items rather than themes.
NBER firm-level AI adoption research covering nearly 6,000 executives found that more than 90% reported no measurable AI impact on employment or labour productivity over three years, making the gap between strategic AI commentary and P&L-level evidence a documented pattern rather than a company-specific anomaly.
Goldman Sachs will track “management discussion on AI usage and on the related cost reductions” as one of its three primary watchpoints this earnings season.
— Goldman Sachs European equity strategy, early July 2026
The income statement has three specific locations where genuine AI-driven savings should be visible:
The sector dynamics matter here. Financials and business services, where process automation is more mature, are most likely to show clear, quantified savings first. Industrials may highlight predictive maintenance and faster design cycles. Professional services face a more complex picture, as AI can reduce billable hours and alter revenue models as well as costs.
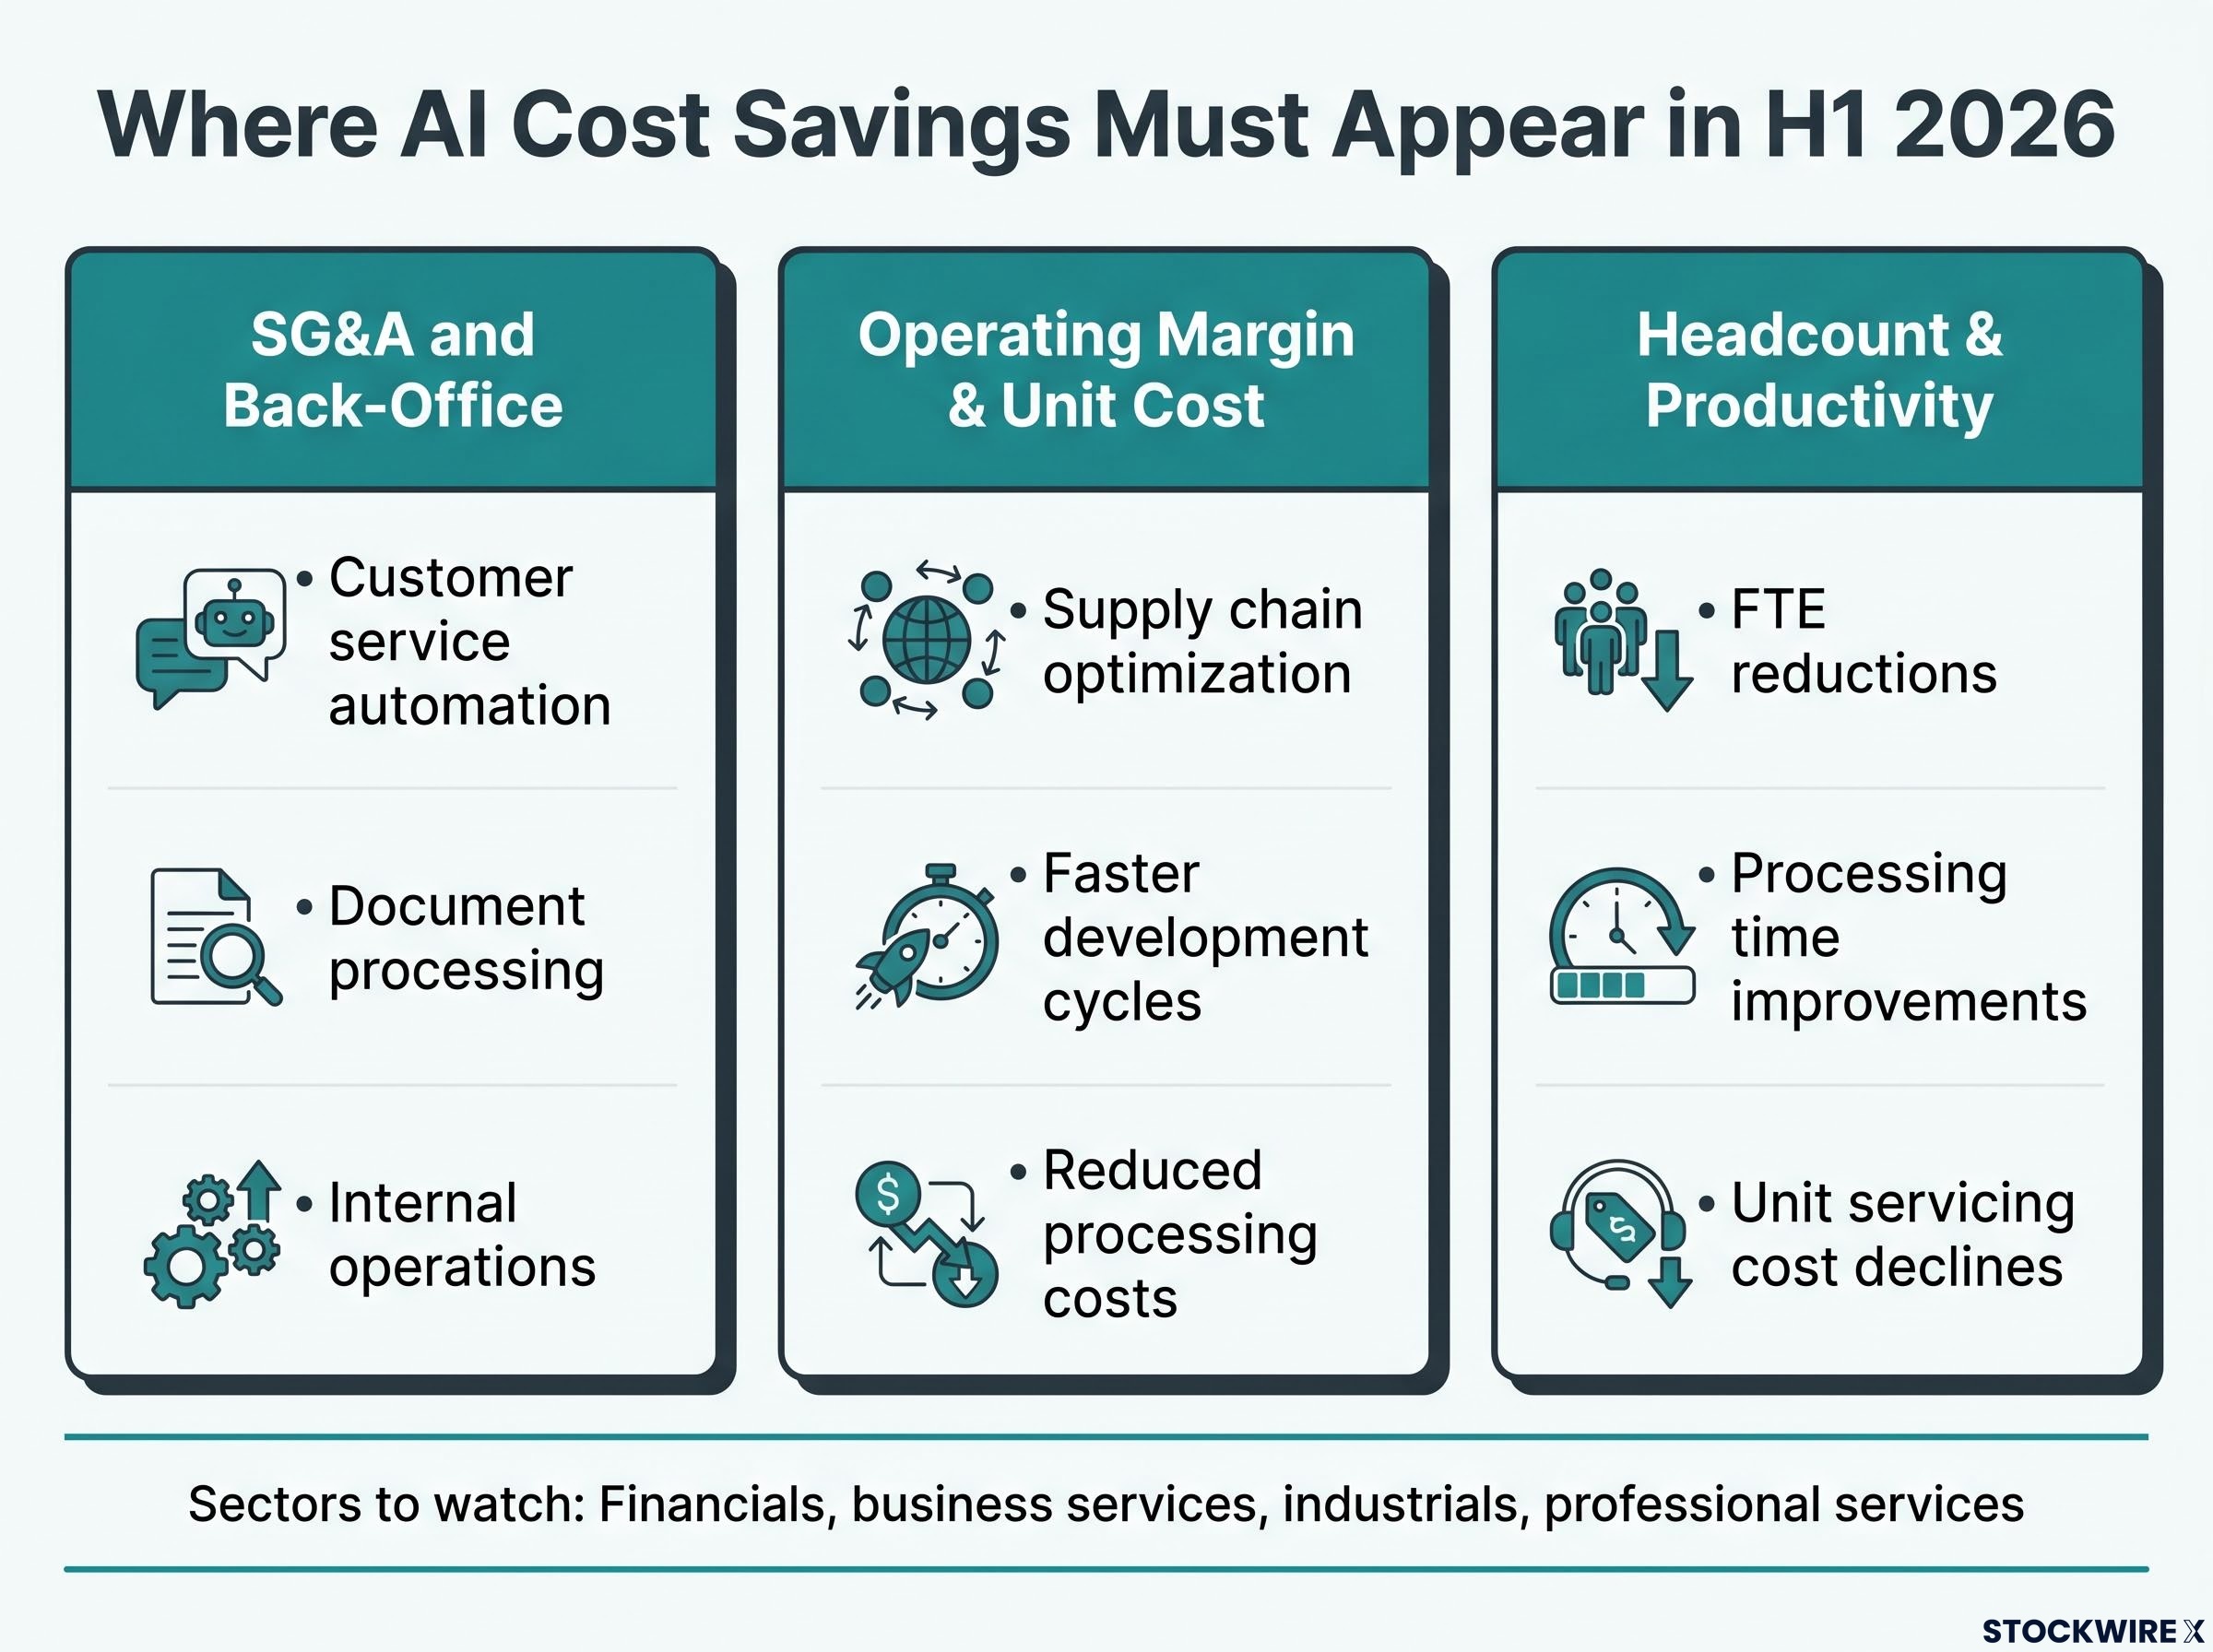
Goldman’s broader 2026 outlook frames AI-related capital spending by hyperscalers as trickling into broader sectors and supporting earnings growth. The credible metrics look like specific percentage reductions in the relevant cost base: FTE reductions tied to AI, processing time improvements expressed in measurable terms, unit cost declines with a clear causal link.
If a company names AI as a strategic priority but cannot point to a specific line-item improvement in H1 2026, that gap is a valuation risk. Firms still in the storytelling phase will likely underperform peers that can show the numbers.
Commodity producers have delivered strong earnings in H1 2026, with the sector up more than 50% year-on-year and accounting for the bulk of STOXX 600 headline growth. That is the upstream story. The downstream question is where the analytical value sits.
Goldman Sachs explicitly states it will “closely monitor the extent to which the energy shock will transmit down the value chain.” The mechanics are straightforward: upstream energy and commodity producers have benefited from strong Brent realisations and higher commodity prices. Those higher input costs now face the question of migration. Are they being absorbed at each stage, or are they being passed through to the next buyer in the chain?
The sectors most exposed to this transmission are the energy-intensive industrials: chemicals, metals, industrial machinery, and materials, where energy represents a significant input cost line. Each of these faces a margin decision that will show up clearly in H1 results.
The scale of upstream supply disruption feeding into those Brent realisations is itself a structural variable worth examining: Saudi output contracted to a 36-year low in April 2026 and global inventories were drawing at more than double the previous record pace, conditions that affect both the duration of commodity-sector tailwinds and the persistence of input cost pressure for energy-intensive European industrials.
For oil and gas specifically, higher profits are not expected to translate into materially higher shareholder returns. Goldman anticipates capex picking up from structurally low levels, which changes the free-cash-flow calculus for that sub-sector. Strong headline earnings in energy do not automatically mean stronger dividends or buybacks.
Three signals will distinguish companies managing the cost chain from those being squeezed by it:
That last point is a yellow flag. Vague commentary without numbers suggests management either does not know the extent of cost pressure or does not want to quantify it. Neither is reassuring.
For investors holding industrials or materials names, a company that guided cautiously on margins but shows limited actual downstream cost pressure is a potential positive surprise candidate. One with optimistic margin guidance that did not fully account for energy pass-through is a selloff risk when numbers land.
Chinese competition as a headwind for European exporters is not new information. The question for this earnings season is whether H1 2026 results make the scale of competitive damage visible in specific numbers rather than general commentary.
China’s manufacturing technology edge extends well beyond pricing strategy: with approximately 2 million industrial robots operating domestically and domestic robot manufacturers growing their share of installations from 30% to 57% between 2020 and 2024, Chinese firms competing in capital goods and clean energy equipment are compounding a physical AI advantage that price comparisons alone do not capture.
Goldman Sachs has flagged “earnings developments for European names exposed to competition from China” as its second primary watchpoint. The sectors where pressure is most acute share a common feature: Chinese firms now offer comparable quality at lower price points, compressing European margins and volumes simultaneously.
| Sector | Key Chinese competitive threat | Geographic market to watch | Primary earnings signal |
|---|---|---|---|
| Automotive/EV supply chains | Lower-cost EV platforms and battery components | Asia ex-EU, Middle East | Volume trends and order backlog changes |
| Industrial machinery | Price-competitive capital goods and equipment | Latin America, Africa | Gross margin trends and contract win rates |
| Clean energy equipment | Solar panels, batteries, components at scale pricing | Asia ex-EU, Middle East, Africa | Pricing trends and market share data |
| Consumer electronics | Comparable-quality durable goods at lower price points | Asia ex-EU, Latin America | Revenue mix shift and average selling price |
The geographic signal matters as much as the sector signal. Weakness in Asia ex-EU, Middle East, Latin America, and Africa is particularly telling because those are the regions where Chinese firms compete most aggressively on price. European companies showing stable orders and margins in those contested geographies are demonstrating genuine competitive durability.
The margin signal is equally revealing but requires closer reading. Price cuts to defend volume and mix shift toward higher-value products are both visible in gross margin trends, but each tells a different structural story. The first suggests a company under pressure and retreating; the second suggests strategic repositioning with margin protection.
A European industrial or clean-energy company that reports stable margins and growing orders in these contested geographies is demonstrating something that justifies a higher multiple. One that shows volume declines masked by price increases, or vague commentary about “market dynamics,” is likely under greater pressure than the headline numbers suggest.
Each of Goldman’s three watchpoints tests a different form of resilience, but the real analytical value emerges when you apply all three simultaneously.
A cyclical beat driven by EUR weakness and commodity tailwinds says nothing about any of these three dimensions. The investors who outperform this season will be those who use results and conference calls to score companies across all three, not just check whether EPS cleared the consensus bar.
| Resilience dimension | What to look for in results | Red flag signal |
|---|---|---|
| Operational (energy) | Stable or improving margins despite higher input costs; hedging disclosures with contract duration | Margin compression with vague cost commentary and no hedging detail |
| Strategic (China) | Defended or growing share in contested geographies; pricing power evidence | Volume declines in Asia ex-EU, Middle East, Latin America without explicit competitive response |
| Transformational (AI) | Quantified cost savings tied to specific line items; FTE, SG&A, or unit cost reductions attributed to AI | AI referenced as strategic priority without any measurable P&L impact |
A company that beats EPS consensus but shows margin compression in energy-exposed divisions, declining volumes in China-contested markets, and no quantifiable AI savings is structurally weaker than its headline number implies. The valuation multiple it holds today is at greater risk than peers scoring well across all three dimensions.
The compressed reporting window, with the final week of July as peak disclosure, raises the informational value of early conference calls. Investors who prioritise listening to management Q&A rather than waiting for sell-side summaries will have a meaningful timing advantage.
Goldman’s framing draws the line clearly. Beta beneficiaries will likely emphasise macro tailwinds in prepared remarks. Quality standouts will volunteer specific data on energy management, competitive dynamics, and AI savings without being prompted. The difference between the two often becomes visible in the Q&A portion, where analysts push beyond the prepared script.
The sectors where all three watchpoints intersect most intensely are where results carry the highest informational value: industrials, technology, financials, and clean energy companies with significant international exposure. These are the names where energy cost management, Chinese competitive positioning, and AI cost savings all matter simultaneously.
The valuation-risk asymmetry is direct. Within the names that have seen the most significant multiple expansion, Goldman specifically pointed to banks and technology as the standout Q2 re-rating beneficiaries on a price-to-earnings basis, and these sectors now carry the highest threshold for results and guidance that can sustain those moves. Scoring well on the three watchpoints is structurally important for these names rather than optional.
European re-rating mechanics are not uniform across the cap spectrum: Barclays strategists identified extreme hedge fund short positioning in European equities as a mechanical driver of Q2’s price-to-earnings expansion, with small caps carrying the highest-beta sensitivity to any reversal of AI-momentum crowding in US technology names.
Three positioning signals deserve attention as results arrive:
Goldman’s forecast for STOXX 600 full-year earnings growth in 2026 of around 10% provides the headline reference point, but how that growth is distributed across sectors and companies carries more analytical weight than the aggregate number. Companies that can demonstrate resilience across all three dimensions are the ones most likely to hold their multiples through any post-results volatility.
For investors already holding European equities through this season, these three watchpoints are not academic. They are a checklist for deciding whether to hold through potential post-results volatility or reduce exposure in positions where the company has not yet demonstrated operational, strategic, or transformational resilience.
This article is for informational purposes only and should not be considered financial advice. Investors should conduct their own research and consult with financial professionals before making investment decisions. Forward-looking statements, including earnings growth expectations and market projections, are subject to change based on market developments and company performance.
European earnings season is the concentrated reporting window when STOXX 600 companies disclose H1 financial results, with over 90% of index market cap reporting by end-August 2026. It matters because valuations have already priced in roughly 11% year-on-year earnings growth, meaning any miss or cautious guidance from re-rated sectors like banks and technology carries amplified downside risk.
Goldman Sachs is tracking three specific signals: whether AI investment is producing quantifiable cost savings on the income statement, how energy input cost pressure is transmitting down industrial supply chains, and whether European companies in sectors like automotive, clean energy, and industrial machinery are losing volume and margin to Chinese rivals in contested geographies.
Commodity producers delivered over 50% year-on-year earnings growth in H1 2026, which accounts for the bulk of the STOXX 600's headline 11% growth figure. Strip that sector out and the remaining index grows at around 6%, meaning the aggregate number significantly flatters the broader earnings picture.
Credible AI savings show up in three specific locations: lower SG&A and back-office costs from automation, improved operating margins or unit cost ratios tied to AI tools, and management commentary with quantified headcount reductions or processing time improvements explicitly attributed to AI. Companies that cite AI as a strategic priority without pointing to a specific line-item improvement carry a valuation risk that peers showing the numbers do not.
The sectors most exposed are automotive and EV supply chains, industrial machinery, clean energy equipment, and consumer electronics, where Chinese firms now offer comparable quality at lower price points. Weakness in orders or margins in Asia ex-EU, Middle East, Latin America, and Africa is the clearest geographic signal that competitive pressure is intensifying.