Delivery Hero Shareholders Reject Uber’s €33 Bid, Demand €40+
12 mins ago
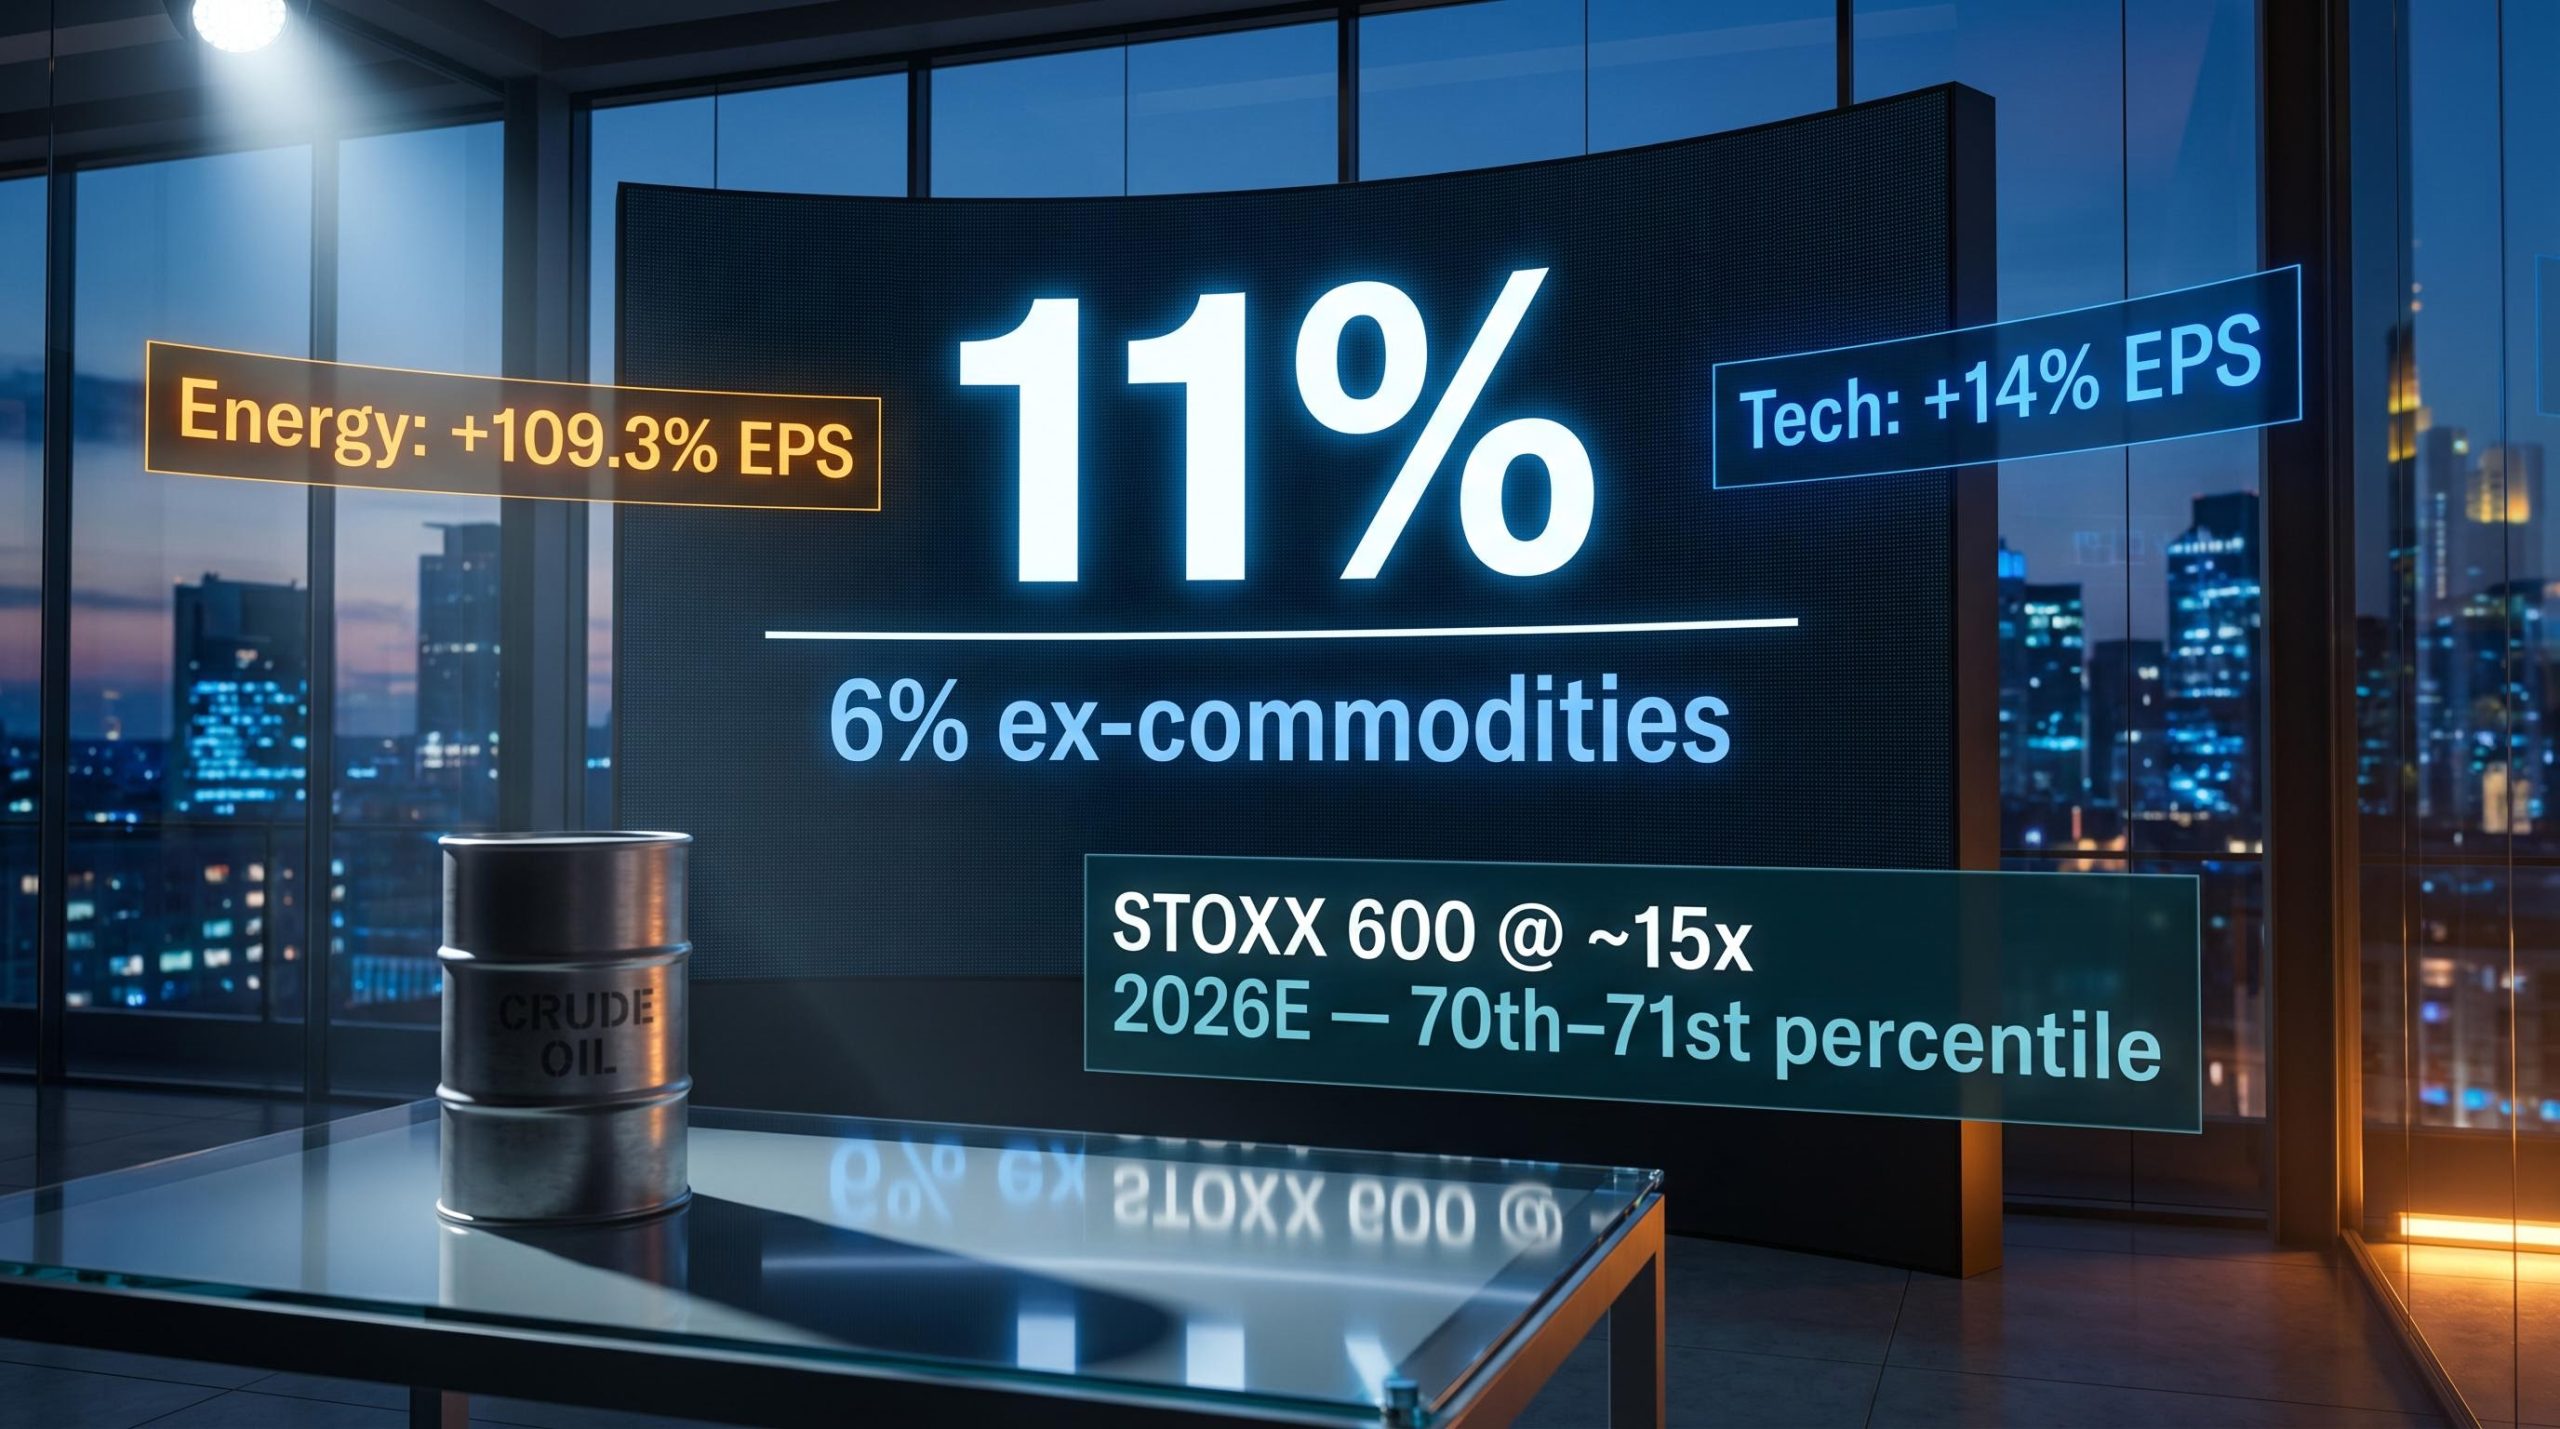
For the STOXX 600, consensus profit growth across the first half of 2026 sits at around 11%. Once commodities are removed from the calculation, that figure retreats to just 6%.
That distinction matters right now because European banks and technology stocks have re-rated through the first half of the year. Their prices already embed the optimistic earnings story. Whether that story holds depends on which growth figure you believe: the headline or the one underneath it.
Here is a clear-eyed map of where European profit growth is genuinely coming from, which sectors face the sharpest valuation-driven risk, and what the divergence means before the next round of results hits.
Start with the raw numbers.
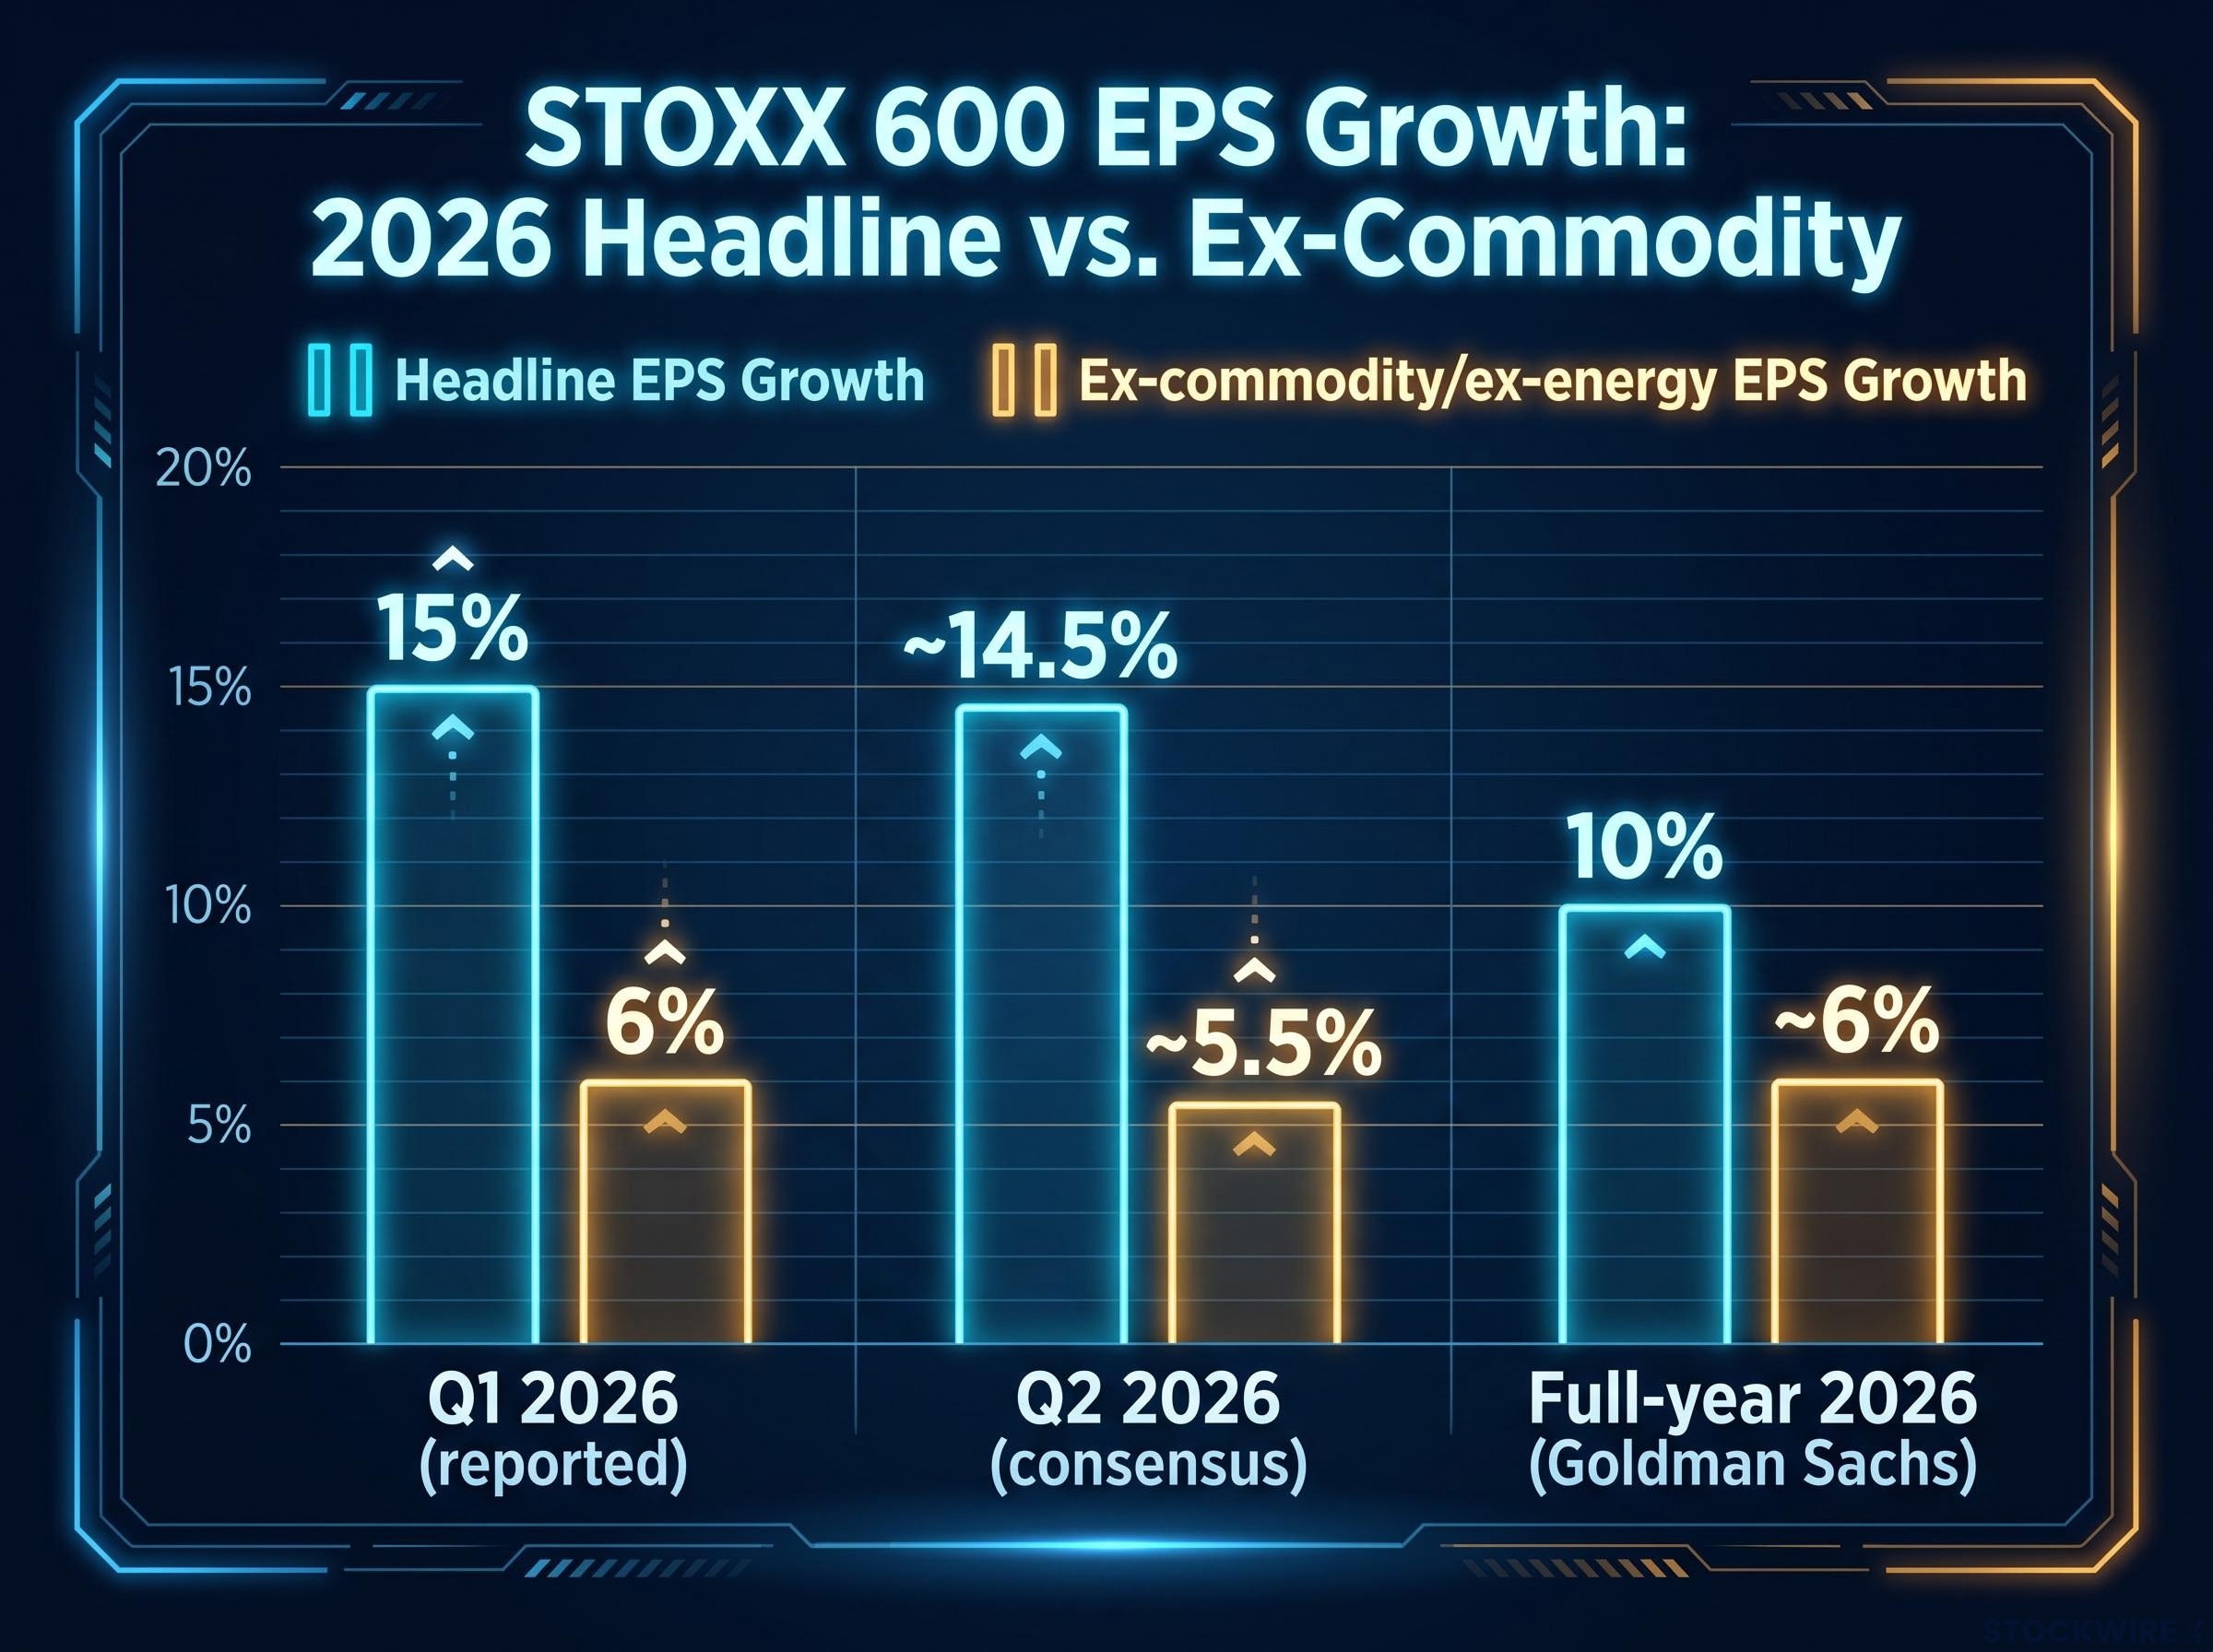
H1 2026 consensus data points to 11% year-on-year earnings growth across the STOXX 600, a figure that is heavily commodities-driven; strip that sector out and the growth rate settles at 6%. For Q2 2026 specifically, Reuters and LSEG I/B/E/S data show headline earnings growth of approximately 14.5%, while the ex-energy figure comes in at roughly 5.5%, with revenue growth of approximately 5.1% for non-energy companies.
Those are not one-off distortions. Q1 2026 reported results confirmed the same pattern: 15% headline EPS growth fell to 6% once outsized contributions, primarily from BP, were stripped out, according to Bank of America analysis. Goldman Sachs projects full-year 2026 STOXX 600 earnings growth at 10%, a figure that looks reasonable at the headline level but embeds the same commodity skew.
The non-commodity margin trajectory across the STOXX 600 tells a more sobering story: Goldman Sachs data from May 2026 showed non-commodity margins tracking approximately flat for the year, falling well short of the 100 basis points of improvement the broader consensus had forecast at the start of 2026.
| Period | Headline EPS growth | Ex-commodity/ex-energy EPS growth |
|---|---|---|
| Q1 2026 (reported) | 15% | 6% |
| Q2 2026 (consensus) | ~14.5% | ~5.5% |
| Full-year 2026 (Goldman Sachs) | 10% | ~6% |
For companies outside the commodities sector, aggregate earnings and margin expectations held broadly flat relative to where they stood at the beginning of Q2. The double-digit European earnings growth story you keep seeing in market commentary is largely a commodity story. Mid-single-digit growth is what the rest of the European corporate sector is actually producing.
The concentration becomes sharper at the sector level. Q2 2026 consensus EPS growth by sector, in descending order:
Energy’s growth rate is not in the same category as the others. It is nearly eight times the technology figure and more than double basic materials. Goldman Sachs projects that commodity producers in the STOXX 600 will achieve earnings growth in excess of 50% for the full year, a picture consistent with the Q1-Q2 data showing 50-109% year-on-year growth ranges. In Q1 alone, energy EPS growth was projected near 50%, driven by elevated prices and trading gains during the Iran conflict, according to Reuters.
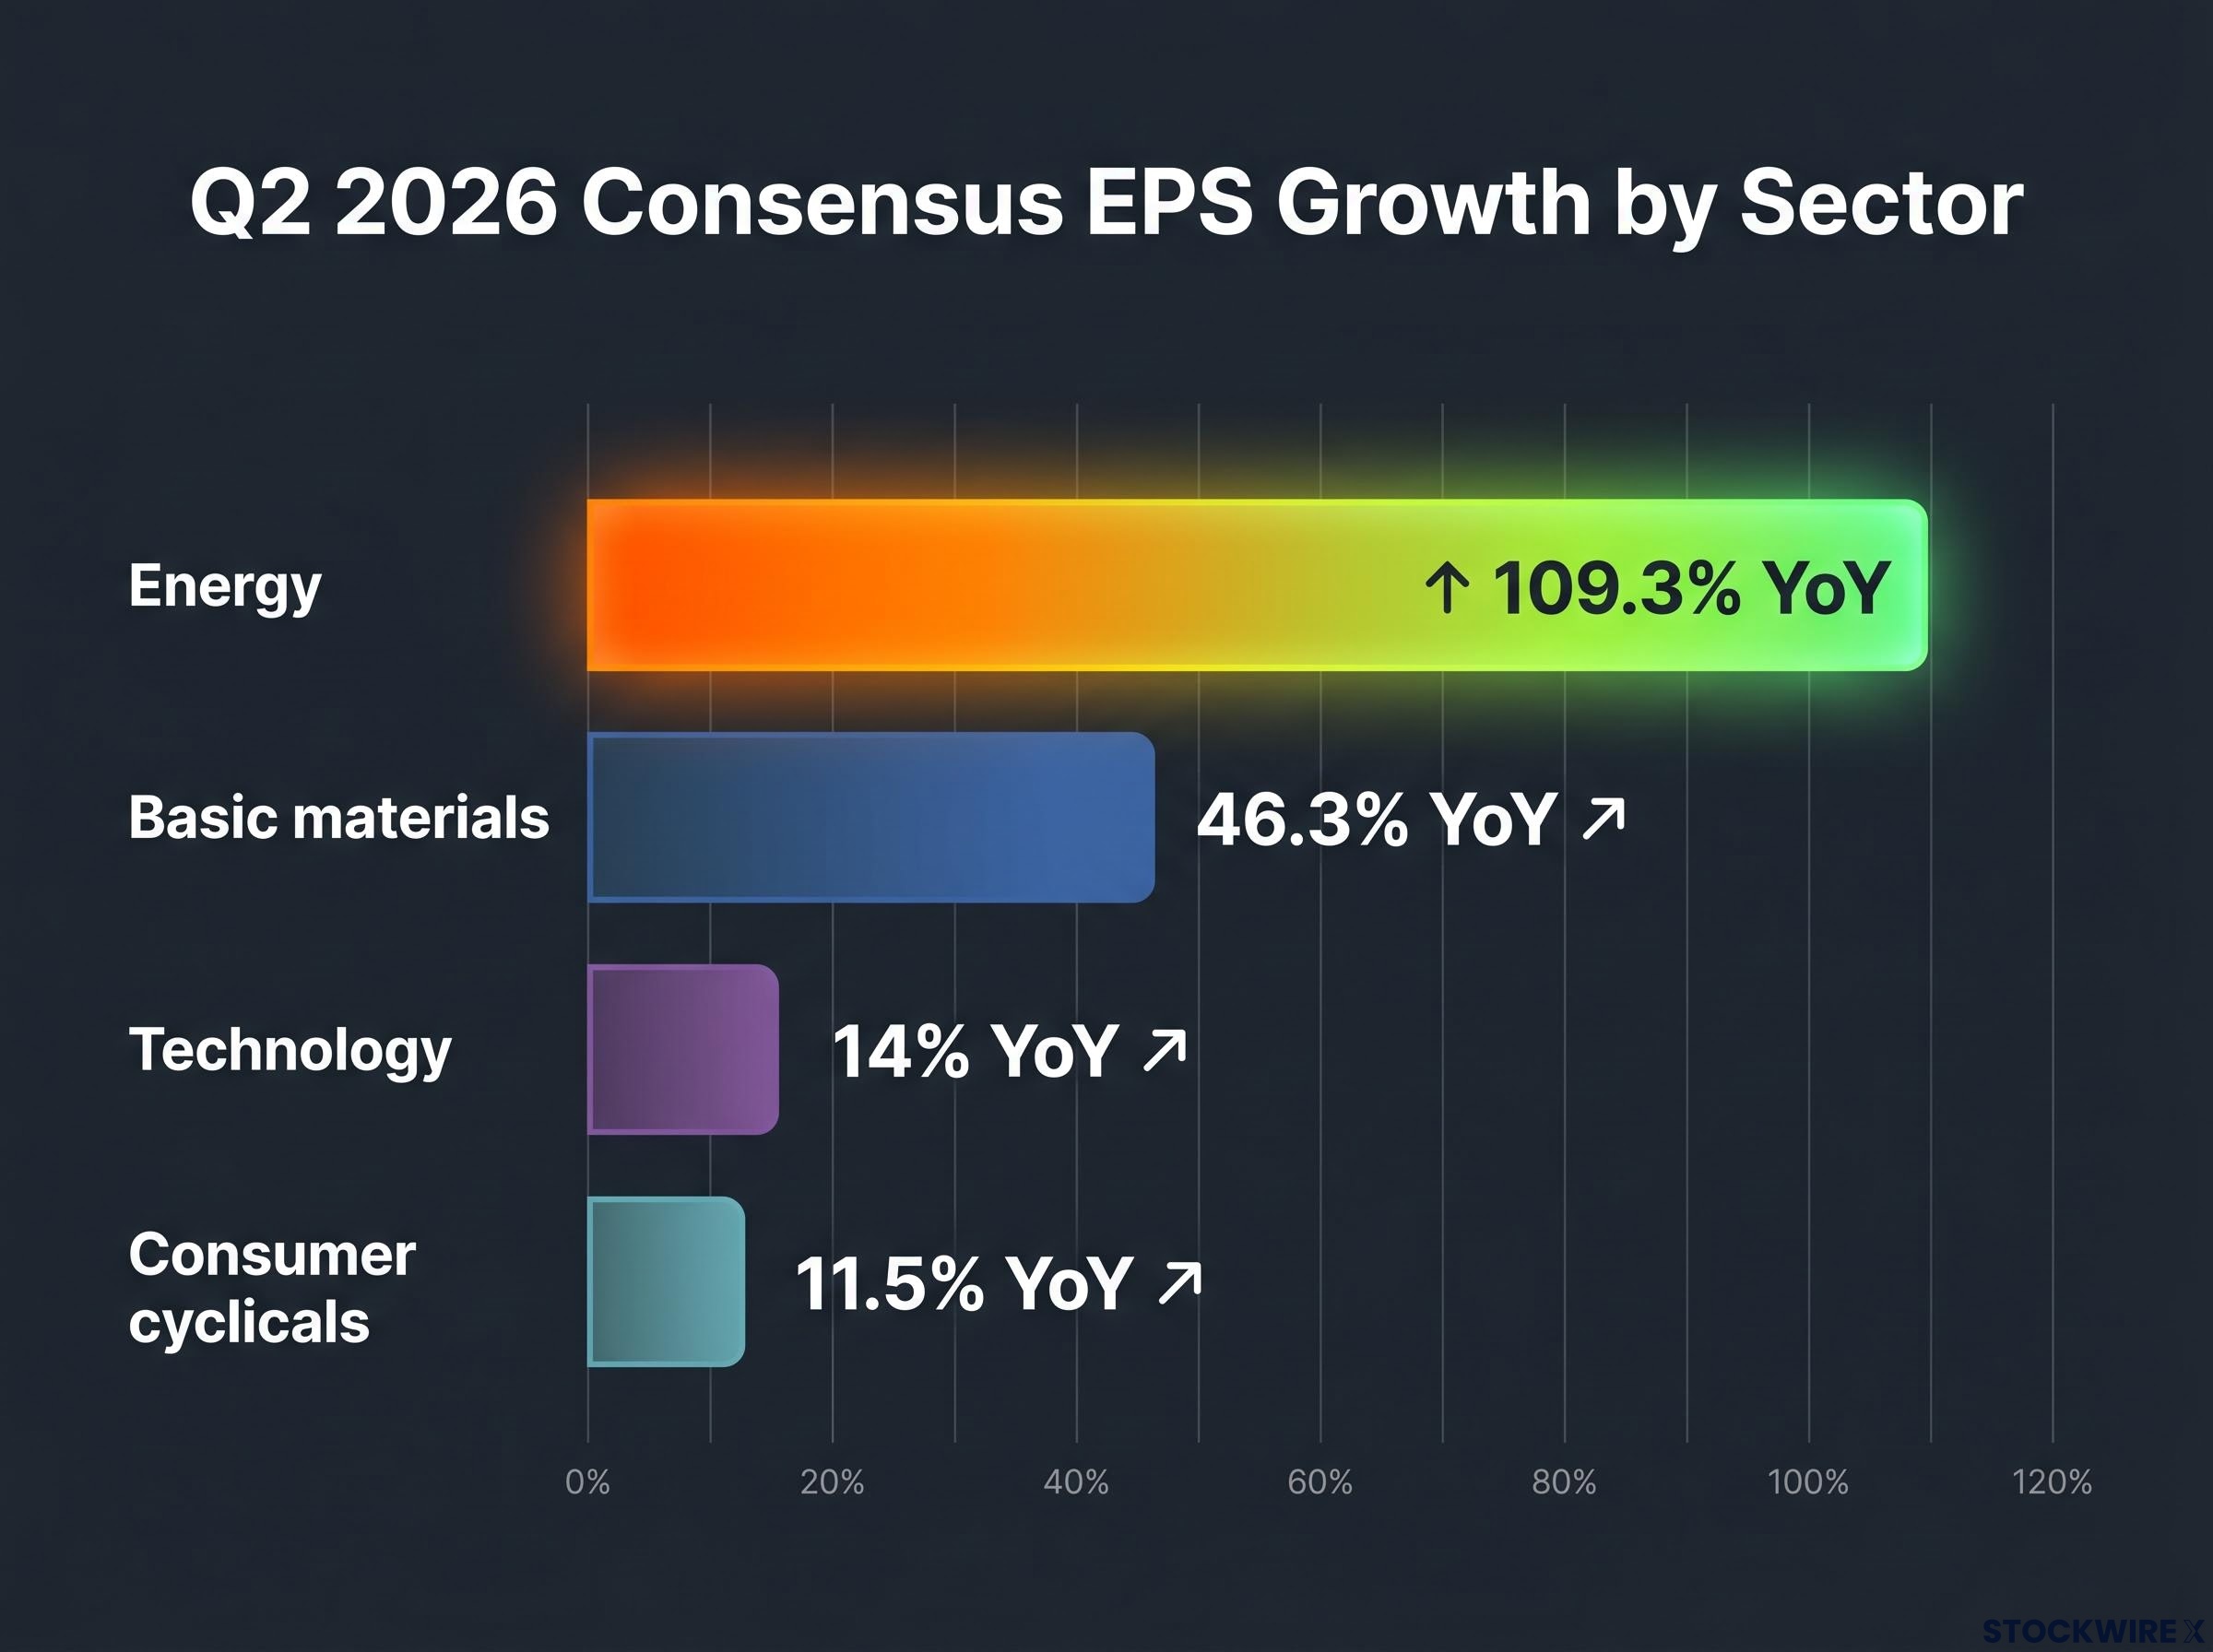
Technology’s 14% looks impressive in isolation. But it sits at roughly one-eighth of energy’s rate, which means treating both sectors as equal contributors to European earnings strength is working from a flawed mental model.
Earnings concentration in US markets follows the same structural pattern: S&P 500 Q2 2026 aggregate growth projections surged from 13.9% to 21.4%, but virtually all of that revision came from Information Technology (revised to 57.7%) and Energy (revised to 116%), with Health Care swinging from an expected 7% growth rate to a projected decline, confirming that the headline-versus-underlying divergence is not a European-specific phenomenon.
Bank of America identified tech, telecoms, and energy as standout positive contributors to Q1 EPS growth, with healthcare acting as a drag. The picture is not uniformly positive even at the sector level.
Outside energy, the broader STOXX 600 is delivering a solid but unspectacular 5-6% growth environment. Ex-energy revenue growth of approximately 5.1% in Q2 tells a consistent story: the corporate sector is expanding, but not at a rate that independently justifies further multiple expansion given the already elevated index price-to-earnings ratio (the price investors pay per dollar of company earnings, a measure of how expensive a stock or index is relative to its profits).
Bank of America projected 9% downside in forward STOXX 600 EPS by mid-2026 against a backdrop of what it described as unimpressive global growth. That downside flag applies most directly to this mid-single-digit segment, where expectations are already modest and the margin for error is thin.
Goldman Sachs Research puts the STOXX 600 at roughly 15x 2026 earnings, in approximately the 70th to 71st percentile of the past 25 years.
The STOXX 600 trades at approximately 15x 2026 earnings, placing it in the 70th to 71st percentile of its 25-year valuation history, according to Goldman Sachs Research.
That is not cheap. It is expensive relative to Europe’s own history, even if it remains cheaper than several other asset classes globally. The question is whether that elevated multiple is justified by what companies actually report.
Among the standout Q2 2026 performers, banks and technology led the way, with their gains driven not by material earnings upgrades but by P/E expansion, as investors bid up prices by raising the multiple they were prepared to pay for each pound of earnings. Goldman Sachs highlights banks, financial services, and technology as cyclical beneficiaries of better economic growth and falling rates, which explains the enthusiasm. But enthusiasm that arrives through multiple expansion rather than earnings delivery creates a specific kind of risk.
Robeco research on decomposing equity returns into earnings growth and multiple expansion components finds that valuation multiples are prone to mean-reversion over medium-term horizons, a dynamic that amplifies downside risk precisely when sectors have re-rated ahead of earnings delivery.
The asymmetry works like this: when a sector is trading at an elevated multiple, a miss does not produce a proportionate pullback. It produces an outsized one, because the market must simultaneously discount the missed number and revise down its willingness to pay the premium multiple. Technology’s Q2 2026 EPS growth of 14% is strong, but if the market has priced in something closer to 18-20% through multiple expansion, 14% becomes a disappointment rather than a win.
It is worth noting that sector-specific P/E multiples for European banks and technology are analytical inferences from the overall index P/E, sector leadership data, and sell-side commentary, not independently sourced figures. But the directional conclusion holds: if you hold positions in European banks or technology, your entry point may already reflect a best-case earnings scenario, which means your downside on a miss is materially larger than for a sector trading at a discount.
The conflict’s earnings impact moved in two directions simultaneously:
Energy EPS growth in Q1 was projected near 50%, driven by price spikes and trading gains during the conflict period, according to Reuters. The conflict did not lift European equities uniformly. It supercharged one segment while simultaneously compressing another.
The more consequential issue is what the consensus is assuming. According to Goldman Sachs, current market pricing reflects a view that the Iran conflict’s disruption will be relatively short-lived in its effects. Current forward estimates project modest overall STOXX 600 EPS growth despite ongoing geopolitical shocks, consistent with a market pricing in a contained and transient impact.
Geopolitical risk pricing operates through probability-adjusted earnings inputs rather than proportional headline shocks, which is why markets can absorb an ongoing Strait of Hormuz disruption while simultaneously pricing in a relatively contained forward earnings impact: the mechanism is not complacency but a systematic discounting of scenarios that historical supply adaptive capacity, including Saudi spare capacity and LNG spot markets, has repeatedly absorbed.
That brevity assumption is not a forecast. It is a bet that has not yet paid out. Amundi strategists warned that a prolonged conflict would hinder European growth and corporate earnings, especially for firms less able to pass through costs than during the earlier Ukraine-related inflation shock. If the conflict extends, the resource earnings uplift is already priced in while the cyclical drag is still unfolding. Readers treating current energy sector earnings strength as a durable baseline should reconsider that assumption.
Energy EPS growth of 109.3% in Q2 2026 is exceptional by any historical comparison. According to Goldman Sachs, commodity producers across the index are on course to grow earnings by more than 50% for the full year, supported by robust Brent crude price realisations across the period.
The scale of the profit windfall is not in question. The investment question has shifted to where it goes.
In contrast to the 2022 commodity boom, Goldman Sachs takes the view that this cycle’s profit gains are unlikely to flow through to shareholders in the form of meaningfully higher dividends or buybacks, as reinvestment spending is set to pick up from levels the firm characterised as structurally depressed.
This is Goldman Sachs‘ analytical view, and concrete 2026 guidance remains company-specific rather than confirmed at index level. But the framing is directionally significant: if you hold European energy positions on the expectation of a repeat of 2022-style dividend and buyback expansion, the profit is there but the allocation path appears different this cycle.
Goldman Sachs identifies capital spending plans as the focal point for energy investors in 2026. That makes company-level guidance the key variable to watch, not index-level earnings forecasts. The energy transition spending dimension adds further complexity, as investors will need to assess whether reinvestment is value-creating or value-dilutive on a name-by-name basis.
The evidence supports a three-bucket framework for approaching European equities through the remainder of the results season:
| Bucket | Key sectors | EPS growth context | Primary risk or focus |
|---|---|---|---|
| Growth validators | Banks, technology | 14% tech EPS growth Q2; elevated P/E from re-rating | Asymmetric downside on misses; multiples already embed optimism |
| Commodity beneficiaries | Energy, basic materials | 50-109% EPS growth; ~30% resource upgrade since conflict | Capital allocation, not earnings magnitude; brevity assumption on conflict |
| Ex-commodity compounders | Broader STOXX 600 ex-energy | 5-6% EPS growth; ~5.1% revenue growth | Muted consensus reduces downside surprise risk but limits upside potential |
Each bucket carries a distinct question. For growth validators, the question is whether the sectors that already re-rated can deliver on the growth assumptions embedded in their multiples. For commodity beneficiaries, it is what management does with the cash. For ex-commodity compounders, it is whether mid-single-digit growth is enough to sustain current prices without further multiple expansion.
Goldman Sachs characterises European equity returns in 2026 as a modest rise, with a total return forecast of approximately 8%. The three-bucket structure does not resolve the headline-versus-underlying divergence. It gives you a way to navigate it rationally, asking the right questions about positions you already hold rather than reaching for a blanket bullish or bearish call.
The core asymmetry has not changed. Headline European earnings growth looks strong at 10-15%. Underlying ex-commodity growth is 5-6%. The gap is being priced as if it is a broad market phenomenon rather than a commodity-driven one.
Goldman Sachs forecasts approximately 8% total return for European equities in 2026, framing the outlook as a modest rise rather than a continuation of re-rating.
Bank of America‘s 9% downside EPS risk flag sits on the other side of that estimate. The STOXX 600’s P/E at roughly the 70th to 71st percentile of its 25-year range makes the next earnings print unusually consequential, because there is limited valuation cushion to absorb a miss.
When Q2 2026 results arrive in earnest, the market will have to decide whether the elevated P/E in banks and technology is justified by what those companies actually report. The question worth holding is specific: can the sectors that have already re-rated now deliver on the growth assumptions embedded in their multiples, or has the market paid in advance for earnings that may arrive at the mid-single-digit rate the rest of Europe is producing?
Investors exploring what could change the re-rating calculus in the second half of 2026 will find our full explainer on institutional positioning in European equities, which covers the Barclays July 2026 upgrade, the BofA Global Fund Manager Survey underweight data, and the Germany fiscal expansion thesis that forms the structural bull case beyond the current earnings cycle.
This article is for informational purposes only and should not be considered financial advice. Investors should conduct their own research and consult with financial professionals before making investment decisions. Past performance does not guarantee future results. Financial projections are subject to market conditions and various risk factors.
Headline STOXX 600 earnings growth for 2026 sits at around 10-11%, but that figure is heavily distorted by energy and basic materials. Strip out commodities and the underlying growth rate falls to approximately 5-6%, which is what the majority of the European corporate sector is actually delivering.
The double-digit headline growth rate is largely a commodity story: energy sector EPS is growing at over 100% year-on-year in Q2 2026, driven by elevated oil prices and trading gains linked to the Iran conflict, while the rest of the STOXX 600 is growing at a much more modest 5-6%.
European banks and technology stocks face the sharpest downside risk because their recent gains came through P/E multiple expansion rather than earnings upgrades, meaning a miss would force the market to simultaneously discount the earnings shortfall and revise down the premium multiple investors were prepared to pay.
Goldman Sachs forecasts approximately 8% total return for European equities in 2026, characterising the outlook as a modest rise rather than a continuation of the re-rating that has already pushed the STOXX 600 to the 70th-71st percentile of its 25-year valuation history.
Goldman Sachs takes the view that unlike the 2022 commodity boom, this cycle's windfall is unlikely to flow to shareholders through meaningfully higher dividends or buybacks, with reinvestment spending expected to pick up from structurally depressed levels, making company-level capital expenditure guidance the key variable to watch.