Why JEPI’s Headline Yield Costs More in Tax Than You Think
4 mins ago

JEPI pays roughly 8% annually in monthly distributions, ranks among the largest covered call ETFs by assets under management, and has attracted billions from income-seeking investors over its approximately six years of operation. Yet a significant number of those investors are using it in exactly the wrong way for their situation.
Covered call ETFs have surged in popularity, and JEPI sits at the centre of that trend. The confusion tends to follow a pattern: investors treat it as either a high-yield S&P 500 replacement or a long-term compounding vehicle. It is structurally neither. That mismatch costs real money, in the form of capped growth over time and, for taxable account holders, an unwelcome tax surprise when distributions land.
Here is a clear picture of how JEPI actually generates its income, how it behaves across different market conditions, and whether the fund is built for your situation or working against it. The goal is a grounded decision, not a verdict.
Most investors arrive at JEPI with a simple mental model: it is the S&P 500 with a covered call overlay on top. That model is wrong on almost every count.
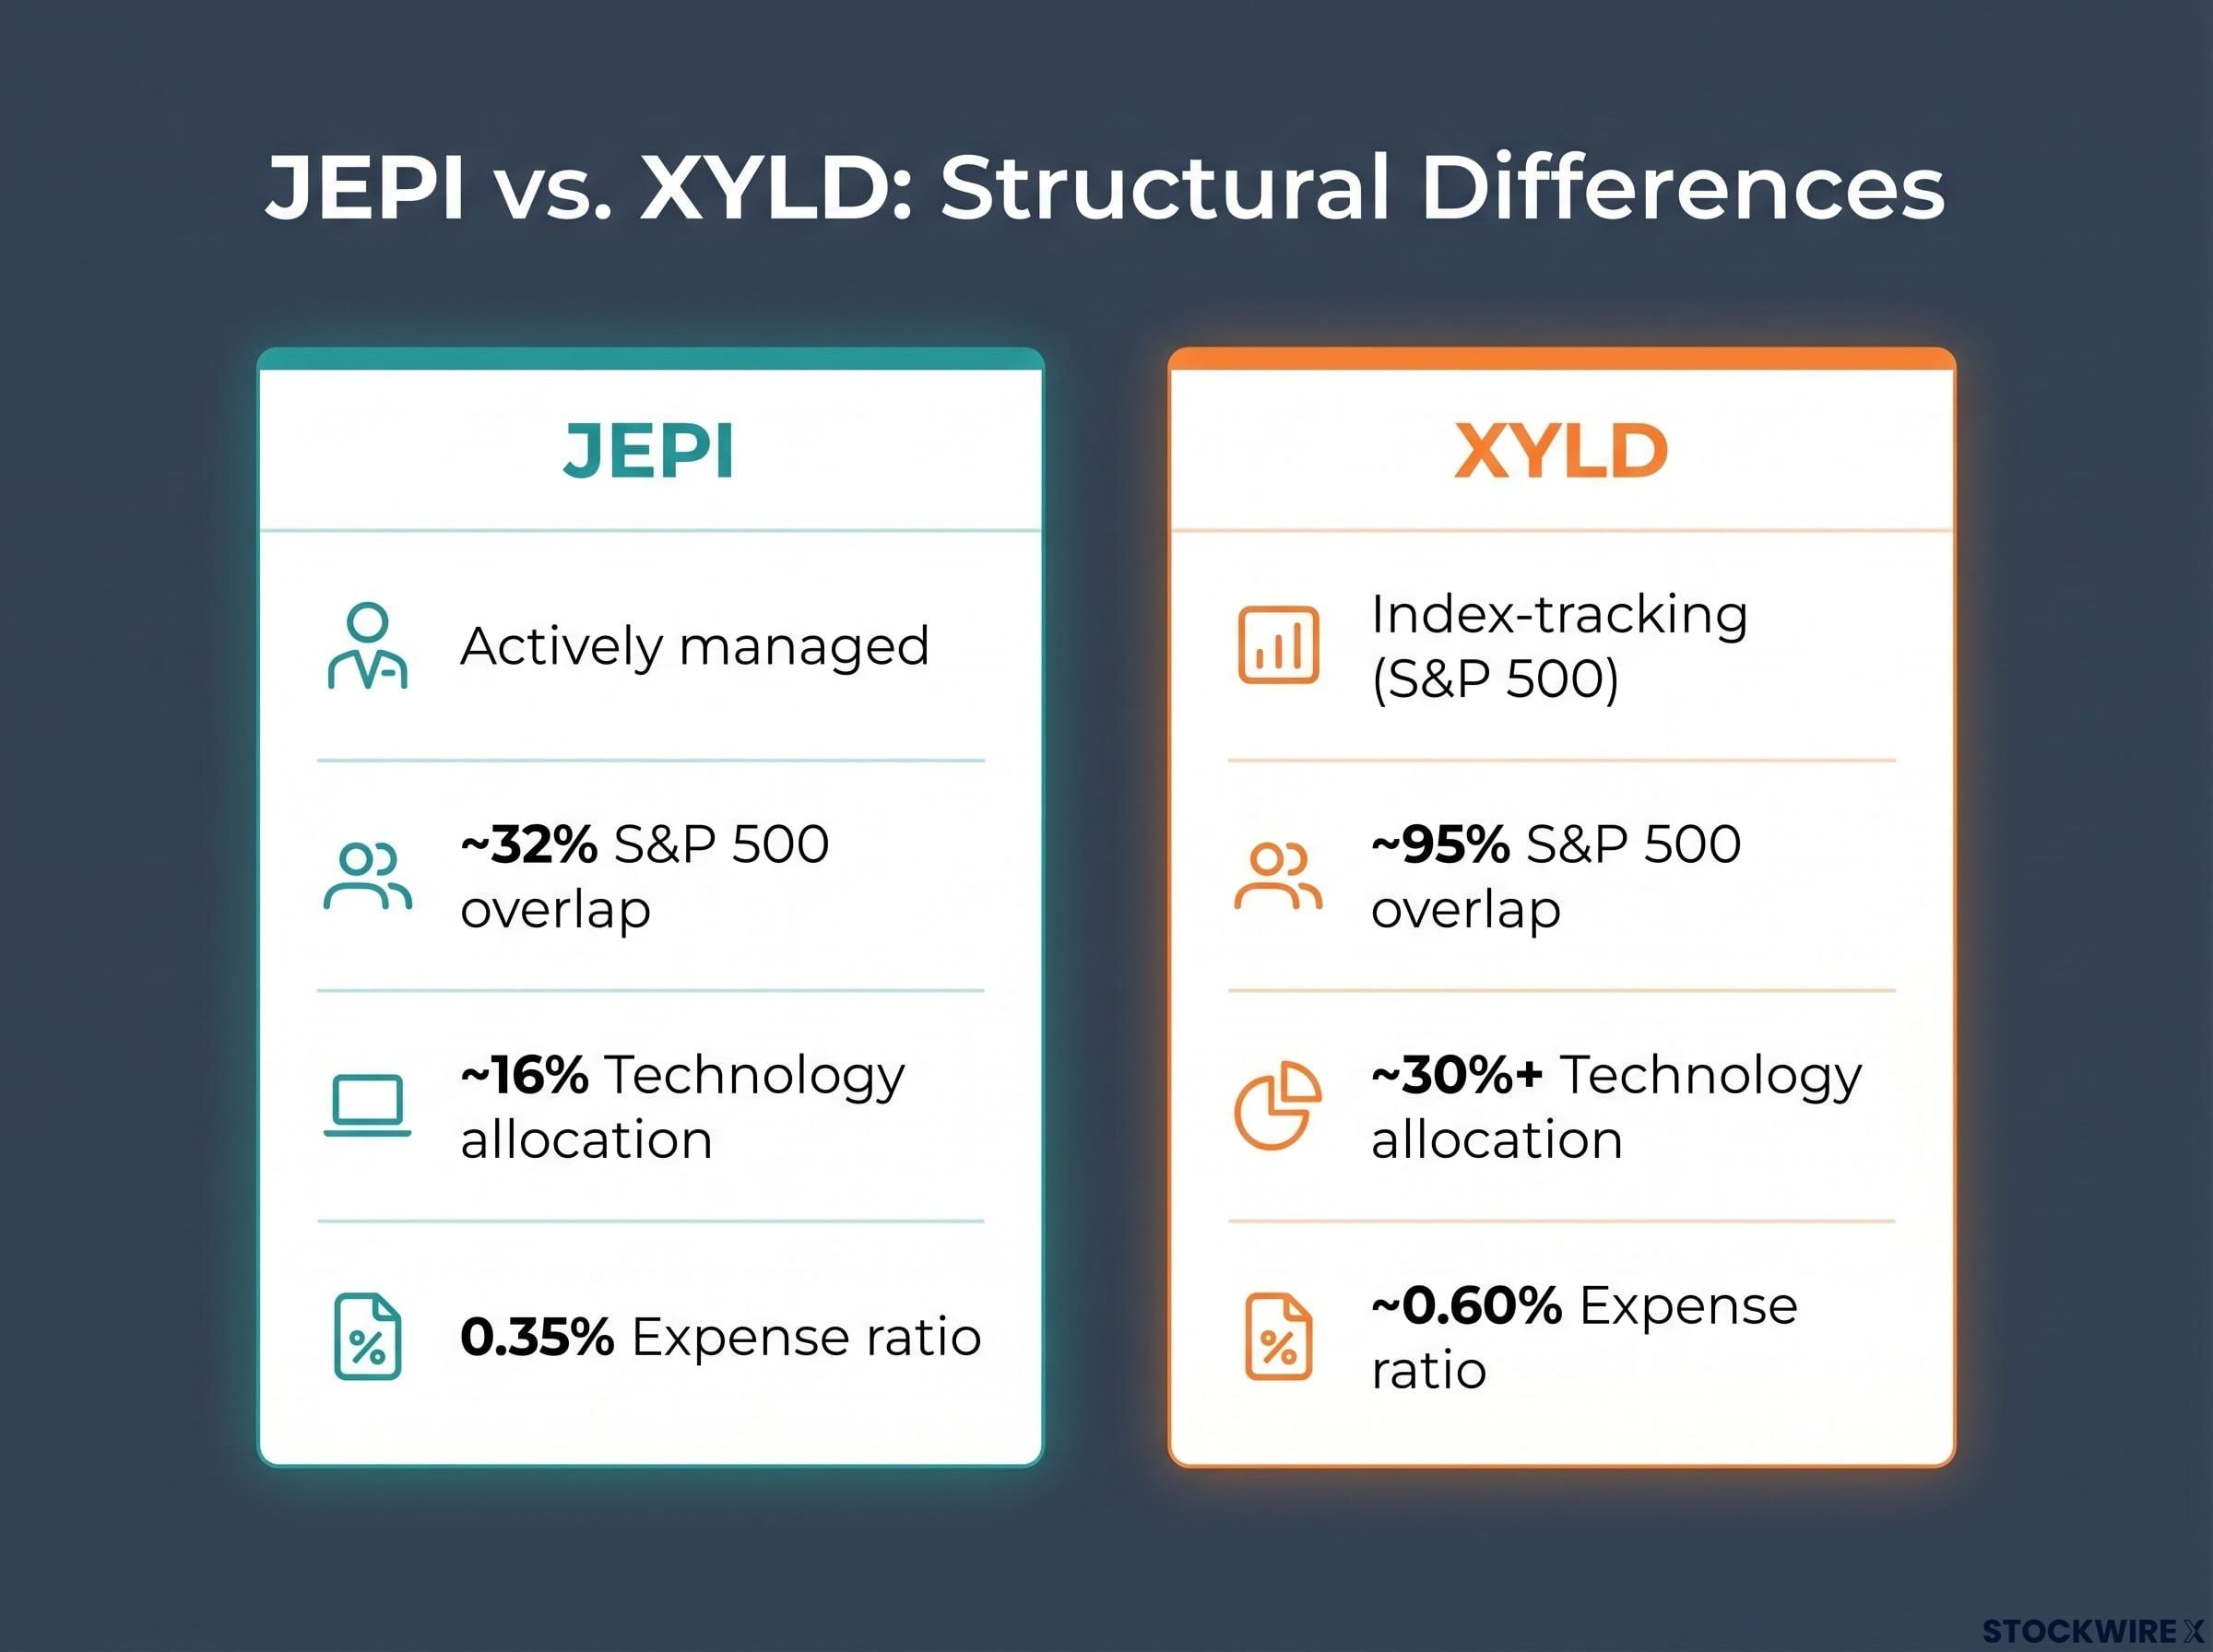
JEPI is an actively managed ETF run by Hamilton Reiner and his team at JPMorgan. The underlying equity portfolio is not indexed. It is constructed with deliberate sector tilts, most notably a technology weighting of approximately 16%, which sits well below the 30%+ allocation found in a typical S&P 500 fund. The fund has been operational for roughly six years and carries an expense ratio of 0.35%, a figure that sits at around half the cost of many competing covered call products.
The overlap number is what matters most. Only approximately 32% of JEPI’s holdings overlap with the S&P 500 by weight. That means roughly two-thirds of the portfolio is positioned differently from the index most investors instinctively compare it to. When the Magnificent Seven or any other narrow tech cohort drives a large S&P 500 rally, JEPI’s portfolio is structurally positioned to miss a significant portion of that move. That is a design choice, not a flaw.
The benchmark most investors use to judge JEPI is the wrong benchmark by design.
S&P 500 concentration risk adds a layer of context to how JEPI’s tech underweight should be read: with five mega-cap stocks controlling approximately 23% of the broad index as of mid-2026, the standard benchmark that JEPI is routinely compared against is itself a concentrated bet on a narrow cohort of companies.
The distinction sharpens when you compare JEPI to XYLD, a more direct S&P 500 covered call ETF. XYLD tracks the index with approximately 95% holdings overlap; JEPI operates as its own independently constructed portfolio with an options overlay applied to it. Same income mechanism, fundamentally different underlying holdings.
| Feature | JEPI | XYLD |
|---|---|---|
| Portfolio construction | Actively managed | Index-tracking (S&P 500) |
| S&P 500 holdings overlap | ~32% | ~95% |
| Technology allocation | ~16% | ~30%+ |
| Expense ratio | 0.35% | ~0.60% |
JEPI also has low to minimal holdings overlap with SPHD, another popular high-dividend, low-volatility ETF. The fund is purpose-built around its own construction logic, with no meaningful structural relationship to any standard index.
When a JEPI distribution hits your account each month, the money comes from two distinct sources, and the split between them determines both the amount you receive and how it gets taxed.
IRS Publication 550 on investment income classifies options premium received by investors as short-term capital gain or ordinary income depending on the structure, which is why the ELN-derived portion of JEPI distributions lands on your tax return as ordinary income rather than at the lower qualified dividend rate.
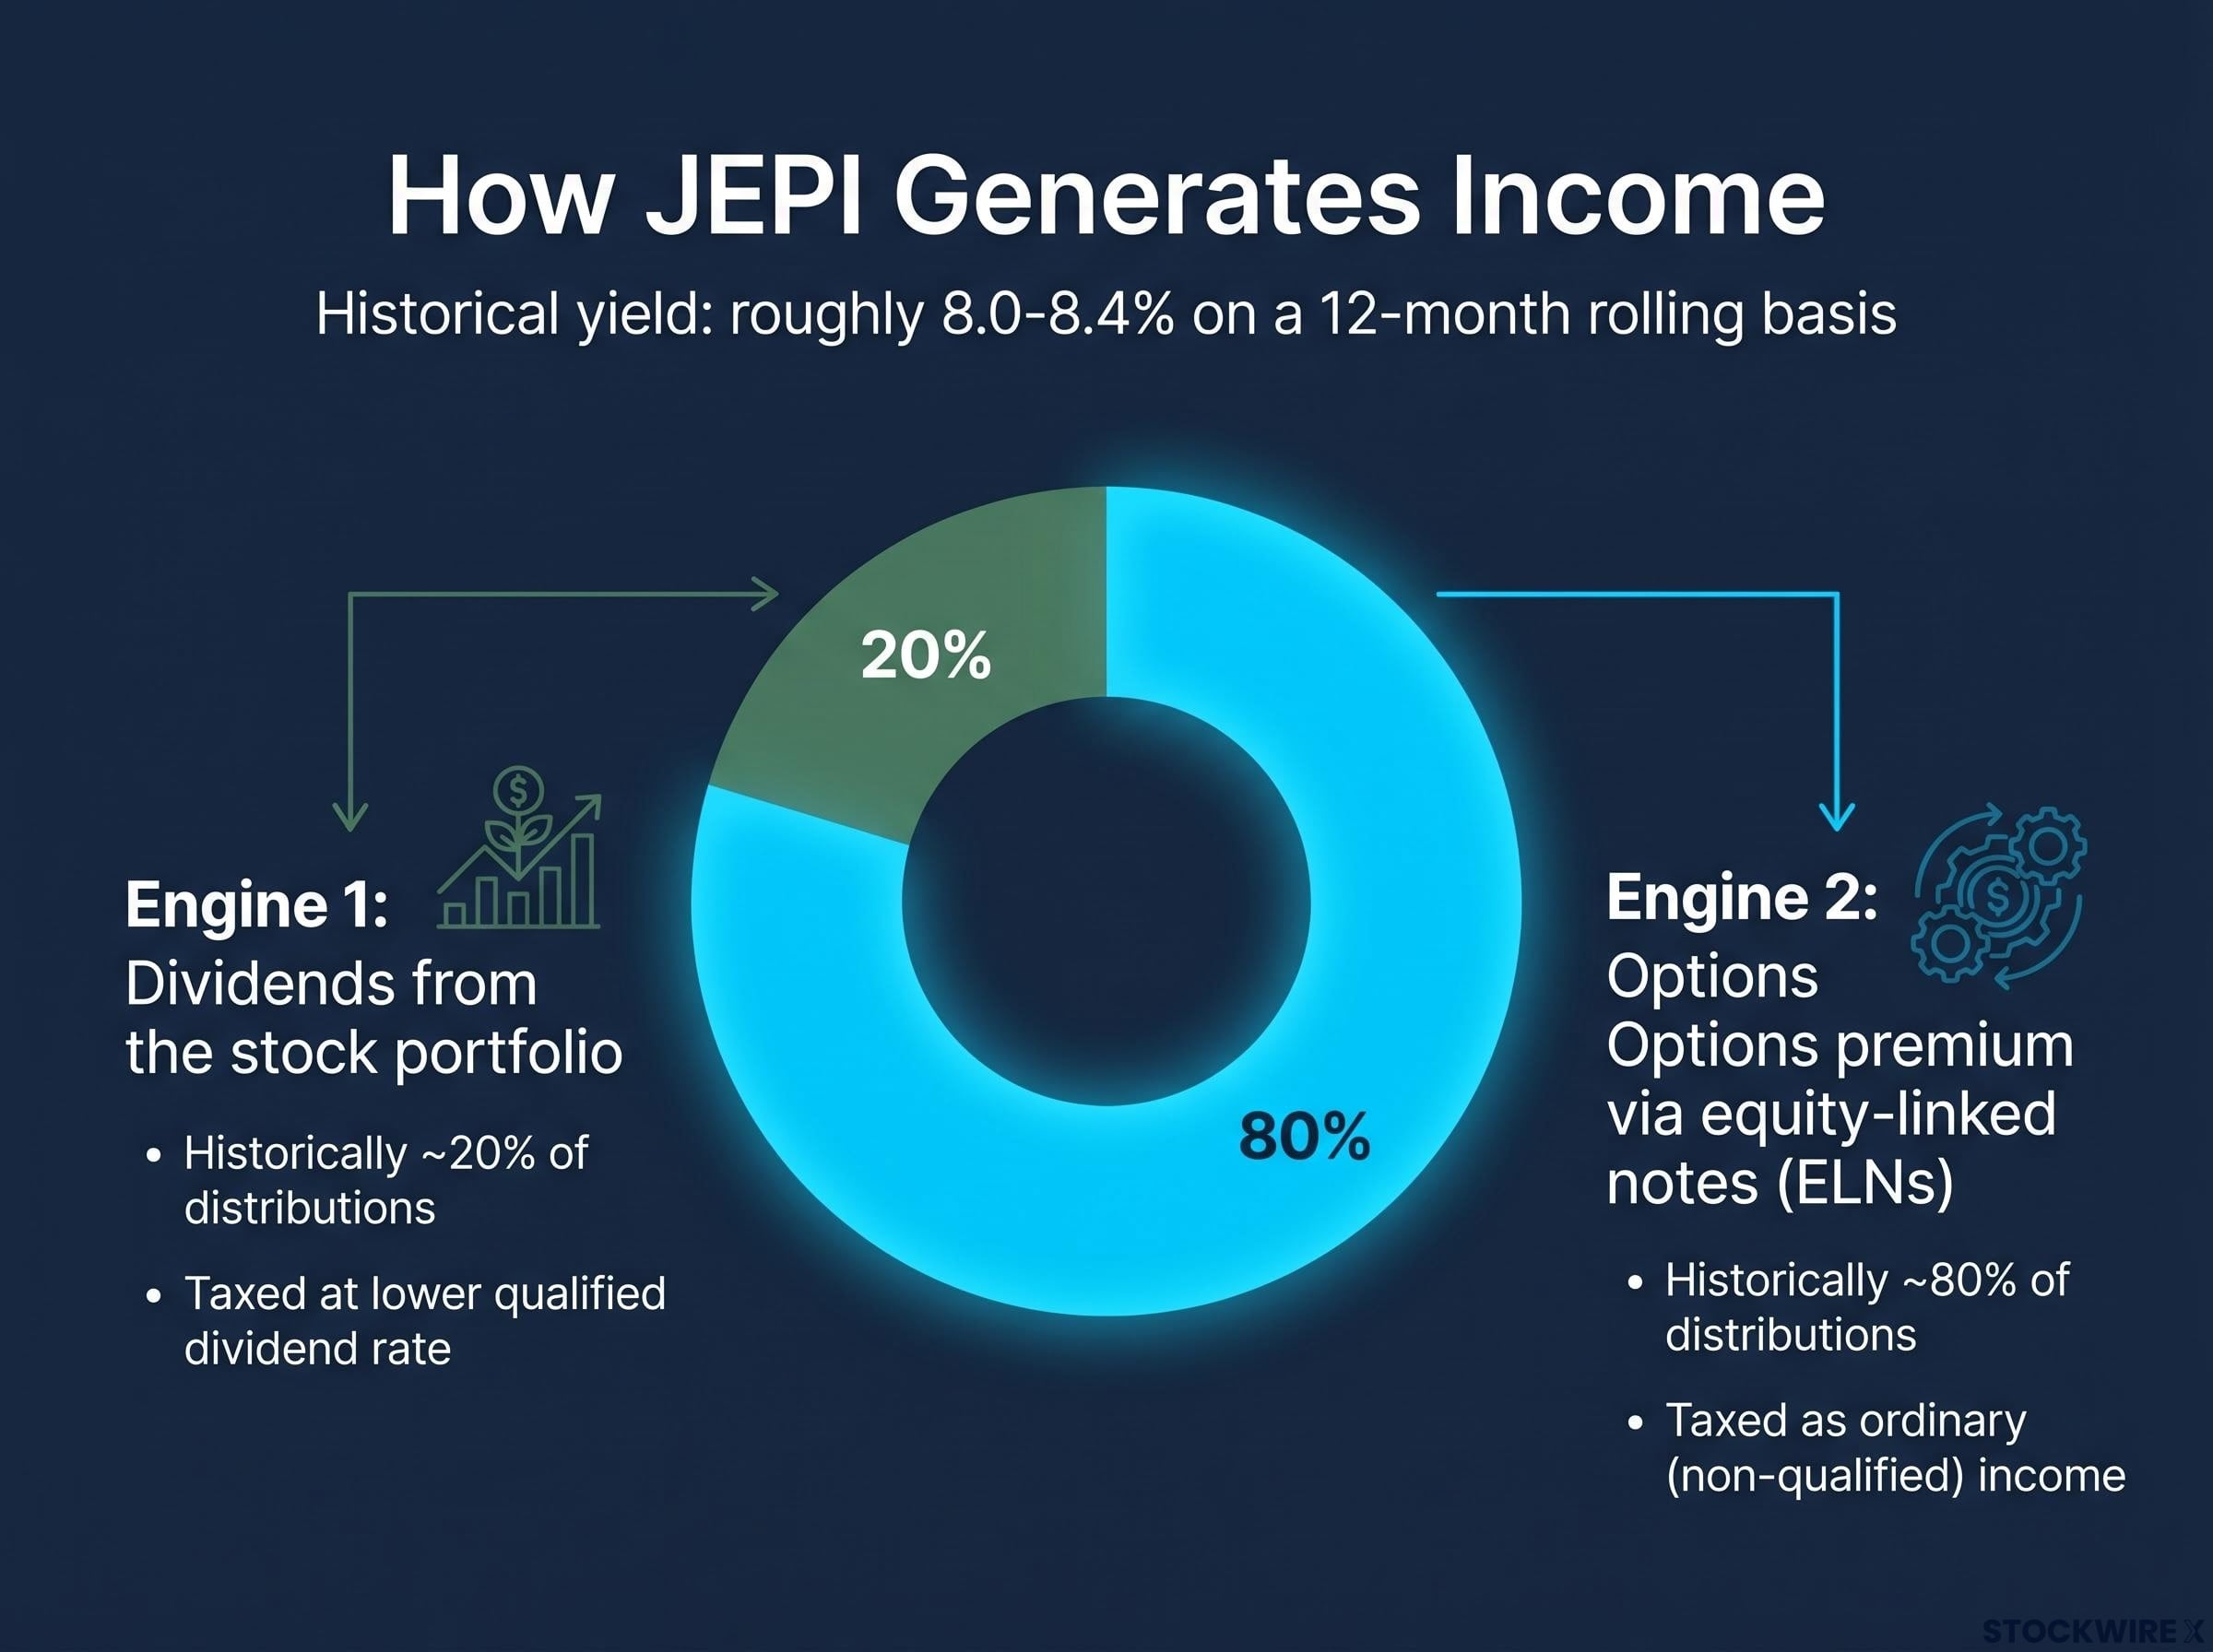
That 80/20 split matters directly to your tax bill. If you hold JEPI in a taxable brokerage account, roughly four-fifths of your distributions will be taxed at your ordinary income rate rather than the lower qualified dividend rate. For anyone in a higher bracket, that gap can substantially reduce real after-tax yield.
The combined result has historically produced a roughly 8.0-8.4% distribution yield on a 12-month rolling basis, with a 30-day SEC yield near 8.3-8.5%. But this is a range, not a fixed rate. Option premiums rise when market volatility is elevated and shrink when markets are calm and trending upward, which is why the monthly amount fluctuates.
Hamilton Reiner has informally benchmarked JEPI’s return profile to high-yield bonds, with the fund’s targeted 7-8% annual total return comparing to typical corporate and longer-duration bond returns in the roughly 4-5% range. The comparison resets expectations: JEPI is designed to deliver bond-like income with some equity participation, not equity-like growth with income on top.
Understanding which engine generates how much income explains why your distributions change month to month, and why the number on a yield screener is not the number you should expect to receive every month without variation.
JEPI’s design creates a clear pattern of tradeoffs that shifts with market conditions. Once you understand the pattern, you can anticipate how the fund will behave in any future environment rather than being surprised by it.
Bear markets and high-volatility downturns are where JEPI performs best relative to broad equity indexes. When volatility spikes, option premiums increase, so income often rises. The lower beta and the income cushion tend to make drawdowns milder than in a pure index fund. During the 2022 bear market, the share price fell towards the $6 range, yet distributions rose over that stretch as higher implied volatility translated into richer option premiums for shareholders. You still lose money in sharp selloffs, but typically less.
Sideways or choppy markets are the covered call sweet spot. If prices chop around without strong trends, JEPI keeps collecting option premium while not missing much upside. Income serves as the primary driver of total return.
| Market environment | JEPI income response | JEPI price performance vs. broad index |
|---|---|---|
| Bear / high volatility | Income tends to rise (higher premiums) | Typically outperforms (lower drawdowns) |
| Sideways / choppy | Steady income collection | Broadly comparable or slightly ahead |
| Strong bull market | Income tends to shrink (lower premiums) | Typically underperforms (capped upside) |
Strong sustained rallies, especially tech-led ones, are where JEPI falls furthest behind. The drag is double: the options overlay caps gains at the strike price each month, and the actively managed portfolio’s underweight technology position means the underlying holdings themselves participate less in tech-led rallies even before the cap applies.
This is not a criticism of the fund’s management. It is a mathematical consequence of how covered call strategies interact with strongly directional markets.
The base rate matters here more than anything else. Historically, bear markets have arrived in roughly 20-25% of years, the conditions where JEPI tends to shine. Equity markets spend the remaining 70-80% of the time advancing. Across a decade or more, that ratio means JEPI is structurally positioned to lag a broad equity index not because of any management failure, but because rising markets are where the options cap extracts the greatest cost from long-term holders.
The mechanics are settled. Now the question that actually matters: does JEPI match your specific situation?
The allocation size point is worth pausing on. A 10-15% JEPI sleeve alongside a growth-oriented core is a very different proposition from a 30% concentration, and the difference in long-run compounding impact between those two scenarios is not marginal. Fit is the only question that matters. The fund does exactly what it says it does. The question is whether what it does matches what you need.
Six misconceptions come up repeatedly, and each one can lead to a genuine portfolio error. Here they are, ranked by how seriously they distort investor behaviour:
Only approximately 32% of holdings overlap with the S&P 500, compared to roughly 95% for XYLD. The underlying portfolio is independently constructed with intentionally different sector tilts, making this a distinct strategy, not an overlay on the index.
Distributions come from dividends plus option premiums, not from systematically liquidating principal. The yield is variable and tied to volatility and option pricing. It will not be a fixed, guaranteed 8%, but the income sources are legitimate.
Rigorous covered call ETF evaluation goes beyond the headline yield figure: distribution streak length, lifetime payout growth rate, and total return context together determine whether a fund is delivering sustainable income or gradually eroding its own asset base to sustain distributions.
It underperforms in strong bull markets by design because the product explicitly trades upside for income and lower volatility. Judging JEPI against the S&P 500 in a roaring bull market is applying the wrong benchmark to a fund that was built for a different purpose.
This is the misconception with the highest stakes. A capped-upside structure means that putting distributions back to work inside the same fund for a decade or more is unlikely to match the long-run growth a broad equity index would deliver inside that same tax shelter.
Roth IRA space is generally best reserved for assets with the highest long-term appreciation potential. Using that shelter for a capped-upside income asset is a structural mismatch that compounds negatively over time, and it is a difficult allocation decision to reverse once made.
Total return equals income plus price change. A high yield can be offset, or even outweighed, by subdued price appreciation. JEPI’s appeal is its income profile and smoother ride, not necessarily maximising total return.
Sector composition is materially different. If you hold JEPI as an index replacement, you will encounter significant tracking divergence during tech-led rallies, and the surprise when it arrives is usually unwelcome.
Four questions cut through the complexity. Work through each one with your own situation in mind:
For investors in higher brackets who want to work through the specific maths of where to hold income-generating assets across taxable, traditional, and Roth accounts, our full explainer on tax-efficient asset location covers how asset location decisions interact with ordinary income treatment to affect real after-tax compounding over decades.
JEPI delivers income and lower volatility in exchange for capped upside. That is its design. It is not built for maximum long-term growth, and evaluating it on those terms will always produce the wrong answer.
JEPI is a competitively priced, purpose-built income tool that delivers on its stated design. The design is genuinely narrow. Your job is to know whether your combination of objectives, timeline, account type, and portfolio role falls inside or outside what the fund was built to do. That answer is yours to make.
This article is for informational purposes only and should not be considered financial advice. Investors should conduct their own research and consult with financial professionals before making investment decisions. Past performance does not guarantee future results. Financial projections and yield figures are subject to market conditions and various risk factors.
JEPI is an actively managed covered call ETF run by JPMorgan that generates income from two sources: dividends from its underlying stock portfolio (roughly 20% of distributions) and options premium collected via equity-linked notes (roughly 80% of distributions), producing a historical 12-month rolling yield of approximately 8.0-8.4%.
No. Only approximately 32% of JEPI's holdings overlap with the S&P 500 by weight, compared to roughly 95% for a fund like XYLD. JEPI is independently constructed with deliberate sector tilts, including a technology weighting of around 16% versus the 30%+ found in a typical S&P 500 fund.
Approximately 80% of JEPI distributions are derived from options premium via equity-linked notes, which is classified as ordinary income rather than qualified dividends. For investors in a 37% marginal bracket, a nominal 8% yield can fall to approximately 5% after tax, making account placement a critical decision.
In strong bull markets, JEPI typically underperforms broad equity indexes because the options overlay caps gains at the strike price each month and the portfolio's tech underweight means less participation in tech-led rallies. In bear markets and high-volatility environments, JEPI tends to outperform with milder drawdowns and rising income as elevated volatility increases option premiums.
A 10-20% volatility-dampening sleeve alongside a growth-oriented core is a defensible use of JEPI, while a 30% or greater concentration in a long-term portfolio is generally inappropriate because the capped upside structure compounds against wealth accumulation over decades, particularly for investors with 20-30 year horizons.