Betashares ETF Distributions: 20 Funds Pay Up to 124 Cents
3 hrs ago
The ex-dividend date for the July 2026 iShares ASX ETF distribution round is today, 1 July 2026. The window to qualify has just closed. For investors already holding units, distributions ranging from 11.26 cents to nearly $14 per unit will hit accounts on 13 July.
BlackRock has released estimated distribution figures across its full iShares ASX lineup, and the numbers vary by an order of magnitude depending on the fund. Two funds are distributing more than $10 per unit. The mainstream S&P 500 ETF is paying around 23 cents. Both facts are true, and understanding why is the difference between reading a payout schedule and actually knowing what it means.
Here is the full payout schedule across every asset class in the iShares range, the structural reason currency-hedged ETFs post dramatically higher per-unit figures, and what to confirm before the 13 July payment date. The numbers matter, but how you read them matters more.
The three dates that govern this distribution cycle are now locked in:
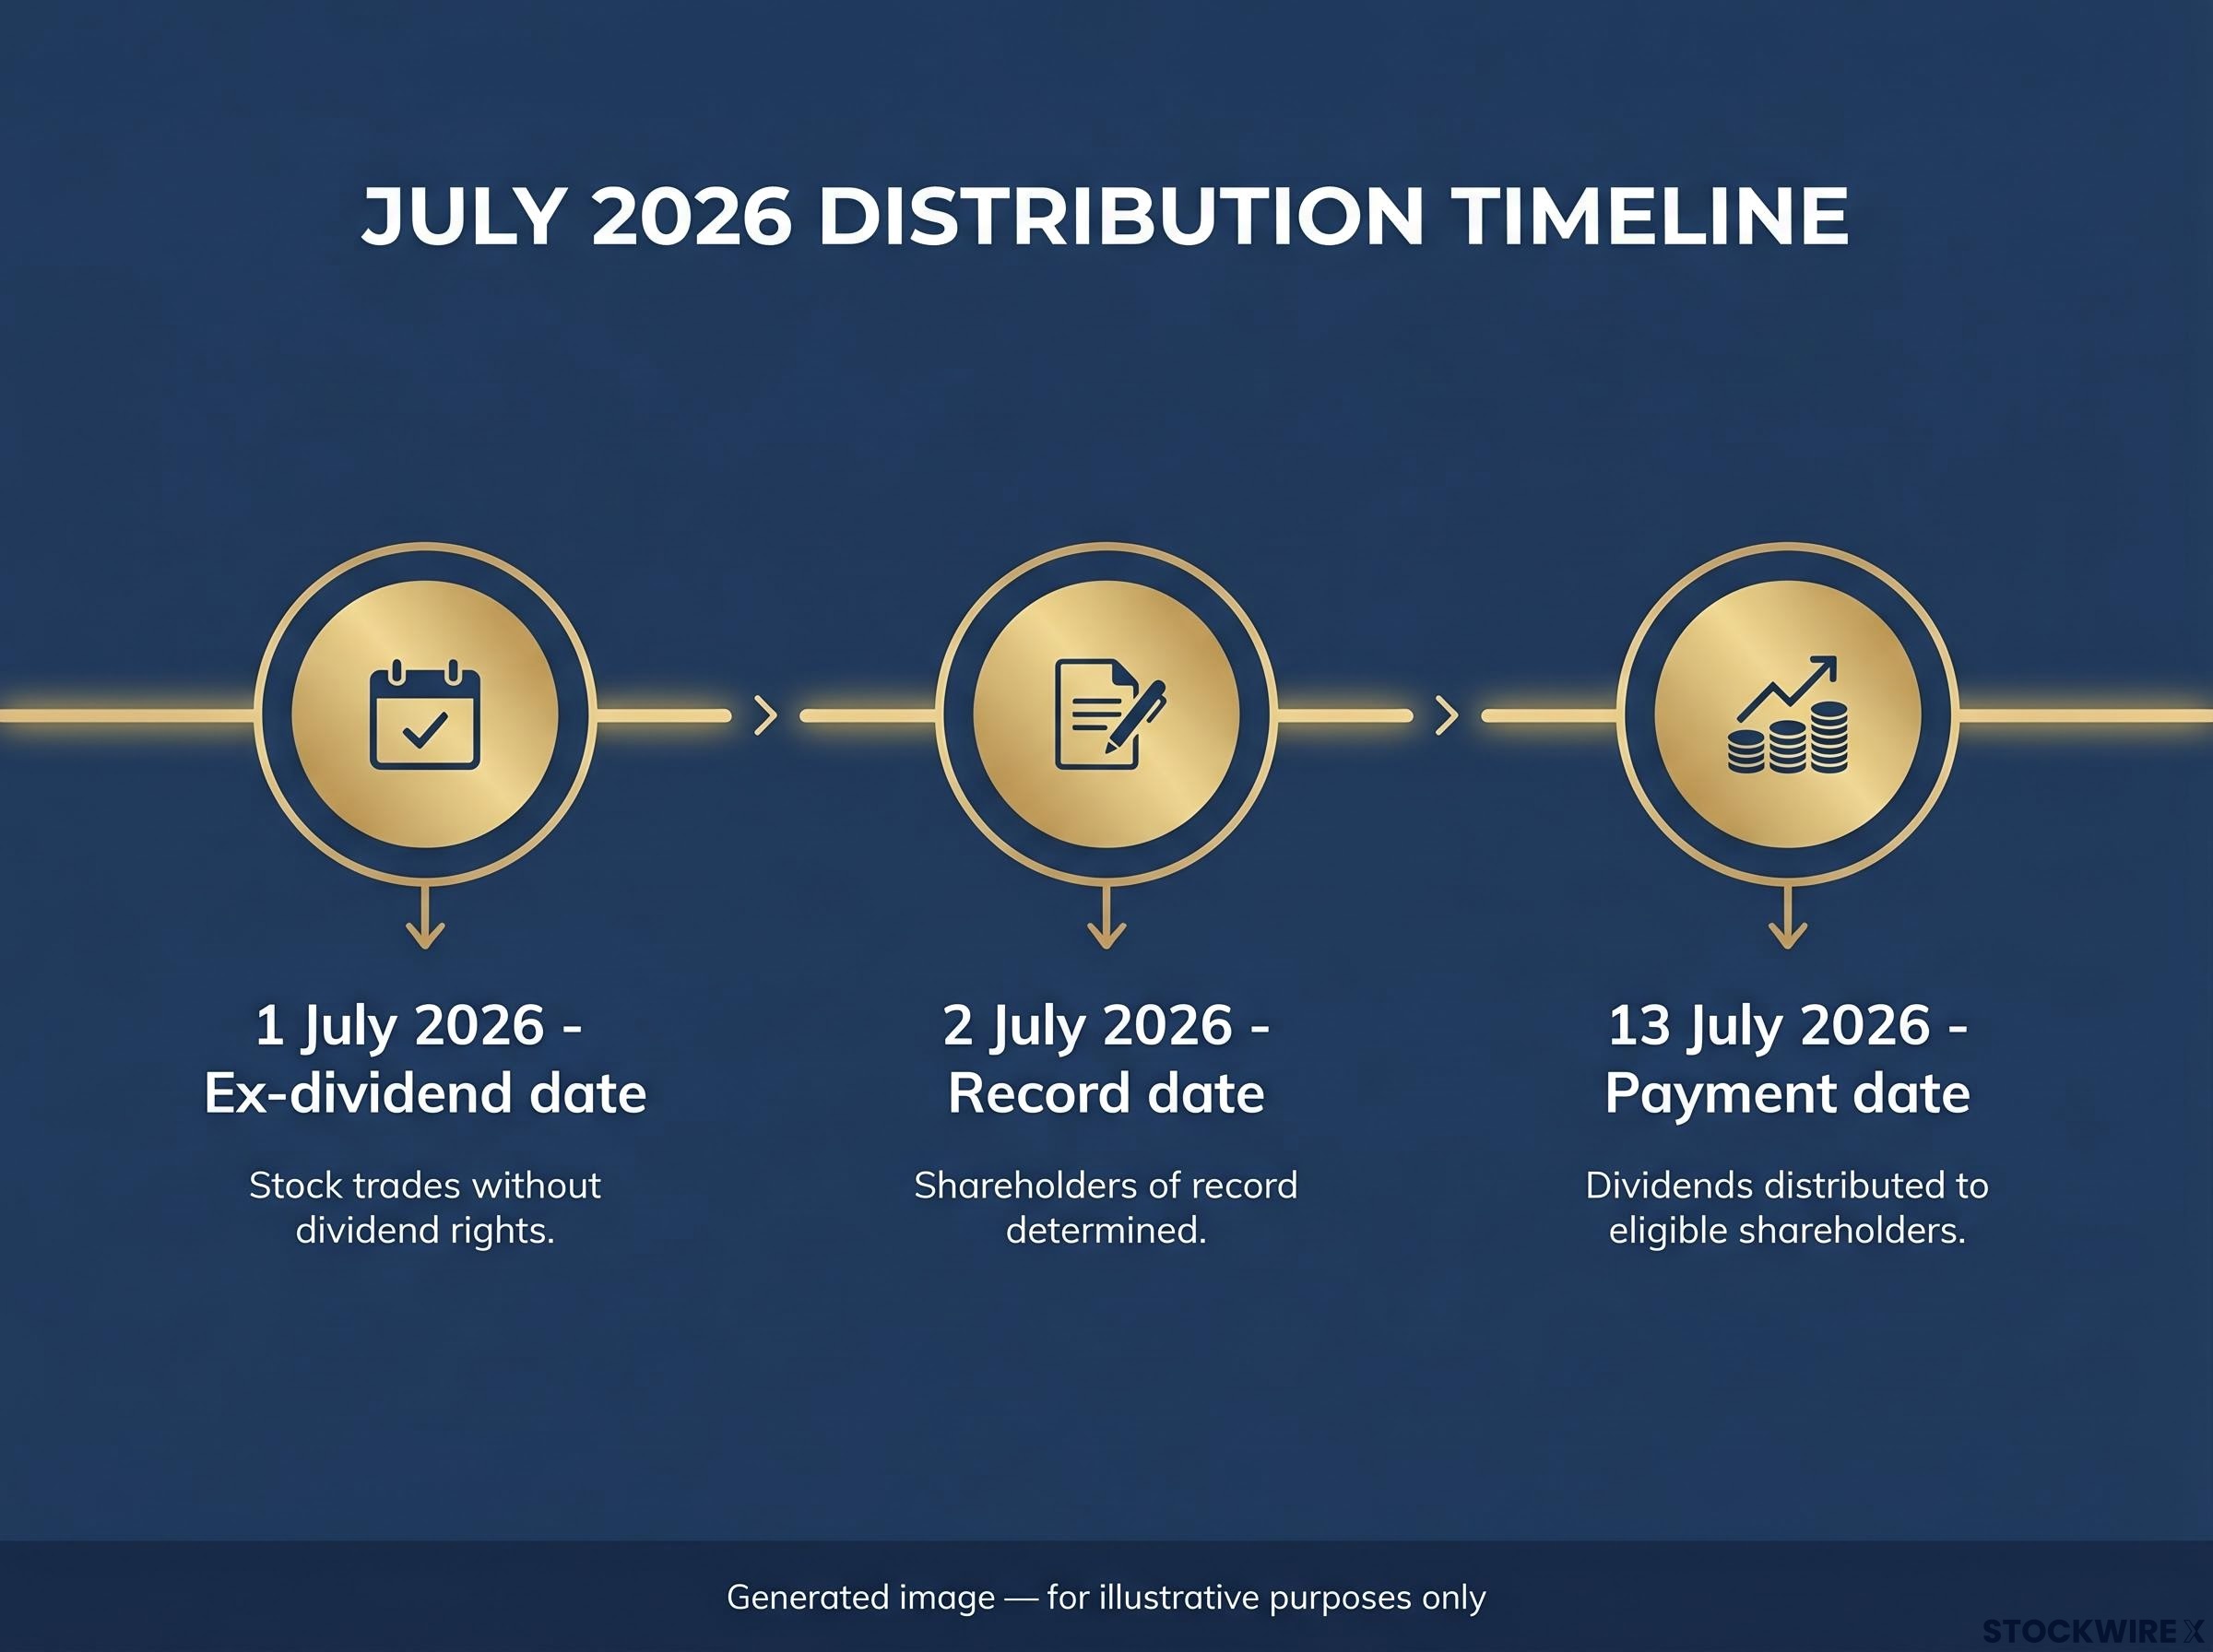
Units had to be held before the market opened today to qualify for this round. That means the trade needed to have settled, not just been placed, before the ex-dividend date. Purchases made on or after today are ineligible and will only participate from the next distribution cycle.
ASIC RG 282 on exchange-traded products sets out the obligations governing ASX-quoted ETFs, including the issuer disclosure and quotation requirements that underpin the distribution announcement process BlackRock follows each quarter.
For investors who already hold units, the payment date gives a concrete cashflow anchor: distributions land on 13 July. For anyone who bought in the last few days, checking settlement dates with your broker is the fastest way to confirm whether you are in or out of this round.
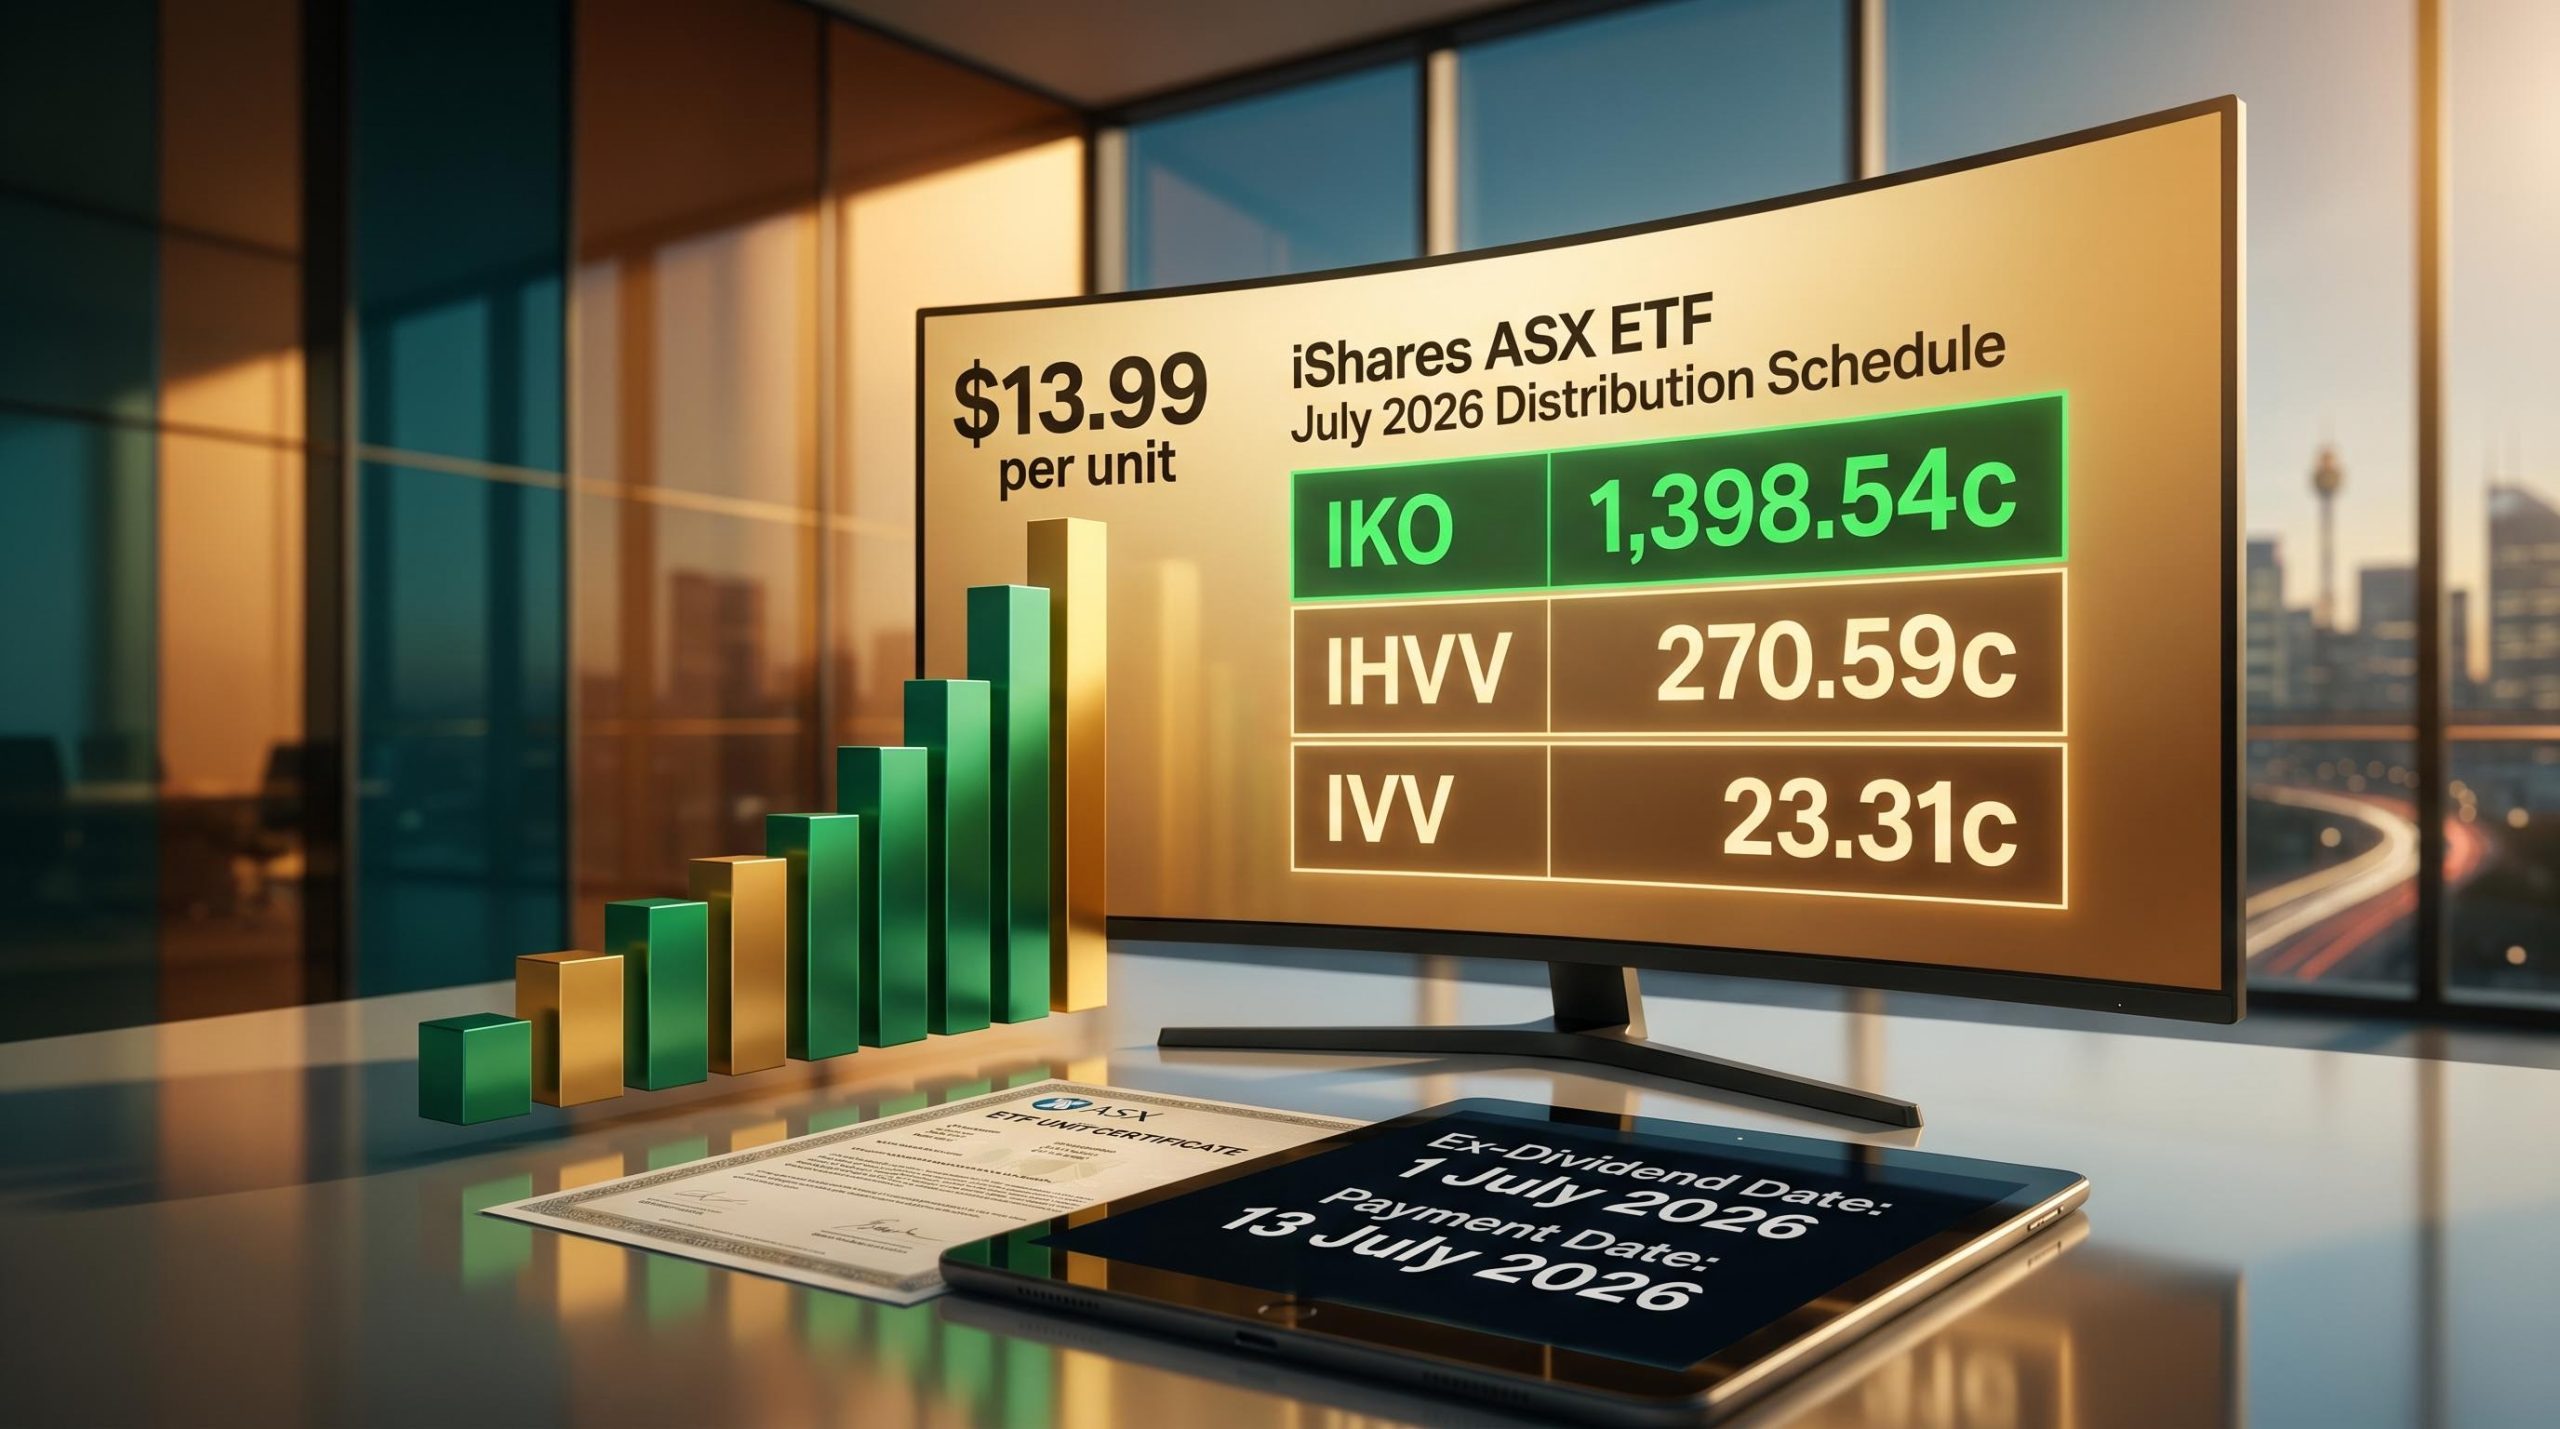
The range across the iShares schedule this season is striking. IKO, the MSCI South Korea ETF, tops the list at an estimated 1,398.54 cents per unit (approximately $13.99). IHD, the S&P/ASX Dividend Opportunities ESG Screened ETF, sits at the bottom with 11.26 cents.
That gap is not a reflection of which fund is generating superior income. It is a product of unit price differences, asset class mechanics, and hedging structures that the next section unpacks. For now, here is the full schedule.
Note: All figures below are estimated and subject to final confirmation by BlackRock. Final declared distributions may differ once all income, expenses, and hedging results are closed out.
Australian equity funds show the most familiar, moderate per-unit figures in this round.
| Ticker | Fund Name | Est. Distribution (cents/unit) |
|---|---|---|
| ILC | S&P/ASX 20 ETF | 29.57 |
| IOZ | Core S&P/ASX 200 ETF | 24.25 |
| ISO | S&P/ASX Small Ordinaries ETF | 17.07 |
| IHD | S&P/ASX Dividend Opportunities ESG Screened ETF | 11.26 |
This is where the range becomes dramatic. IKO and IHOO are both distributing more than $10 per unit, while IVV and IJH sit in the low twenties in cents. The drivers behind that gap are structural, not performance-based.
| Ticker | Fund Name | Est. Distribution (cents/unit) |
|---|---|---|
| IKO | MSCI South Korea ETF | 1,398.54 |
| IHOO | Global 100 Currency-Hedged ETF | 1,182.10 |
| IEU | Europe ETF | 722.51 |
| IVE | MSCI EAFE ETF | 308.07 |
| IHVV | S&P 500 AUD Hedged ETF | 270.59 |
| IJP | MSCI Japan ETF | 209.47 |
| ITEK | Nasdaq Top 30 ETF | 202.43 |
| IAA | Asia 50 ETF | 195.91 |
| IOO | Global 100 ETF | 181.55 |
| IXJ | Global Healthcare ETF | 153.97 |
| IXI | Global Consumer Staples ETF | 125.95 |
| IJR | S&P Small-Cap ETF | 82.46 |
| IEM | MSCI Emerging Markets ETF | 75.44 |
| IZZ | S&P China Large-Cap ETF | 44.78 |
| IVV | S&P 500 ETF | 23.31 |
| IJH | S&P Mid-Cap ETF | 21.21 |
The income-oriented segment is led by ULTB and GLIN, where hedging carry sits on top of bond and infrastructure yields, pushing per-unit payouts well above what unhedged equivalents would deliver.
| Ticker | Fund Name | Est. Distribution (cents/unit) |
|---|---|---|
| ULTB | 20+ Year US Treasury Bond AUD Hedged ETF | 212.40 |
| GLIN | Core FTSE Global Infrastructure AUD Hedged ETF | 132.61 |
| ALTB | 15+ Year Australian Government Bond ETF | 104.26 |
| GLPR | Core FTSE Global Property Ex Australia AUD Hedged ETF | 84.69 |
| IAF | Core Composite Bond ETF | 75.78 |
| ILB | Government Inflation ETF | 69.74 |
| BILL | Core Cash ETF | 33.63 |
| ISEC | Enhanced Cash ETF | 28.69 |
The gap between IVV at 23.31 cents and IHVV at 270.59 cents looks like one fund is dramatically outperforming the other. It is not. Both track the S&P 500. The difference is mechanical.
Hedged ETFs, including IHVV, IHOO, ULTB, GLIN, and GLPR, use rolling currency forward contracts to neutralise foreign exchange risk back to Australian dollars. A currency forward is a contract that locks in an exchange rate for a future date, removing the impact of currency movements on the fund’s returns. When Australian interest rates sit above those in the foreign market (as they currently do relative to several overseas economies), that rate differential generates positive carry income, which is additional distributable cash on top of normal portfolio income.
RBA analysis of currency hedging and interest rate differentials confirms that when domestic rates exceed those of the target currency market, the resulting carry income flows through to investors as additional distributable return, which is the mechanical basis for the wide gap between hedged and unhedged fund payouts in this round.
| Ticker | Underlying Index | Hedged | Est. Distribution (cents/unit) |
|---|---|---|---|
| IVV | S&P 500 | No | 23.31 |
| IHVV | S&P 500 | Yes | 270.59 |
| IOO | Global 100 | No | 181.55 |
| IHOO | Global 100 | Yes | 1,182.10 |
IKO‘s $13.99 payout, the schedule’s highest, reflects a combination of accumulated income, the timing of major Korean dividend cycles, and currency translation effects as distributions move from Korean won through US dollars into Australian dollars.
A larger distribution does not mean a higher-yielding fund. It means more of the total return is arriving as cash rather than being retained in the unit price.
For an investor choosing between IVV and IHVV, the distribution difference of roughly $2.47 per unit tells you almost nothing about which fund is the better long-term choice. It tells you only how the return is packaged.
The performance gap between hedged vs unhedged ETF returns is not fixed; HNDQ returned 40.2% against NDQ’s 27.2% over the year to May 2026, a 13-percentage-point difference produced entirely by AUD/USD appreciation, which illustrates precisely why comparing per-unit distributions between IVV and IHVV without accounting for total return context produces a misleading picture.
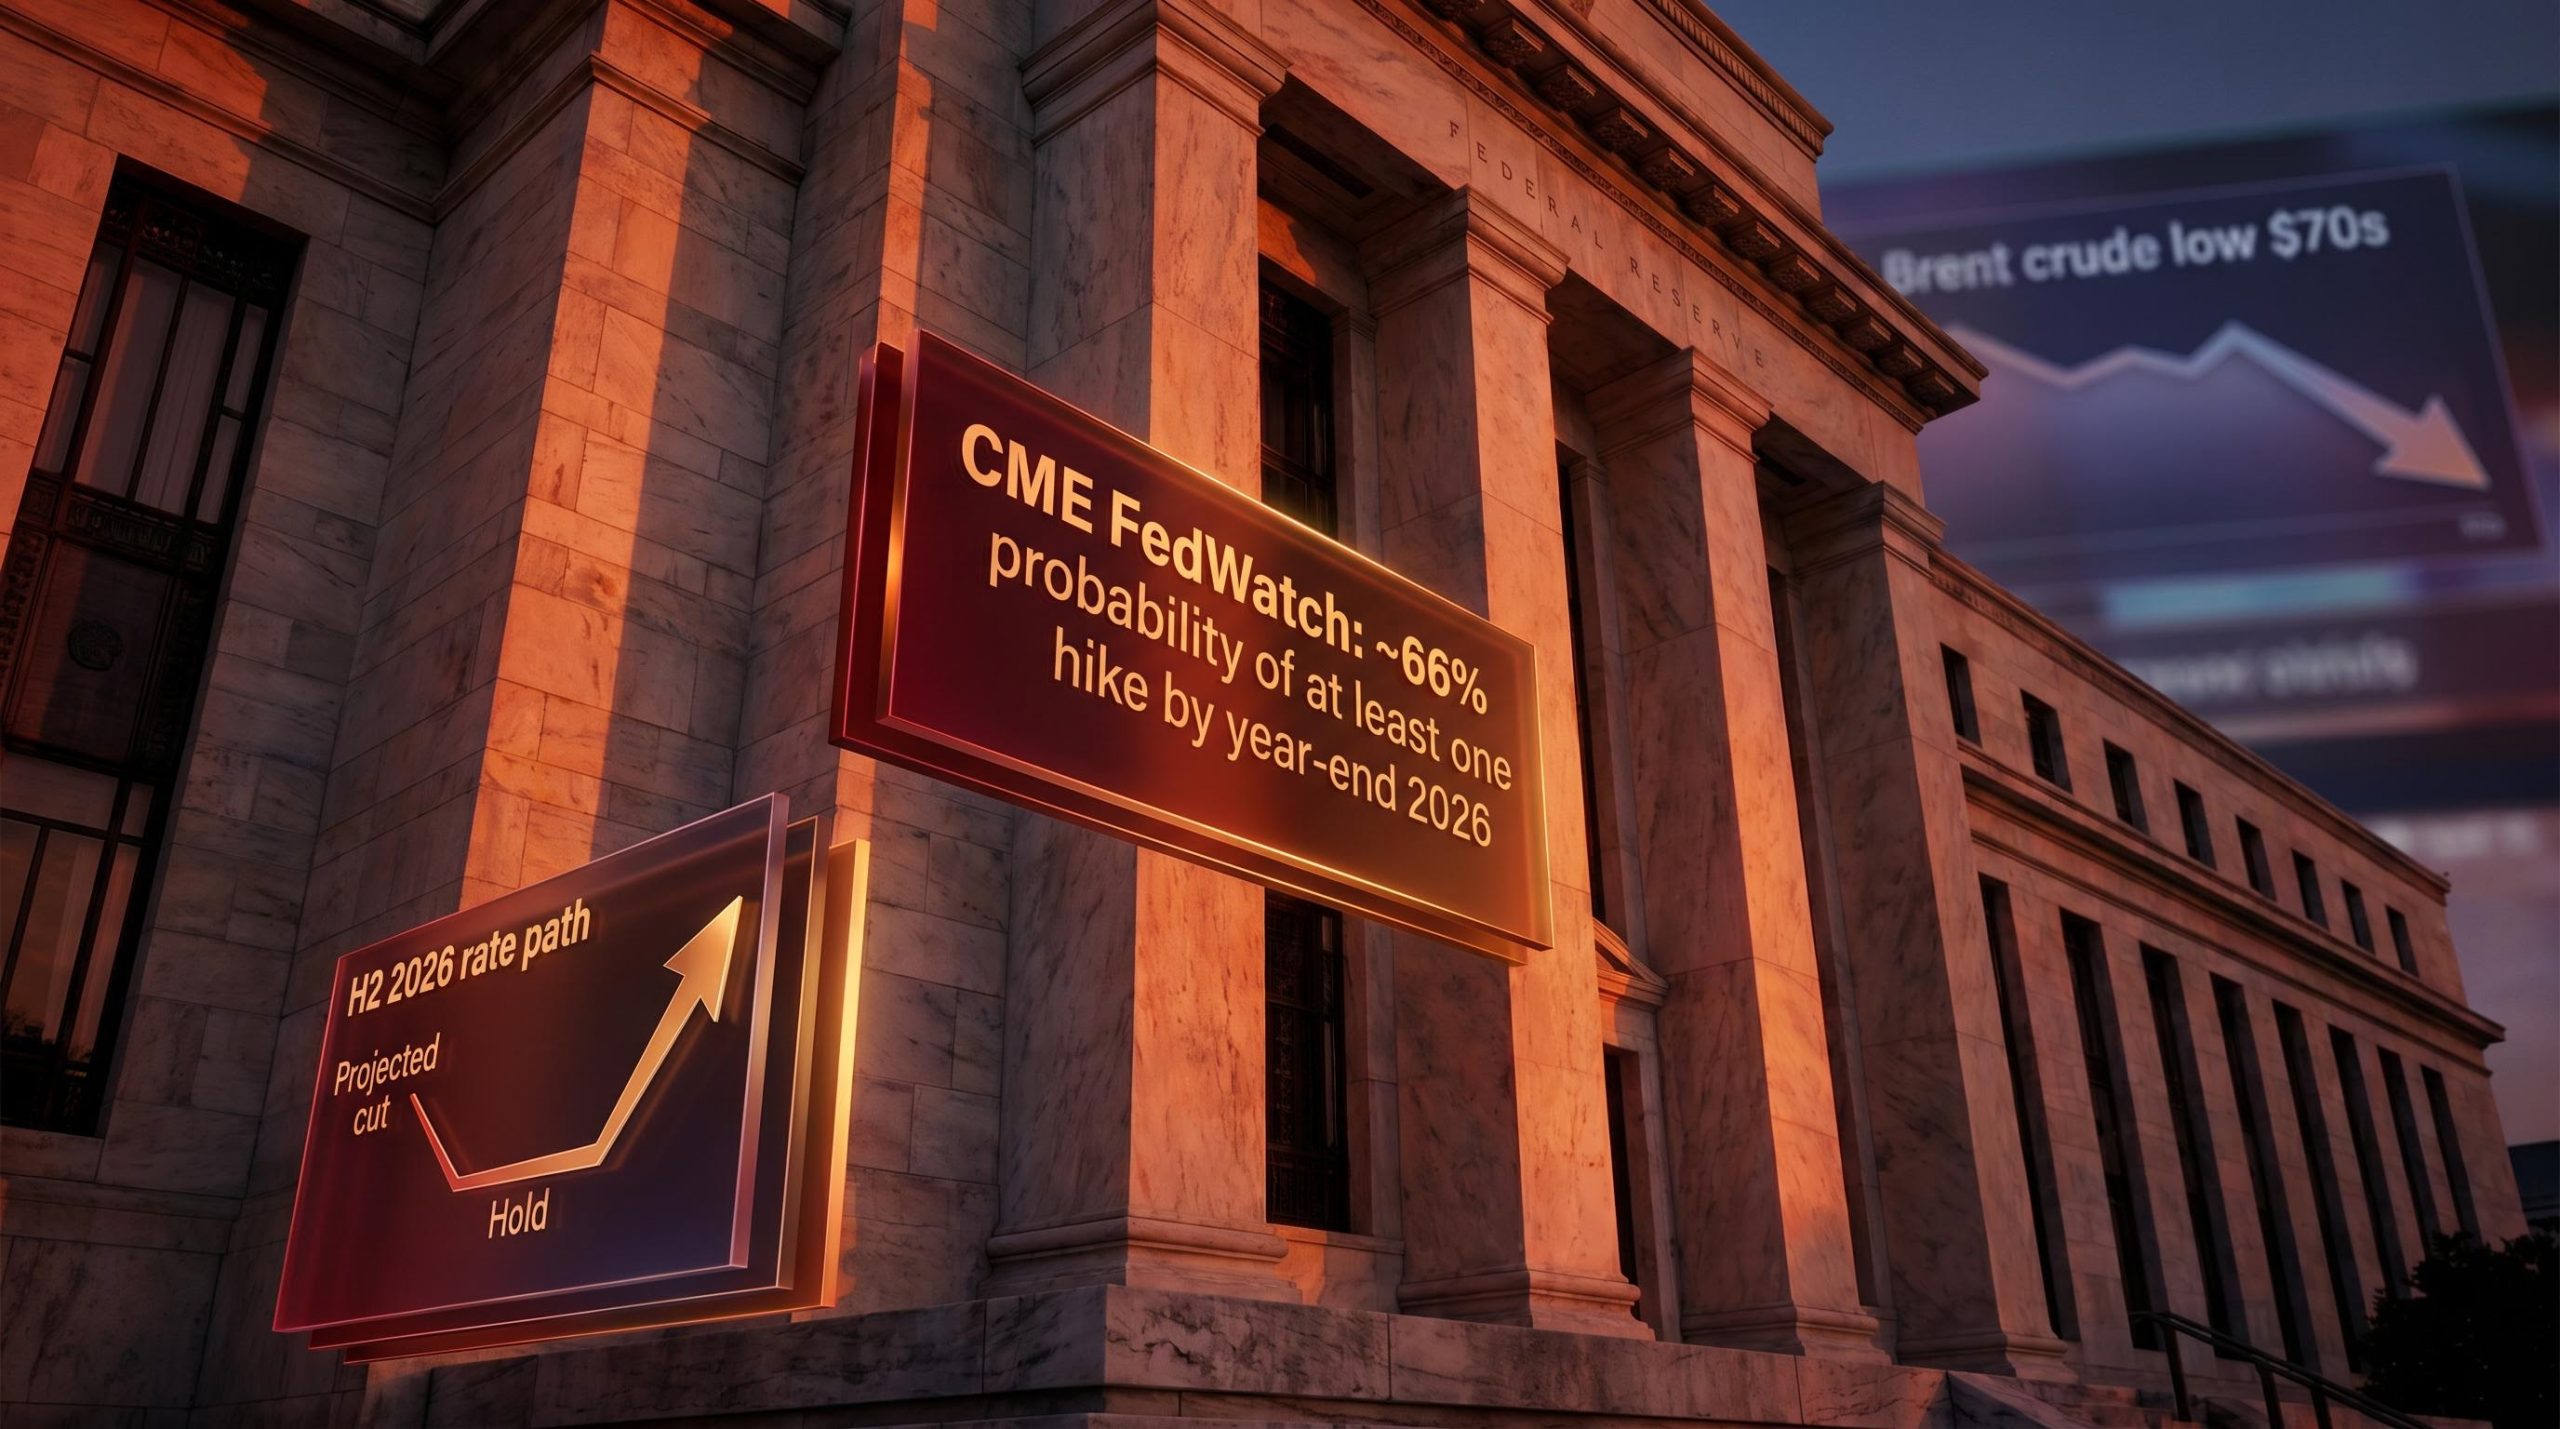
The July 2026 distribution season is producing large payouts across the board, not just within the iShares range. Reports indicate VanEck has an upcoming distribution of approximately $17.99 per unit (unverified), and Global X has announced a payout of around $16.26 per unit (unverified). Vanguard is also distributing in this cycle.
Even IKO‘s $13.99 is not the absolute peak in the broader market this season. The pattern is consistent across providers, and three market-wide structural drivers explain why:
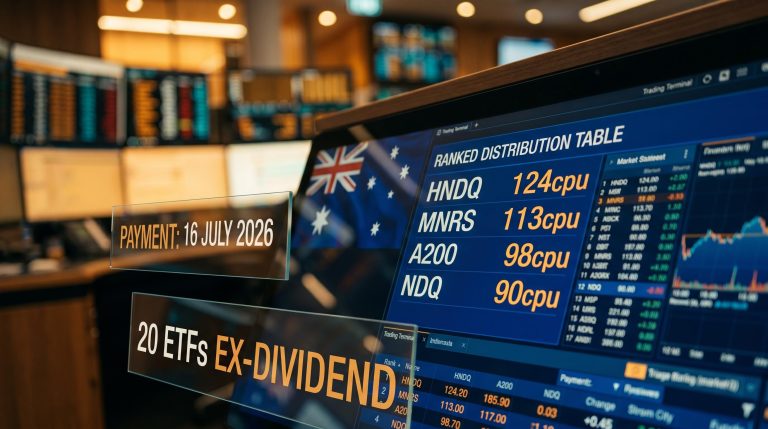
Betashares July 2026 distributions show the same hedging carry pattern in sharp relief: HNDQ is paying an estimated 34 cents per unit more than NDQ despite both tracking the identical Nasdaq 100 index, a gap produced entirely by the currency-hedging overlay rather than any difference in underlying holdings or management.
That pattern confirms this is a structural income environment, not a single-issuer event. Investors holding multi-provider ETF portfolios should expect multiple large distributions arriving in July 2026, and the same evaluation discipline, percentage yield rather than absolute cents, applies regardless of which provider’s logo is on the fund.
The payout schedule is set. What remains is making sure the administrative details are in order before the money moves. Investors who have not actively reviewed their broker or registry settings recently are the most likely to encounter a delayed or misdirected payment.
The distribution hitting your account on 13 July is assessable income. But the dollar figure alone does not determine your tax outcome; the composition inside it does.
ETF distributions are broken into components that each carry different tax treatment:
For investors holding significant positions in currency-hedged funds, specifically IHVV, IHOO, ULTB, GLIN, and GLPR, the hedging carry income changes the mix of these components materially. A distribution dominated by hedging income will look very different on a tax statement than one dominated by franked dividends, and the after-tax outcome will vary depending on your marginal tax rate and individual circumstances.
Investors with material holdings in hedged funds should consider reviewing their tax position with a tax adviser once final annual tax statements are released later in the calendar year.
For investors holding positions across multiple hedged funds in this cycle, our full explainer on ETF tax obligations in Australia covers the cost base adjustment requirements, foreign income gross-up rules, and CGT discount traps that determine whether a large July distribution creates a straightforward tax outcome or a materially more complex one.
The income composition, not just the dollar amount, determines whether this round is tax-efficient or tax-costly for your specific situation.
This article is for informational purposes only and should not be considered financial advice. Investors should conduct their own research and consult with financial professionals before making investment decisions.
The single most useful takeaway from this schedule is a framework, not a figure. Percentage yield relative to unit price is the metric that matters. Divide the estimated distribution by the current unit price and annualise based on how many times the fund distributes per year. That gives you a number you can compare across funds, across providers, and across hedged and unhedged versions without the distortion that raw cents introduce.
The July 2026 round reflects a specific income environment: elevated rates, strong dividend markets, and hedging carry that may not persist at these levels. Anchoring long-term income expectations to a single large payout is a mistake. Income environments shift, and the next distribution round may look materially different.
More cents per unit does not mean a better fund. It means more of the total return is being delivered as cash rather than retained in the unit price. Compare percentage yield and total return, not headline distribution figures.
For accumulation investors in particular, a high-distribution fund may not outperform a low-distribution equivalent on total return. The investor who leaves this schedule understanding that distinction has gained something more durable than a payment date.
—
BlackRock has set 13 July 2026 as the payment date for this distribution round. The ex-dividend date was 1 July 2026, meaning units needed to be held and settled before that date to qualify.
Both IVV and IHVV track the S&P 500, but IHVV uses currency forward contracts to hedge AUD/USD exposure. When Australian interest rates exceed those in the target currency market, that rate differential generates positive carry income that is added to the distribution, which is why IHVV is paying an estimated 270.59 cents per unit compared to IVV's 23.31 cents.
IKO, the iShares MSCI South Korea ETF, tops the schedule at an estimated 1,398.54 cents per unit (approximately $13.99), reflecting a combination of accumulated income, the timing of major Korean dividend cycles, and currency translation effects.
Divide the estimated distribution by the current unit price and annualise based on how many times the fund distributes per year to get a percentage yield. Comparing raw cents per unit across funds with different unit prices and hedging structures produces a misleading picture of income performance.
Confirm your trade settled before 1 July to verify eligibility, check that your registered bank account details are current with your broker or registry, and verify whether you are enrolled in a Dividend Reinvestment Plan if you were expecting a cash payment rather than new units.