Hormuz Prices Have Normalised. Geopolitical Inflation Risk Has Not.
1 hr ago

Roughly 80% of Nasdaq long positions are now loss-making, according to a Citi research note published today. That single figure rewrites the risk profile for anyone holding tech-heavy U.S. equity exposure.
The headline positioning data across broader markets looks calm. Aggregate futures positioning sits near neutral. But beneath that surface, Citi strategist David Chew has identified a specific and deepening imbalance inside the Nasdaq-100: the majority of investors who are long the index are now sitting on losses, and when crowded positions flip from profit to loss at this scale, selling can become mechanical rather than discretionary.
Here is what that finding actually means, how the forced-selling risk works, which signals tell you whether it is escalating, and what it changes for your portfolio if you hold tech or broad U.S. index exposure.
The core diagnostic is stark. Approximately 80% of Nasdaq-100 long positions are now estimated to be in the red, per Citi’s 30 June 2026 research note attributed to strategist David Chew.
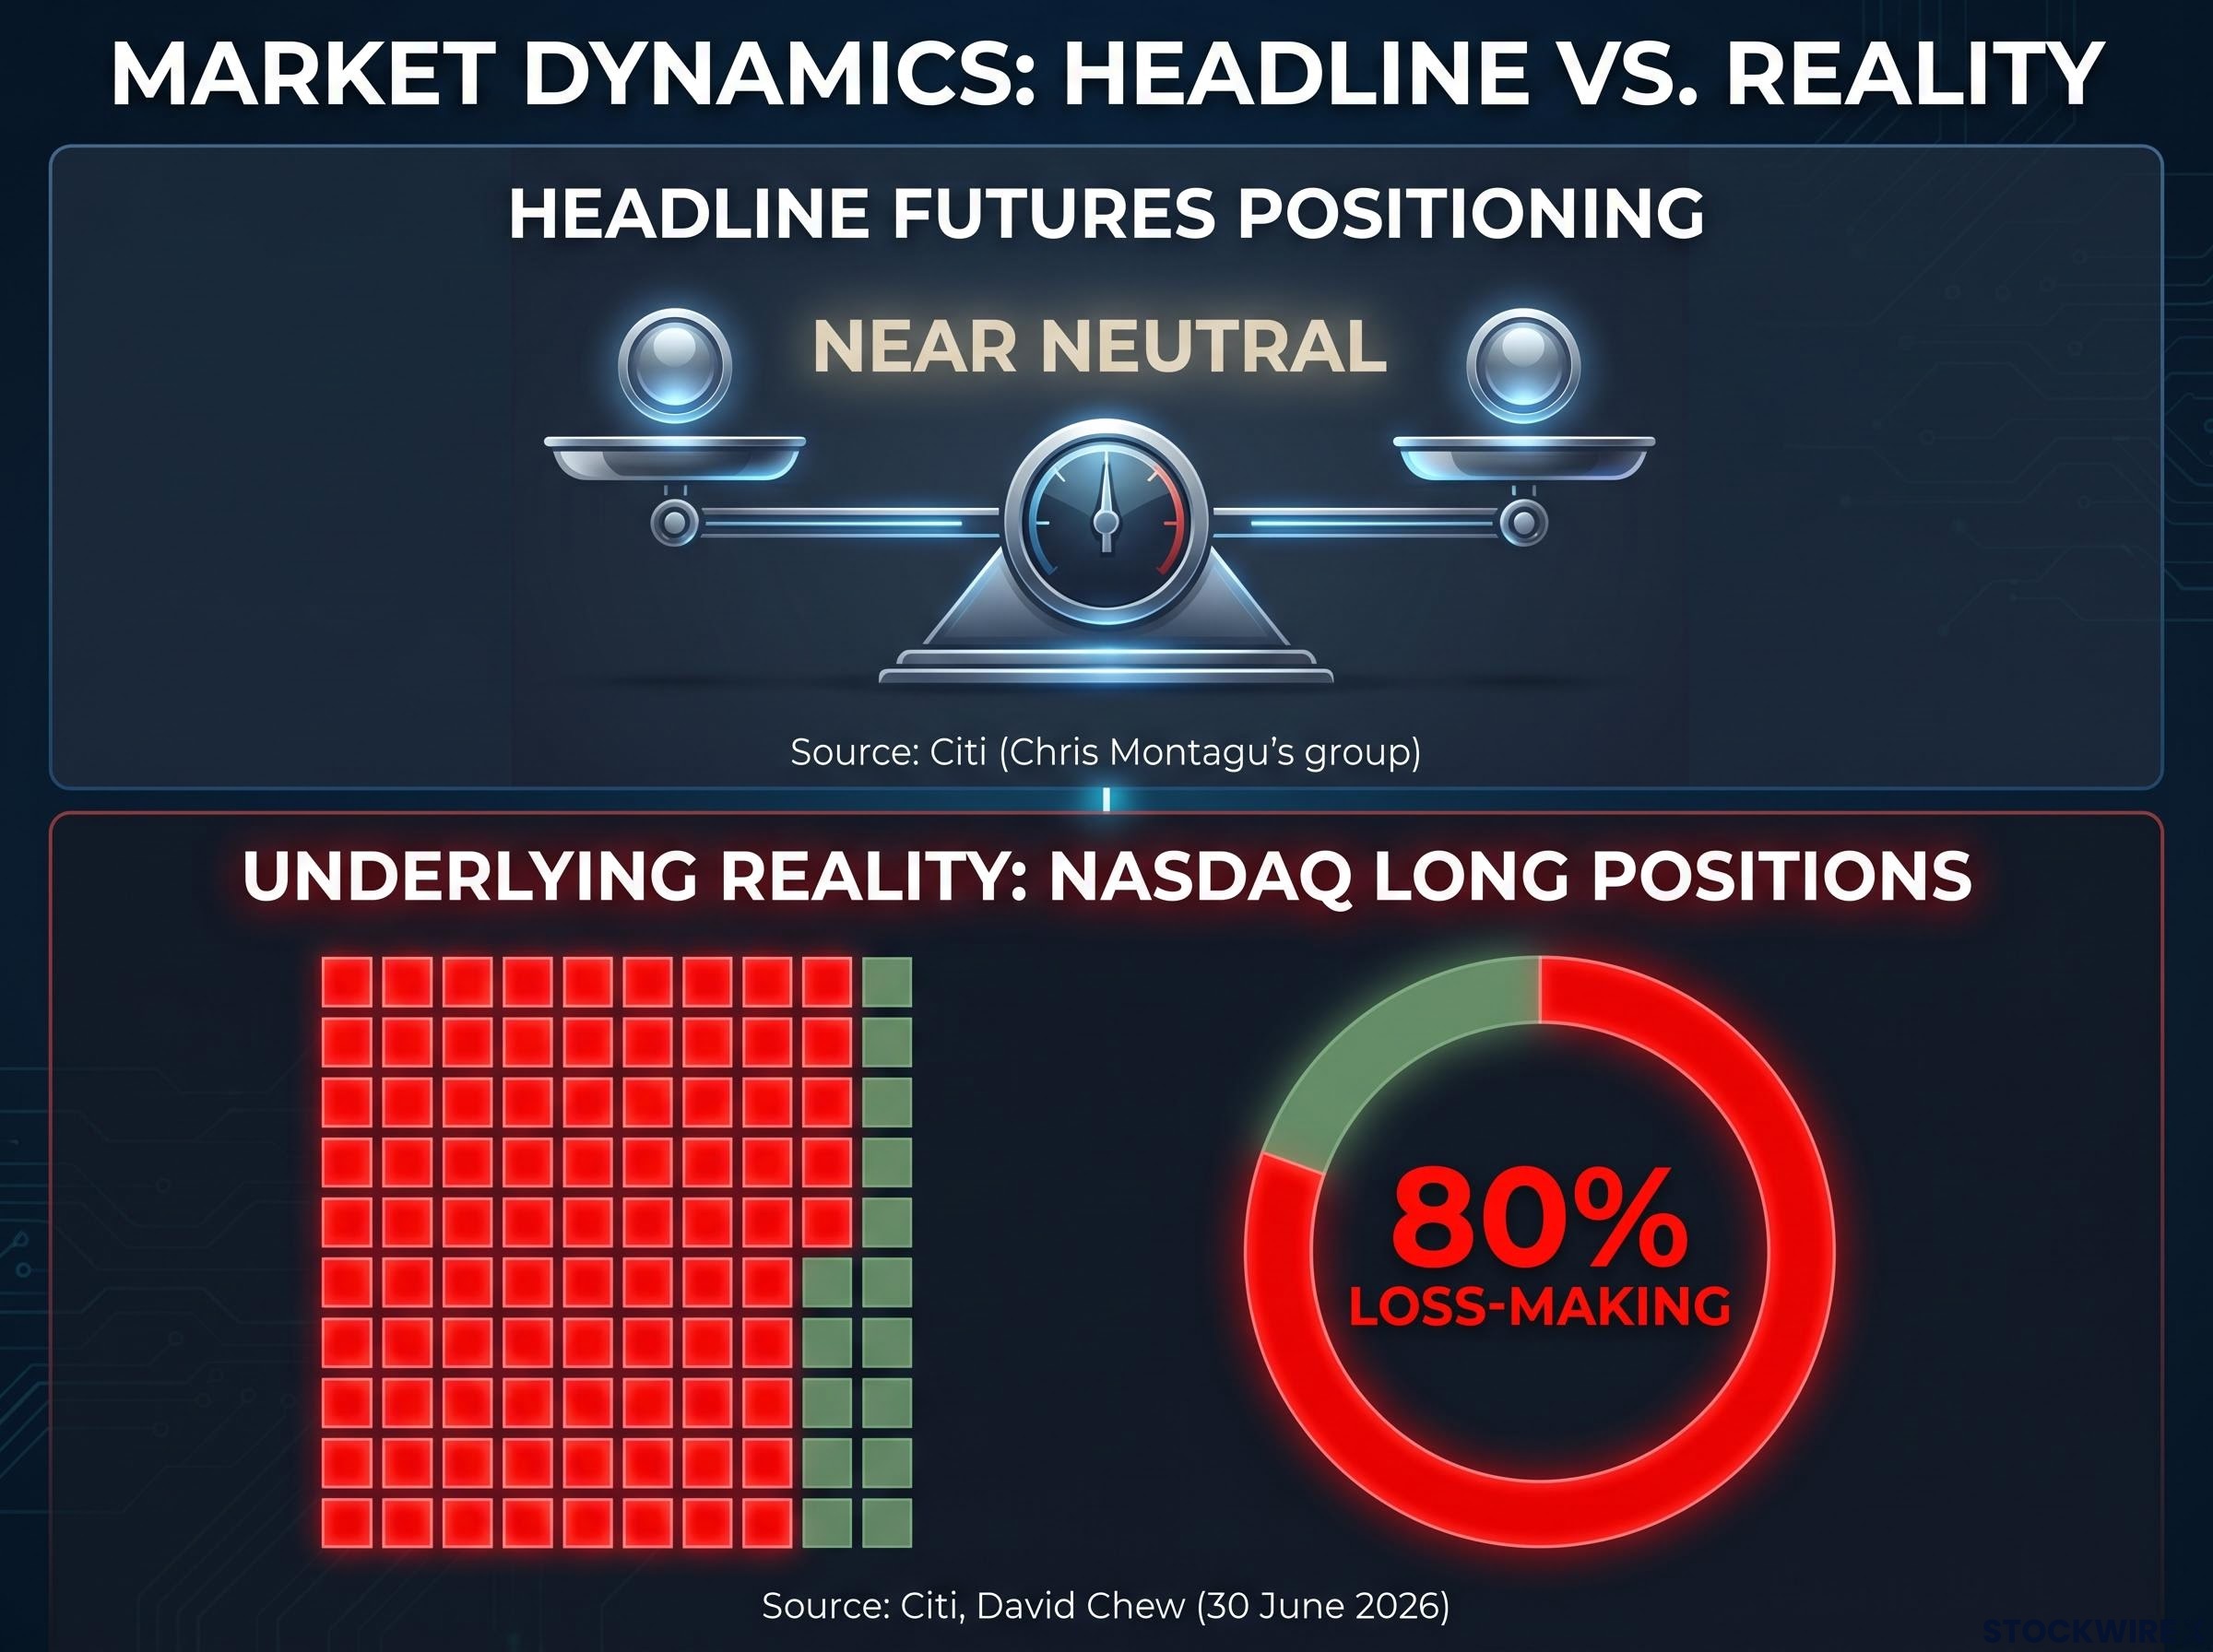
Approximately 80% of Nasdaq long positions are now loss-making, according to Citi’s analysis published 30 June 2026, a sharp deterioration from an earlier assessment in which most longs were still in profit.
That earlier Citi assessment, also led by Chew, had flagged the same problem in a milder form: long positioning was extended, but most of those positions were still profitable. Investors were crowded, but cushioned. The newer reading reflects what additional price declines have done to that cushion: eliminated it.
The 30 June note represents a material deterioration from Citi’s earlier assessment of tech positioning risk, published on 9 June 2026, which warned that bullish Nasdaq exposure remained dangerously stretched even after the 4.18% single-session selloff, because most long positions were still profitable enough to allow quick exits on any negative catalyst.
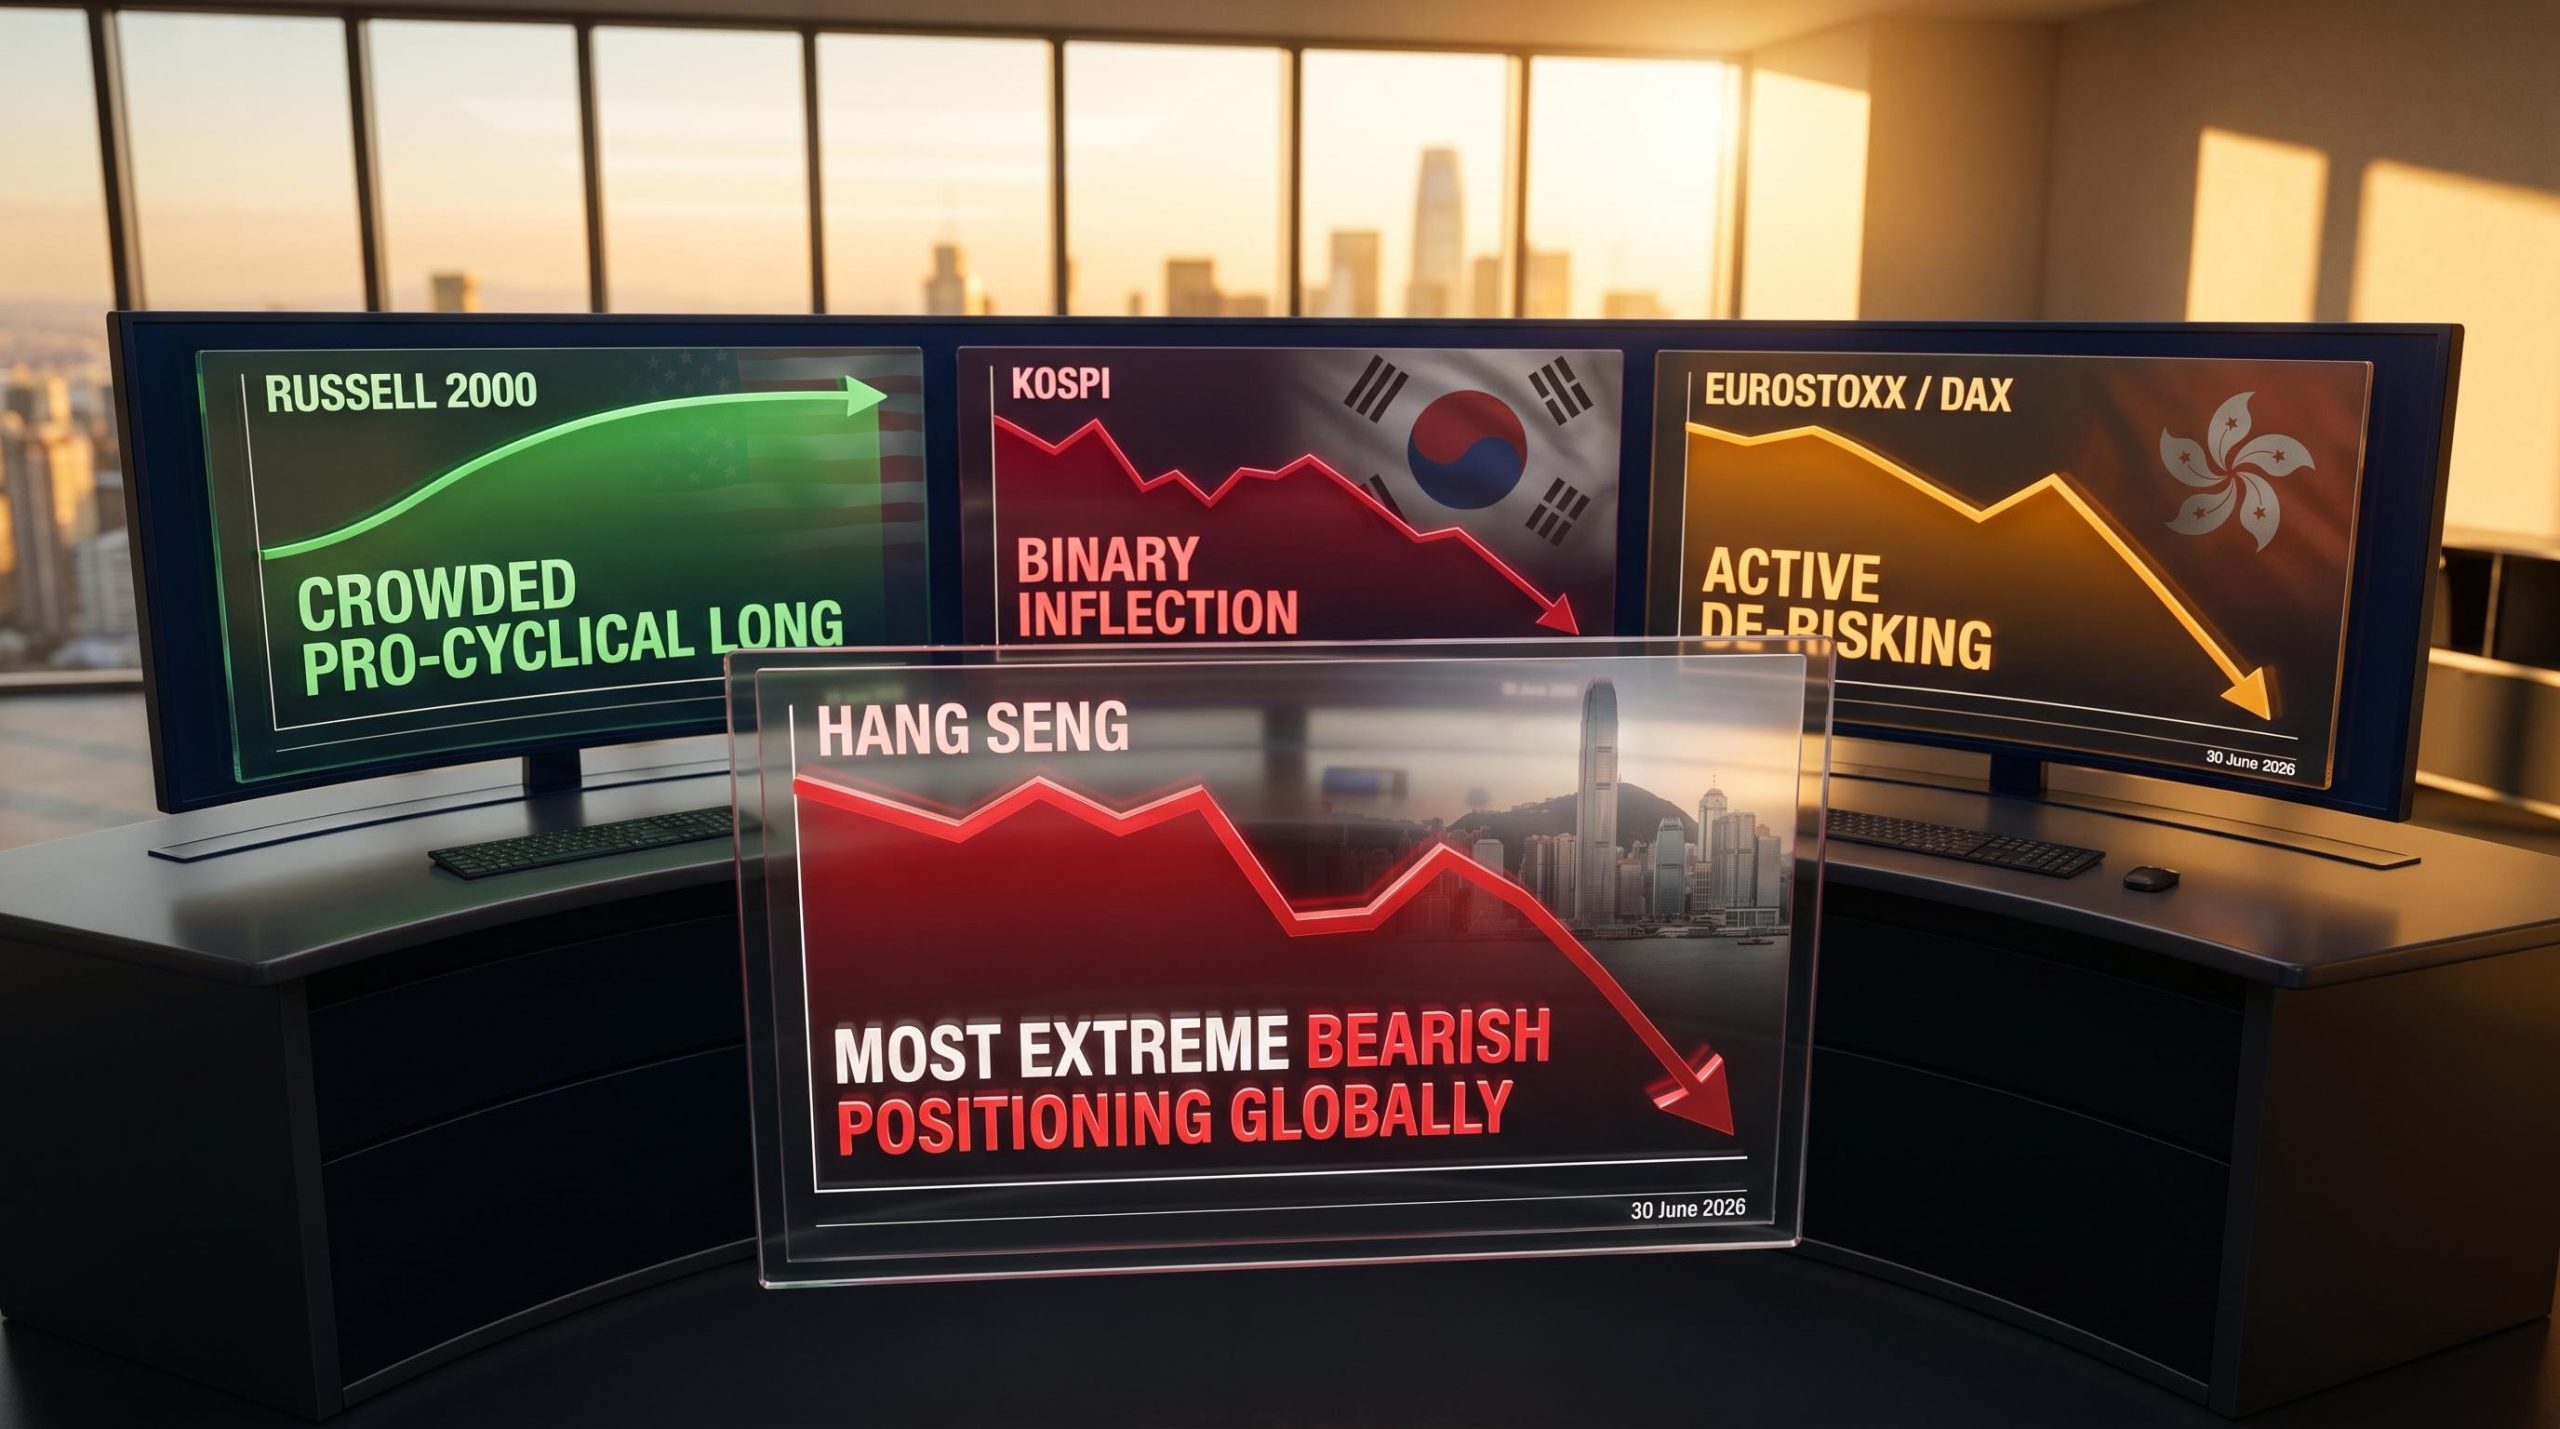
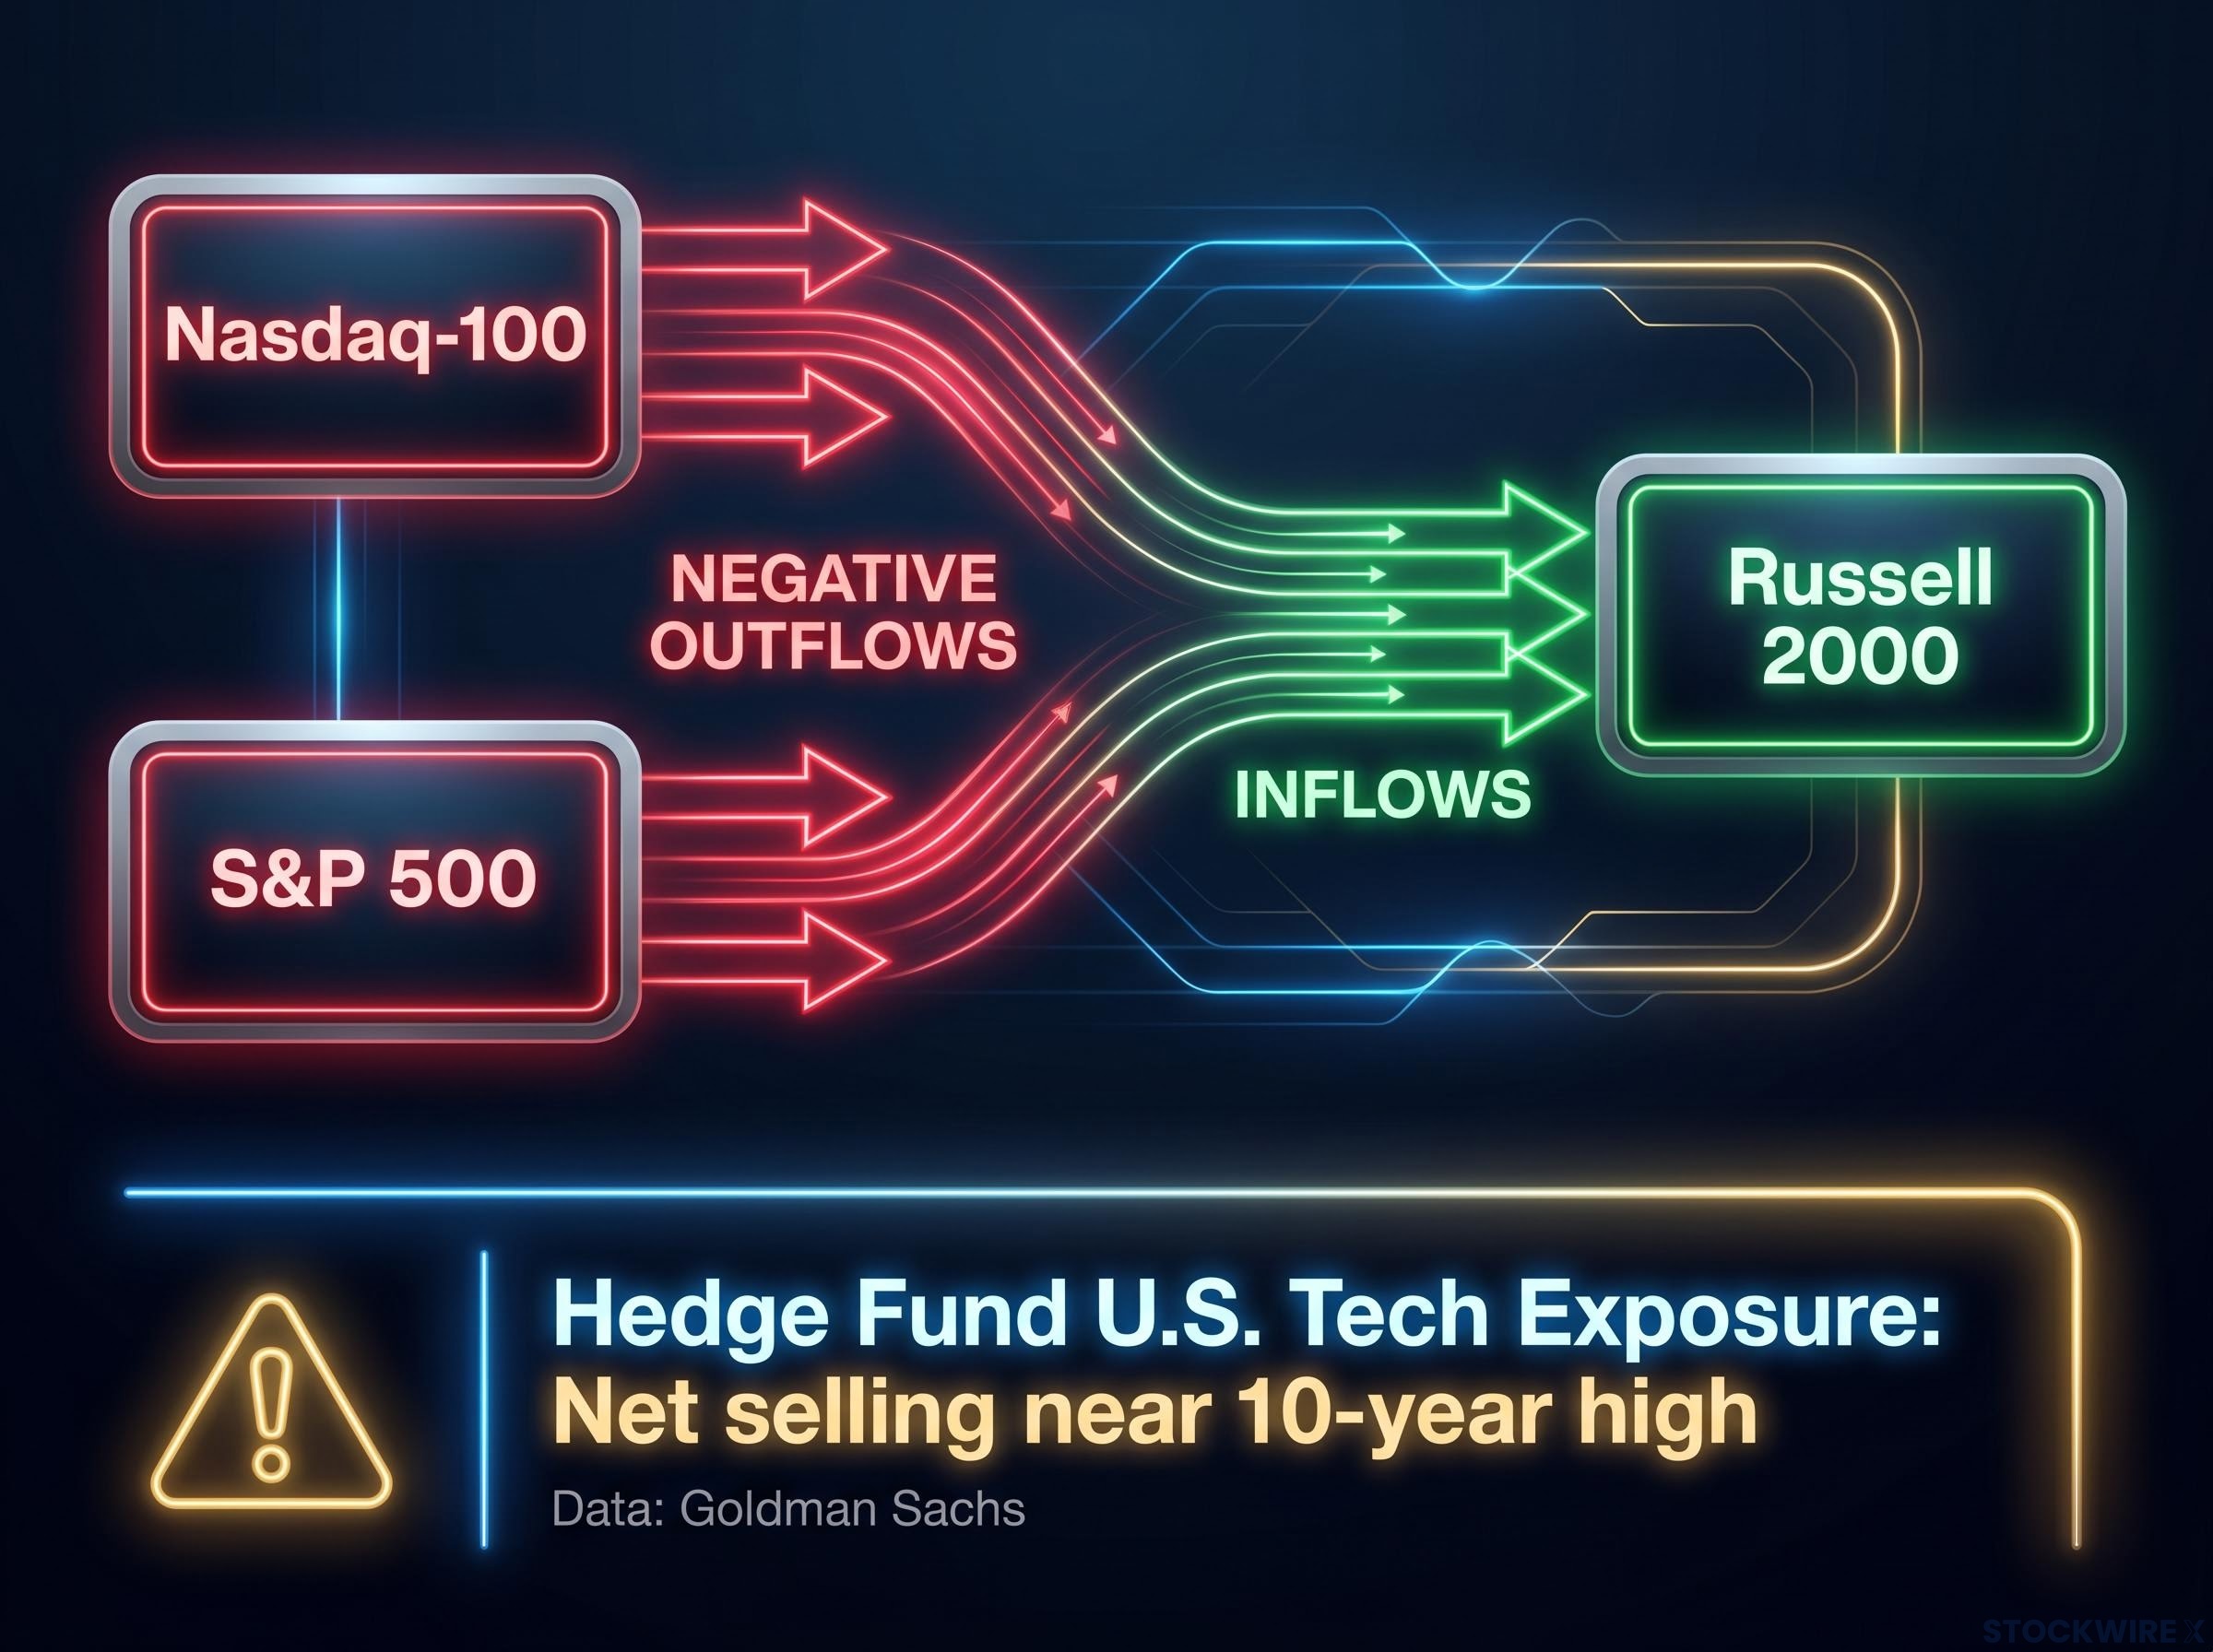
The distinction matters. When longs are profitable, a dip is a buying opportunity. When 80% of longs are underwater, the same dip becomes a trigger for exits. The danger is not the level of exposure alone but the combination of high exposure and deeply negative profit-and-loss profiles, which transforms potential buyers into potential sellers. Outflows have turned negative across both the Nasdaq-100 and the S&P 500, with money moving into the Russell 2000. Goldman Sachs data cited in the note reportedly show hedge funds cutting U.S. tech exposure, with net selling described as near a 10-year high, though that figure has not been independently verified.
The shift from profitable longs to loss-making longs is not just a worse P&L reading. It changes what price declines do to investor behaviour, and that distinction is the foundation for everything that follows.
Forced selling is not the same as voluntary de-risking. It is price-insensitive, rule-driven or margin-driven, and tends to cluster in time rather than spread out. Long liquidation risk refers to the probability that a large share of existing long positions are unwound not because investors changed their minds, but because market mechanics compelled them to sell.
Three channels drive it, and with 80% of Nasdaq longs already underwater, the buffers in all three are thinner than usual:
The risk here is not incremental selling pressure building gradually. It is simultaneous, non-discretionary selling across multiple participant types, which is why Citi’s finding changes the probability of an abrupt decline rather than just a slow grind lower.
CTA unwind pressure from systematic trend-following funds compounds the margin-call and redemption channels that Citi’s note highlights, with Bank of America estimating that at least half of existing Nasdaq CTA long positions remained intact after the June 6 selloff, meaning a further 1-2% index decline could trigger a second mechanical wave entirely separate from any discretionary investor decision-making.
The Nasdaq-100 is not simply having a bad month. Its vulnerability is structural, built from a specific combination of features that rarely align this unfavourably at the same time:
One internal nuance worth noting: other Citi teams, notably Chris Montagu’s group, have described aggregate S&P and Nasdaq futures positioning as near neutral. Chew’s focus is specifically on the P&L distribution of existing longs, a more granular lens that tells a different and more concerning story than headline net exposure data.
The Nasdaq’s exposure is not incidental to a bad stretch. It is a product of these specific structural features, and those features make a recovery harder to engineer precisely when most longs are already losing money.
The Nasdaq is not a contained risk in its current configuration. If forced selling accelerates, the spillover paths are direct and well-established.
The most immediate channel is index weight. Because mega-cap tech names are among the largest constituents of the S&P 500, forced selling in the Nasdaq can drag the broader U.S. market lower regardless of conditions in financials, healthcare, or industrials. You do not need to own a Nasdaq ETF to feel this; your S&P 500 allocation carries substantial large-cap tech exposure by default.
S&P 500 tech concentration has reached 37.5% by market capitalisation, exceeding the dot-com peak of approximately 34%, which means forced Nasdaq selling does not stay contained to technology portfolios: it mechanically transmits through every cap-weighted index fund holding large-cap growth names, amplifying index-level declines relative to what underlying business fundamentals alone would justify.
Citi identifies a fragile configuration, not an inevitable crash. The distinction matters: this is a probabilistic structural warning, not a prediction of when or how far markets fall.
The global dimension compounds the domestic one. Risk-off flows from U.S. tech can tighten financial conditions and raise volatility across regions and asset classes beyond U.S. equities. While the Russell 2000 and international equities may benefit from rotational inflows, a disorderly Nasdaq unwind can overwhelm those flows and turn a sector-level story into a broad risk-off event.
There is also a macro policy feedback loop. Severe equity stress can influence perceptions of the Federal Reserve’s room to maintain restrictive policy, even if equity markets are not the primary driver of rate decisions. Central banks monitor financial conditions, and disorderly tech selling becomes part of that calculus.
Even investors without direct Nasdaq exposure should recognise that a forced-selling cascade in tech would likely ripple through their portfolios via S&P 500 holdings, broader sentiment shifts, or tightened financial conditions.
These are not abstract market metrics. Each one tells you something specific about whether non-discretionary selling is active in the system, and monitoring them gives you informational edge over simply watching index levels.
FINRA margin debt statistics track aggregate debit balances in customer margin accounts on a monthly basis, providing one of the most direct publicly available measures of system-wide leveraged exposure and the pace at which forced deleveraging is occurring across U.S. equity markets.
The first distinction to make is between structural and tactical exposure. Long-horizon, unleveraged investors holding quality tech franchises face a fundamentally different risk profile than leveraged or short-horizon investors. The response should differ accordingly.
For investors wanting to quantify their implicit tech concentration across index-fund holdings before a Nasdaq stress event materialises, our full explainer on S&P 500 concentration risk walks through how cap-weighted index mechanics systematically compound technology overweights over time, with worked examples covering VOO, VTI, and common 401(k) default allocations.
Citi’s core positioning message applies even to high-conviction holders: the current technical and positioning backdrop can make the path more volatile and nonlinear than the fundamental case alone implies. Positioning and P&L distribution matter as much as fundamentals in shaping near-term price risk.
The question for each reader is not whether you believe in tech long-term. It is whether your current position structure would force you to sell at the worst possible moment if the cascade materialises.
This article is for informational purposes only and should not be considered financial advice. Investors should conduct their own research and consult with financial professionals before making investment decisions.
Citi’s note is not a crash call. It is the identification of a specific structural configuration that makes a disorderly decline more probable and more severe if additional selling pressure materialises.
The key asymmetry bears repeating: headline positioning data presents a picture of broad stability, but the P&L profile of Nasdaq longs has eroded to a degree that makes mechanical, self-reinforcing selling a materially elevated risk. The 80% figure is the specific diagnostic that distinguishes this setup from routine Nasdaq volatility.
The variables to watch from here are not macro forecasts or earnings revisions. They are the positioning and flow indicators outlined above, because those are what determine whether the fragile configuration tips into an active cascade. For now, the next meaningful move in the Nasdaq is more likely to be shaped by positioning dynamics and flow mechanics than by any new fundamental development.
These statements are forward-looking and subject to change based on market developments and positioning shifts.
Nasdaq forced selling risk refers to the probability that a large share of existing long positions are unwound not because investors changed their minds, but because margin calls, institutional risk limits, or investor redemptions compel them to sell regardless of their view. When 80% of those longs are already loss-making, as Citi's 30 June 2026 note identifies, the buffers against this kind of mechanical, non-discretionary selling are dangerously thin.
Citi strategist David Chew reported on 30 June 2026 that approximately 80% of Nasdaq-100 long positions are now estimated to be in the red, a material deterioration from an earlier assessment in which most longs were still profitable enough to allow quick exits on any negative catalyst.
When long positions are profitable, a price dip reads as a buying opportunity; when 80% of longs are underwater, the same dip becomes a trigger for exits, turning potential buyers into potential sellers and making self-reinforcing, mechanical selling far more likely than a gradual grind lower.
Key signals include sharp increases in put/call ratios and downside options skew, accelerating outflows from Nasdaq-tracking ETFs, a rapid decline in FINRA margin debt, a spike in the VXN volatility index combined with term structure inversion, rising short interest alongside still-high long exposure, and accelerating declines on negative catalysts with weak intraday recoveries.
Yes. Because mega-cap tech names represent roughly 37.5% of S&P 500 market capitalisation, forced selling in the Nasdaq transmits mechanically through every cap-weighted index fund holding large-cap growth names, amplifying index-level declines even for investors with no direct Nasdaq exposure.